|
Gene Information
|
Gene Name
|
CAD |
|
Gene ID
|
790
|
|
Gene Full Name
|
carbamoyl-phosphate synthetase 2, aspartate transcarbamylase, and dihydroorotase |
|
Gene Alias
|
CDG1Z; GATD4; EIEE50 |
|
Transcripts
|
ENSG00000084774
|
|
Virus
|
HTLV1 |
|
Gene Type
|
protein coding |
|
HPA Location Info
|
Nucleoplasm; 
|
|
HPA Protein Class Info
|
Cancer-related genes, Disease related genes, Enzymes, Plasma proteins, Potential drug targets, Predicted intracellular proteins |
|
Uniport_ID
|
P27708
|
|
HGNC ID
|
HGNC:1424
|
|
VEGA ID
|
OTTHUMG00000097070
|
|
OMIM ID
|
114010 |
|
String ID
|
9606.ENSP00000264705
|
|
Drugbank ID
|
BE0002227
|
|
PharmGKB ID
|
PA26023
|
Target gene [CAD] related to VISs 
| DVID |
Chromosome |
HM |
TFBS |
CA |
Sum of Overlapped Records |
Detail |
| 6004484 |
chr2 |
89 |
21 |
2 |
112 |
View |
| 6015625 |
chr9 |
12 |
2 |
|
14 |
View |
| 6021210 |
chr9 |
4 |
2 |
|
6 |
View |
| 6029766 |
chr9 |
1 |
|
|
1 |
View |
| 6029930 |
chr9 |
|
1 |
|
1 |
View |
| 6030663 |
chr9 |
|
|
|
0 |
View |
Relationship between gene expression and immune infiltrating cell level
| Data ID |
Disease |
Sample number |
Sample type |
|
GSE55851 (GEO) |
Adult T-cell leukemia |
21 |
Normal (3), Asymptomatic carriers (HTLV1+)(6), Adult T-cell Leukemia-lymphoma (HTLV1+)(12) |
|
GSE29312 (GEO) |
HTLV-1 associated myelopathy |
39 |
Normal (9), Asymptomatic carriers (HTLV1+)(20), HTLV-1-associated myelopathy (HTLV1+)(10) |
|
GSE29332 (GEO) |
HTLV-1 associated myelopathy |
35 |
Normal (8), Asymptomatic carriers (HTLV1+)(17), HTLV-1-associated myelopathy (HTLV1+)(10) |
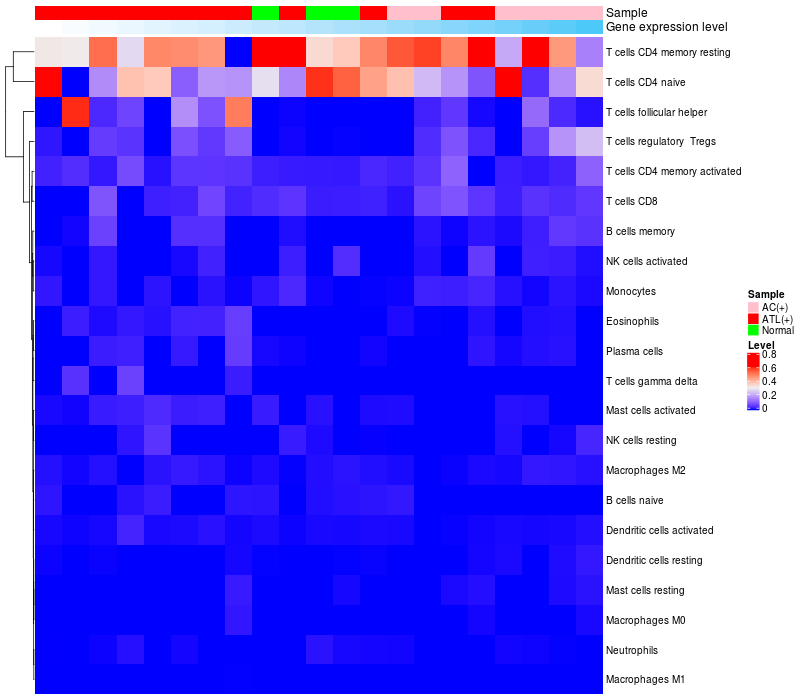
> Dataset: GSE55851
|
|
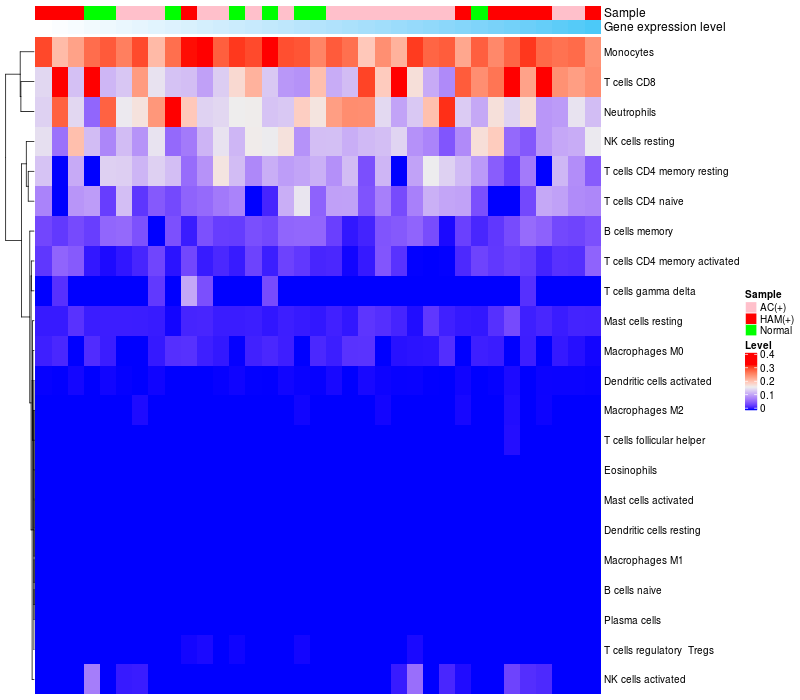
HeatMap of cell type fractions in all samples
|
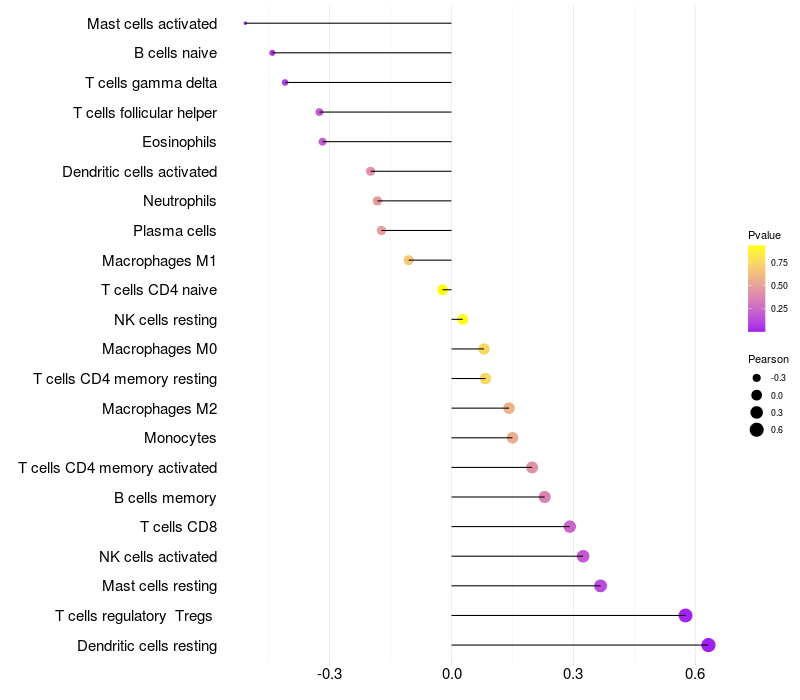
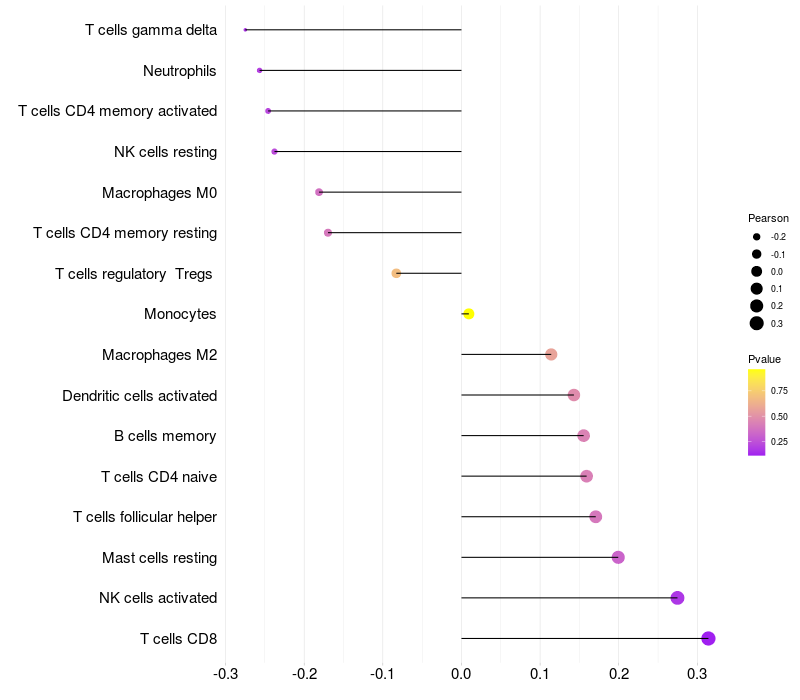
Lollipop of CAD expression and immune infiltrating cell level correlation result in HTLV1+ samples
|
CAD expression: Low -> High
|
|
|
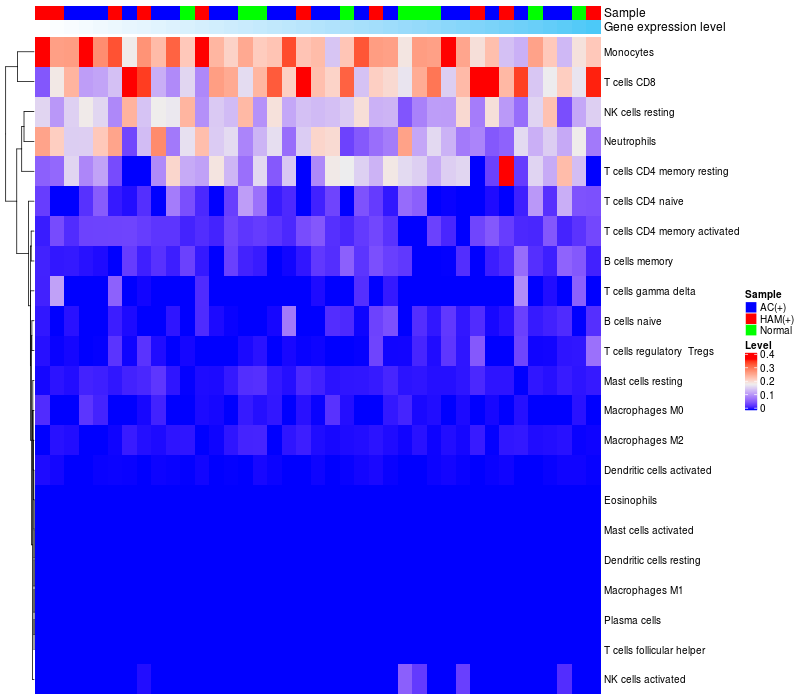
> Dataset: GSE29312
|
|
HeatMap of cell type fractions in all samples
|
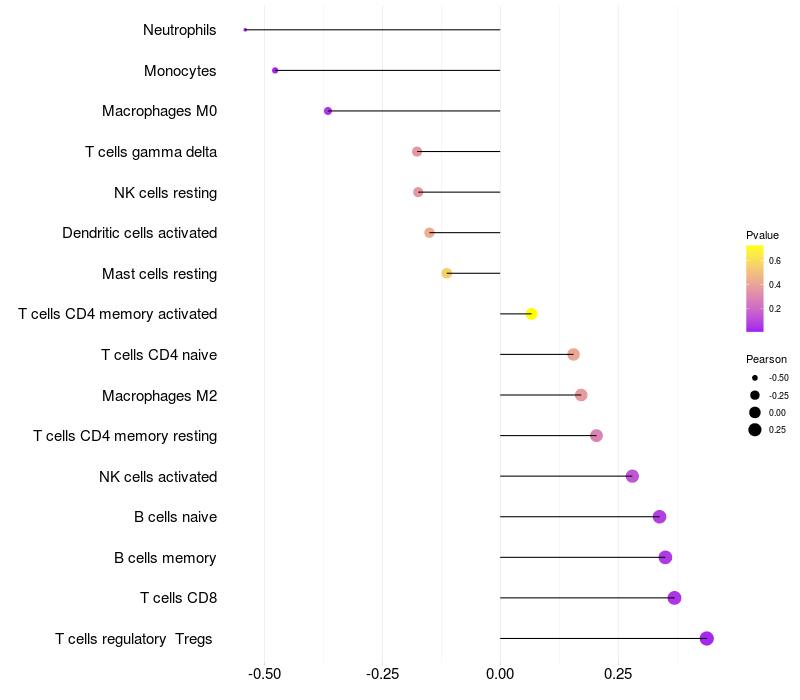
Lollipop of CAD expression and immune infiltrating cell level correlation result in HTLV1+ samples
|
CAD expression: Low -> High
|
|
|
> Dataset: GSE29332
|
|
HeatMap of cell type fractions in all samples
|
Lollipop of CAD expression and immune infiltrating cell level correlation result in HTLV1+ samples
|
CAD expression: Low -> High
|
|
|
|
|
 HTLV1 Target gene Detail Information