> Dataset: GSE102203
|
|
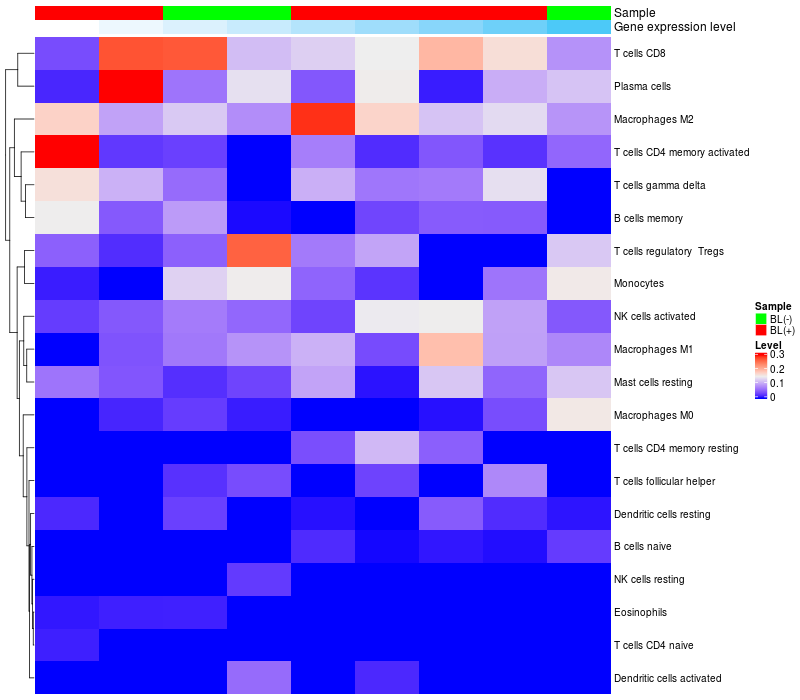
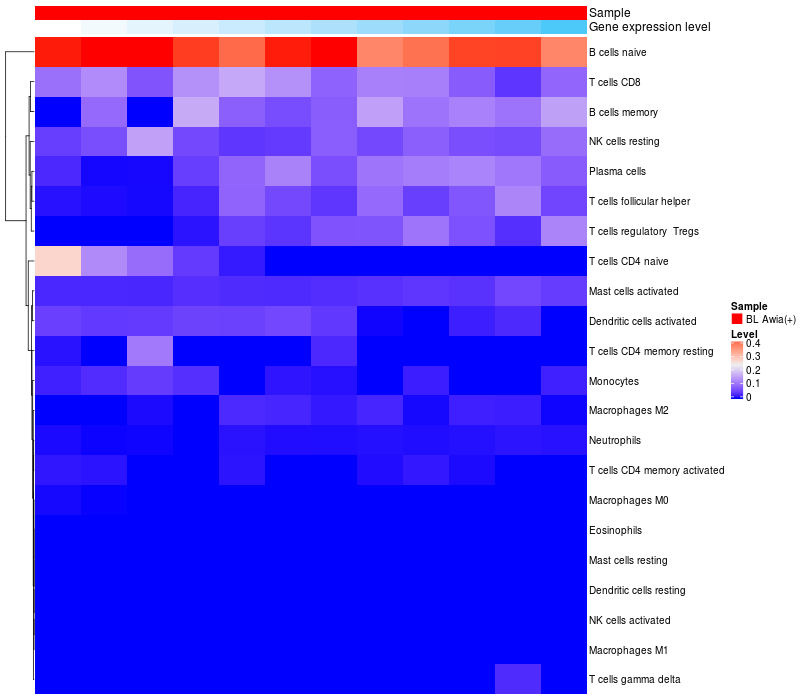
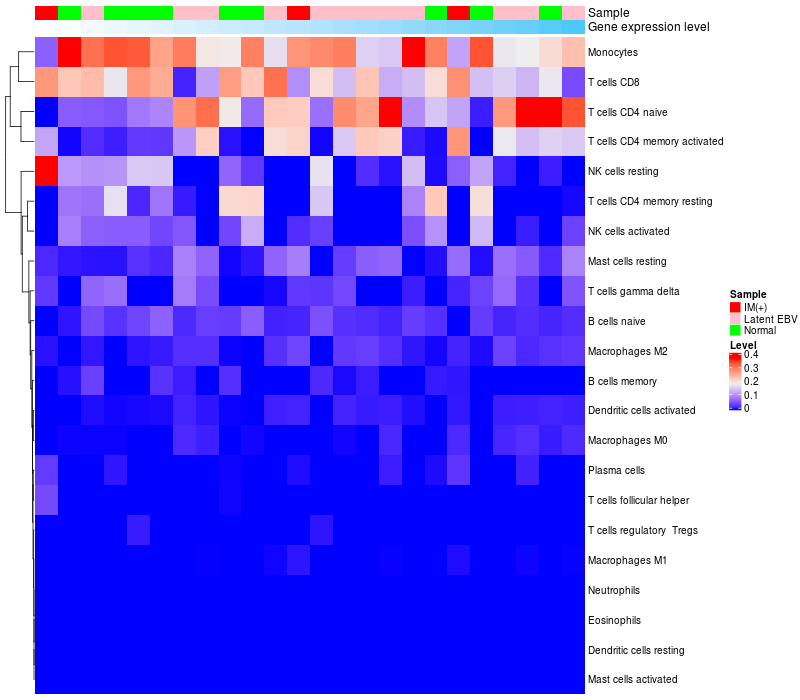
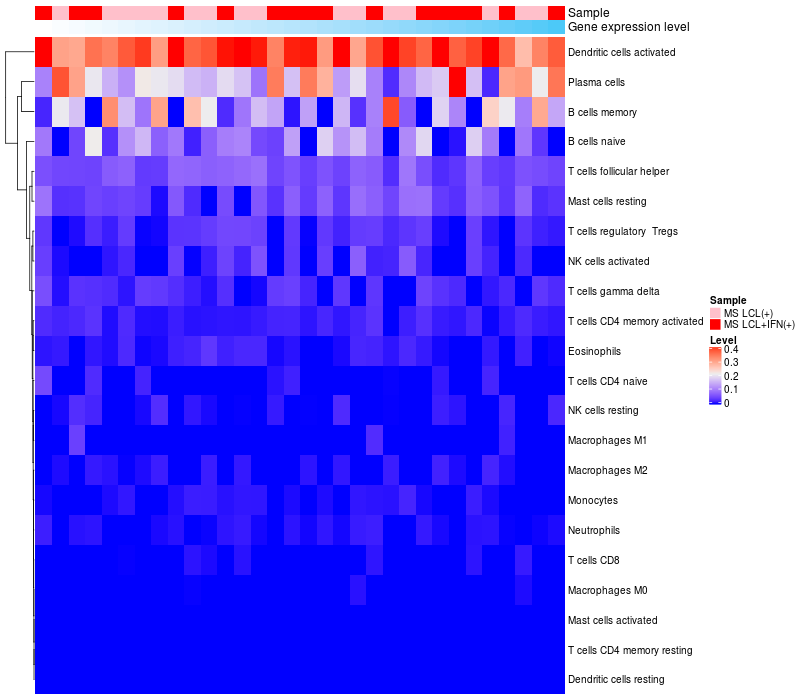
HeatMap of cell type fractions in all samples
|
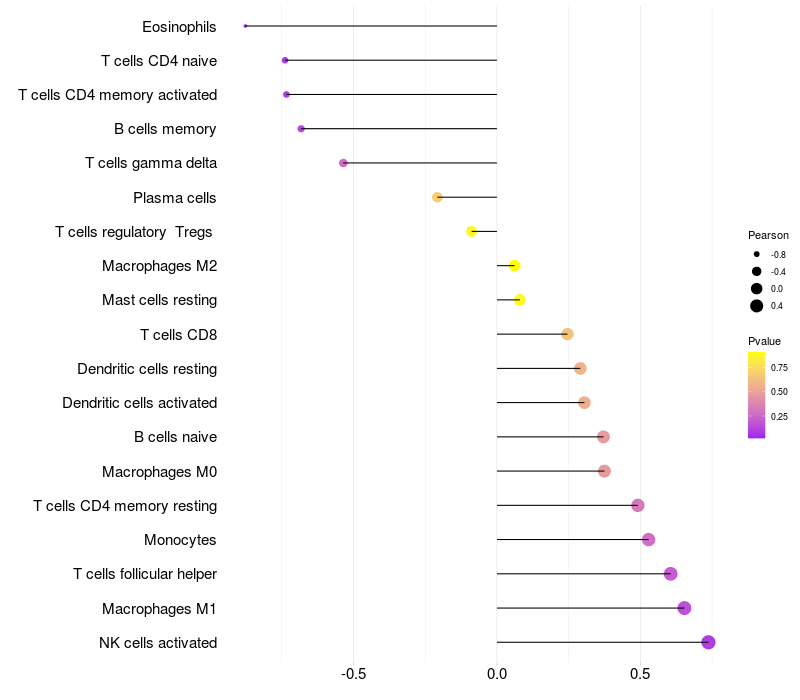
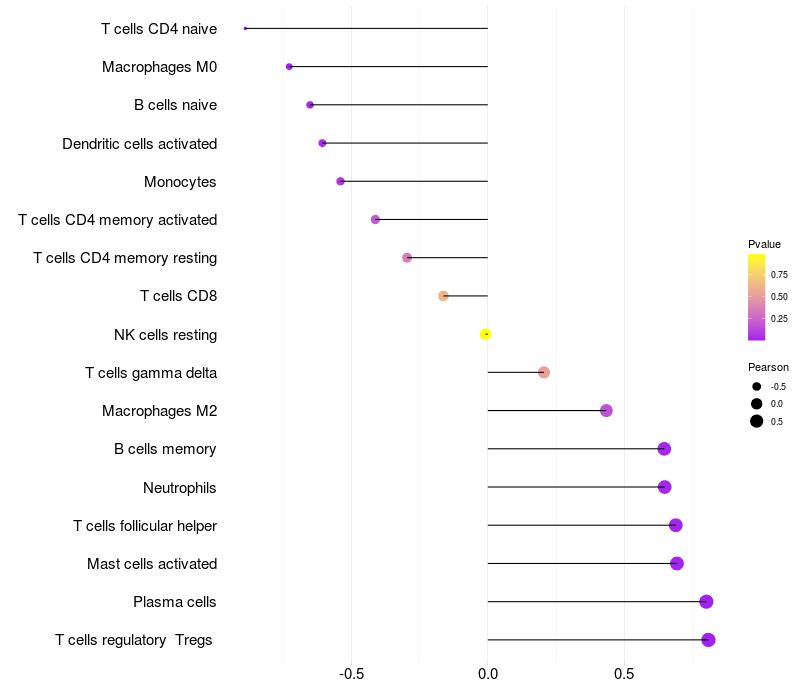
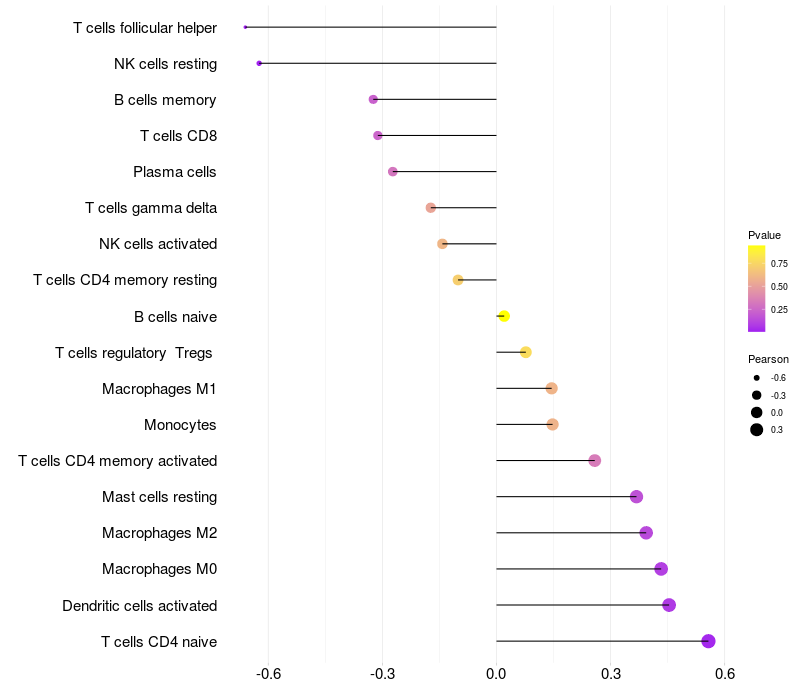
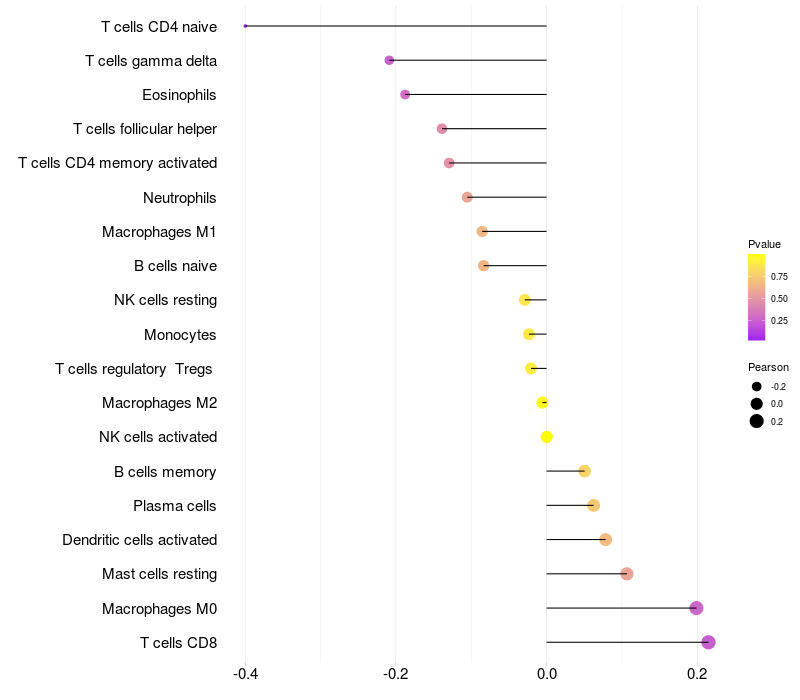
Lollipop of CAMTA1 expression and immune infiltrating cell level correlation result in EBV+ samples
|
CAMTA1 expression: Low -> High
|
|
|
> Dataset: GSE100458
|
|
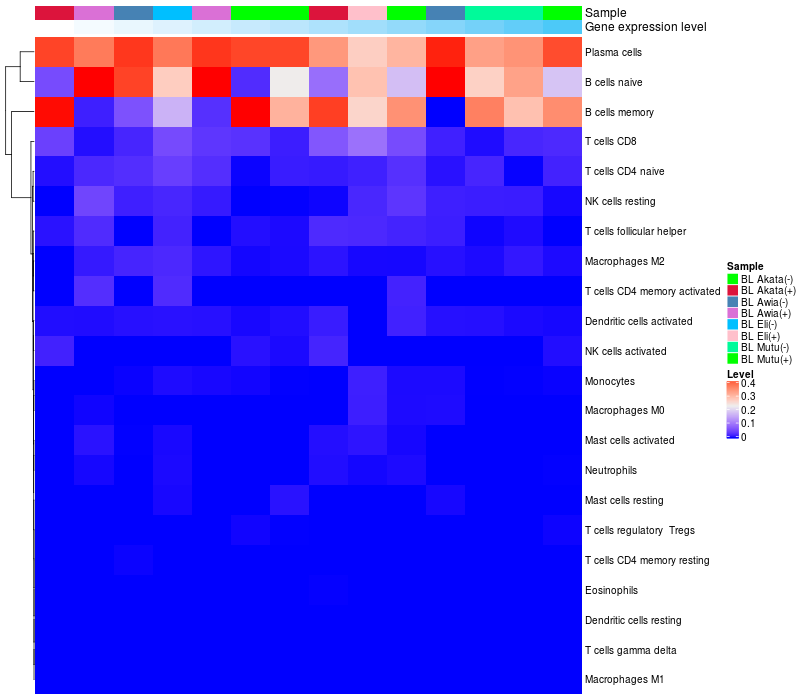
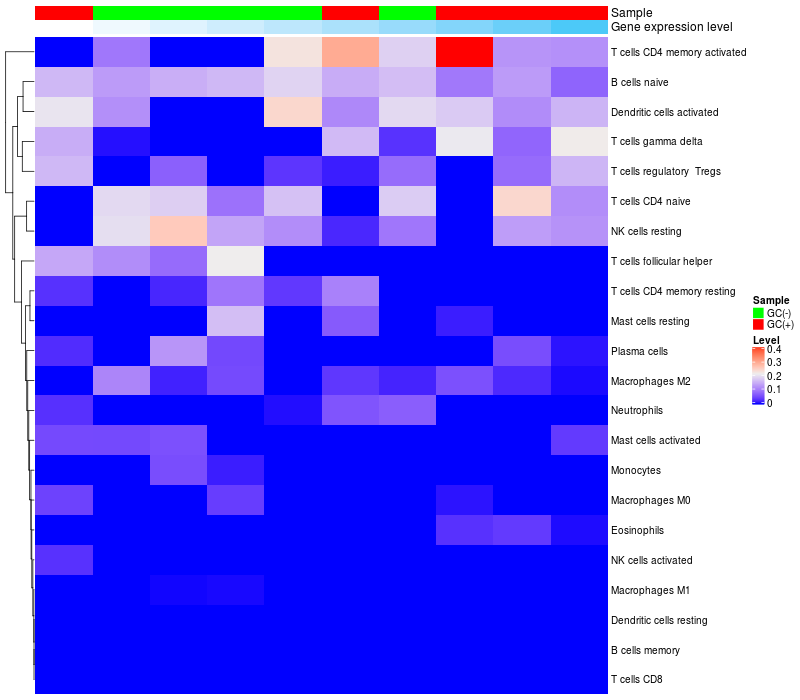
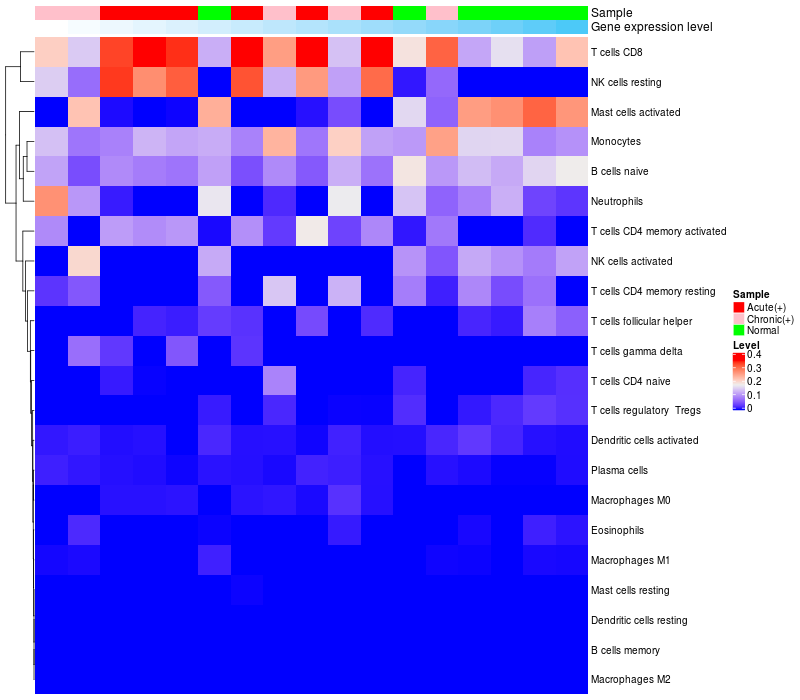
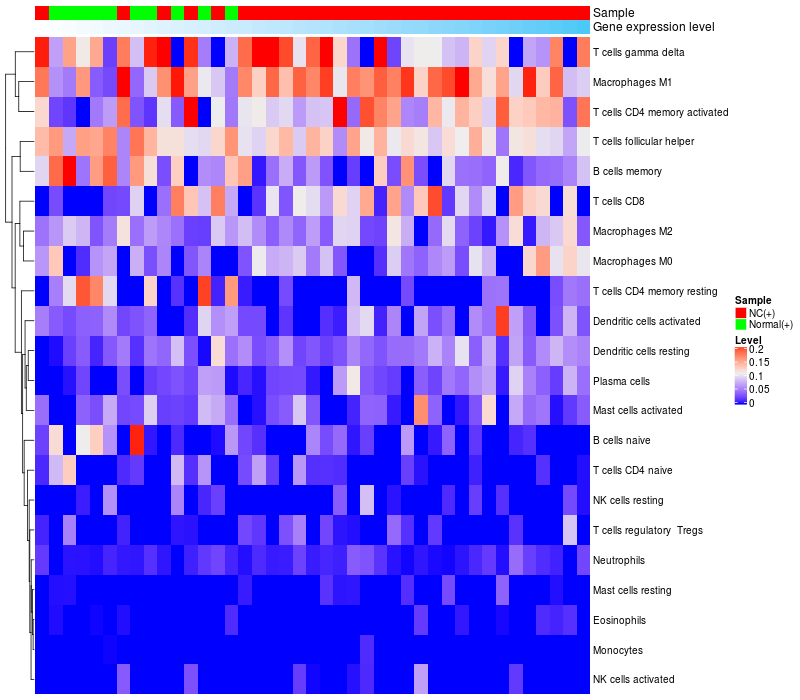
HeatMap of cell type fractions in all samples
|
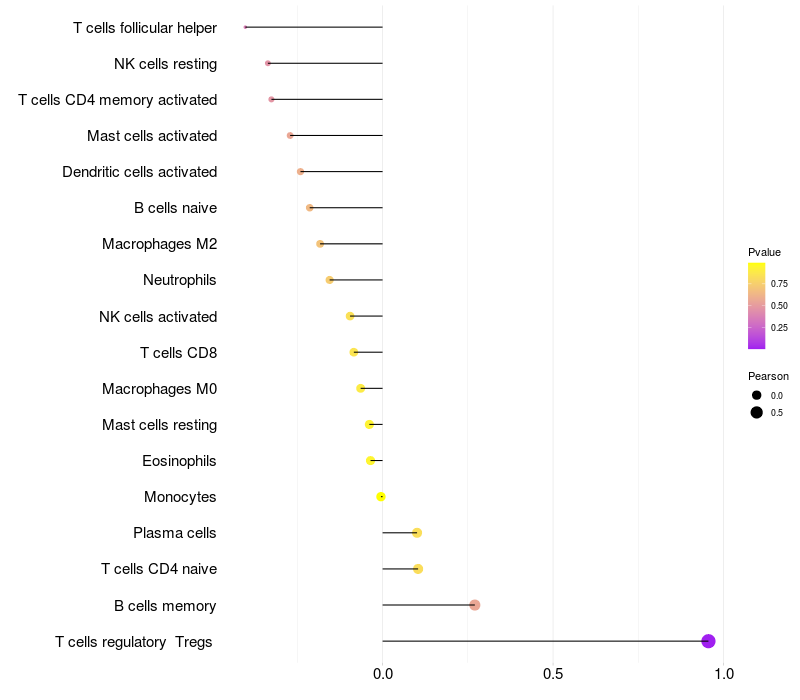
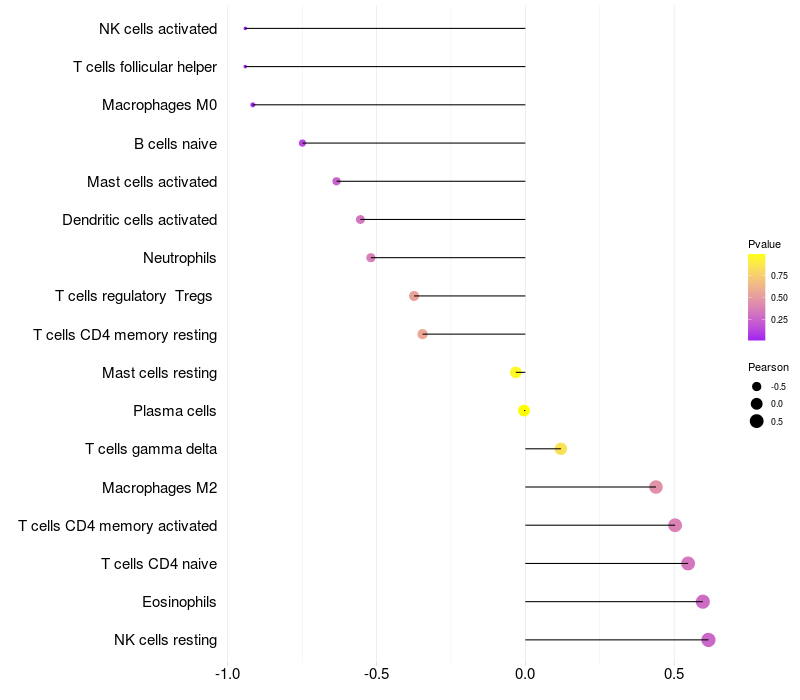
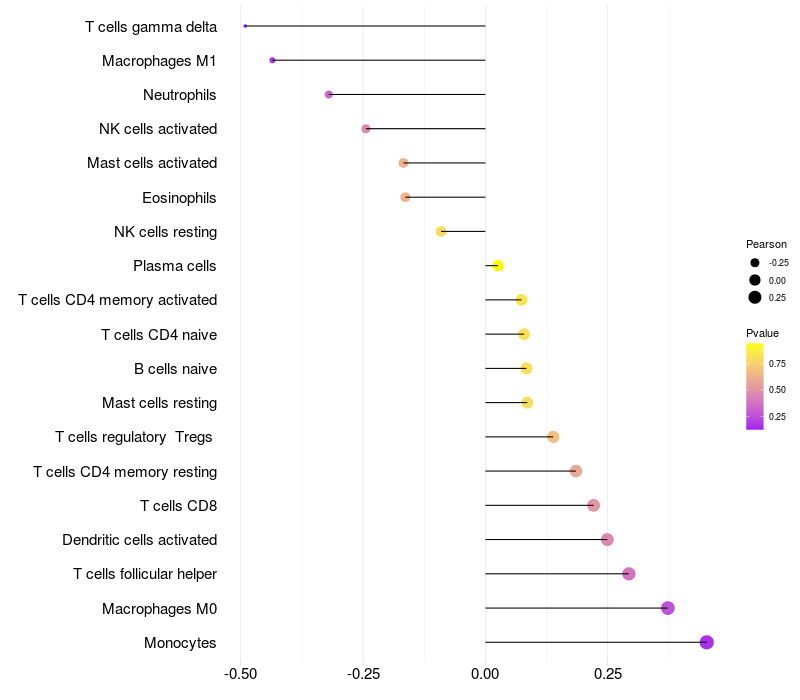
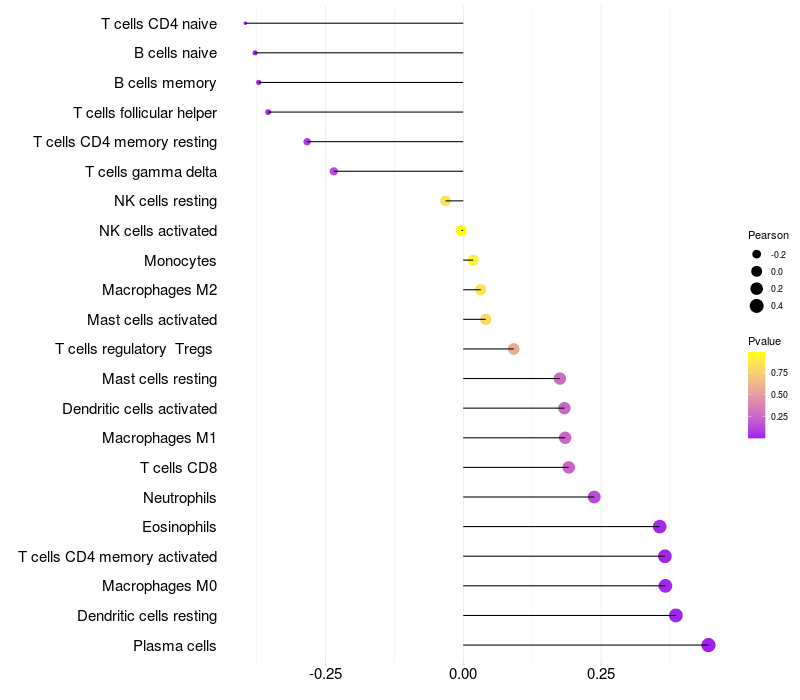
Lollipop of CAMTA1 expression and immune infiltrating cell level correlation result in EBV+ samples
|
CAMTA1 expression: Low -> High
|
|
|
> Dataset: GSE42867
|
|
HeatMap of cell type fractions in all samples
|
Lollipop of CAMTA1 expression and immune infiltrating cell level correlation result in EBV+ samples
|
CAMTA1 expression: Low -> High
|
|
|
> Dataset: GSE135644
|
|
HeatMap of cell type fractions in all samples
|
Lollipop of CAMTA1 expression and immune infiltrating cell level correlation result in EBV+ samples
|
CAMTA1 expression: Low -> High
|
|
|
> Dataset: GSE45919
|
|
HeatMap of cell type fractions in all samples
|
Lollipop of CAMTA1 expression and immune infiltrating cell level correlation result in EBV+ samples
|
CAMTA1 expression: Low -> High
|
|
|
> Dataset: GSE85599
|
|
HeatMap of cell type fractions in all samples
|
Lollipop of CAMTA1 expression and immune infiltrating cell level correlation result in EBV+ samples
|
CAMTA1 expression: Low -> High
|
|
|
> Dataset: GSE58240
|
|
HeatMap of cell type fractions in all samples
|
Lollipop of CAMTA1 expression and immune infiltrating cell level correlation result in EBV+ samples
|
CAMTA1 expression: Low -> High
|
|
|
> Dataset: GSE12452
|
|
HeatMap of cell type fractions in all samples
|
Lollipop of CAMTA1 expression and immune infiltrating cell level correlation result in EBV+ samples
|
CAMTA1 expression: Low -> High
|
|
|

 EBV Target gene Detail Information