|
Gene Information
|
Gene Name
|
DRD3 |
|
Gene ID
|
1814
|
|
Gene Full Name
|
dopamine receptor D3 |
|
Gene Alias
|
D3DR; ETM1; FET1 |
|
Transcripts
|
ENSG00000151577
|
|
Virus
|
HTLV1 |
|
Gene Type
|
protein coding |
|
HPA Location Info
|

|
|
Membrane Info
|
Predicted membrane proteins |
|
HPA Protein Class Info
|
Disease related genes, FDA approved drug targets, G-protein coupled receptors, Predicted membrane proteins, Transporters |
|
Uniport_ID
|
P35462
|
|
HGNC ID
|
HGNC:3024
|
|
VEGA ID
|
OTTHUMG00000159334
|
|
OMIM ID
|
126451 |
|
String ID
|
9606.ENSP00000373169
|
|
Drugbank ID
|
BE0000581
|
|
PharmGKB ID
|
PA27479
|
Target gene [DRD3] related to VISs 
| DVID |
Chromosome |
HM |
TFBS |
CA |
Sum of Overlapped Records |
Detail |
| 6004406 |
chr13 |
96 |
20 |
1 |
117 |
View |
| 6011052 |
chr13 |
23 |
4 |
1 |
28 |
View |
| 6019809 |
chr3 |
6 |
1 |
|
7 |
View |
| 6022967 |
chr13 |
4 |
|
|
4 |
View |
| 6028852 |
chr13 |
1 |
|
|
1 |
View |
| 6030691 |
chr13 |
|
|
|
0 |
View |
| 6030706 |
chr13 |
|
|
|
0 |
View |
Relationship between gene expression and immune infiltrating cell level
| Data ID |
Disease |
Sample number |
Sample type |
|
GSE55851 (GEO) |
Adult T-cell leukemia |
21 |
Normal (3), Asymptomatic carriers (HTLV1+)(6), Adult T-cell Leukemia-lymphoma (HTLV1+)(12) |
|
GSE29312 (GEO) |
HTLV-1 associated myelopathy |
39 |
Normal (9), Asymptomatic carriers (HTLV1+)(20), HTLV-1-associated myelopathy (HTLV1+)(10) |
|
GSE29332 (GEO) |
HTLV-1 associated myelopathy |
35 |
Normal (8), Asymptomatic carriers (HTLV1+)(17), HTLV-1-associated myelopathy (HTLV1+)(10) |
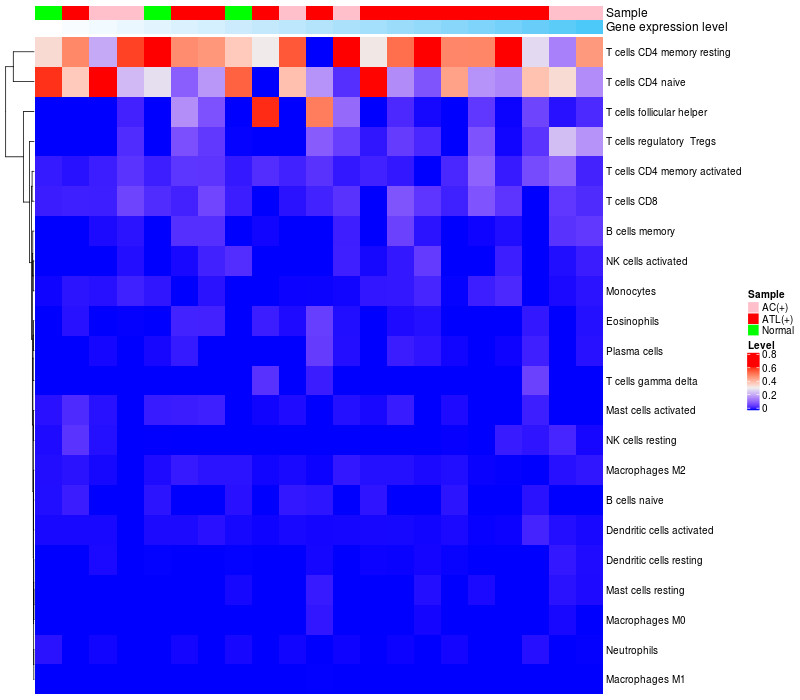
> Dataset: GSE55851
|
|
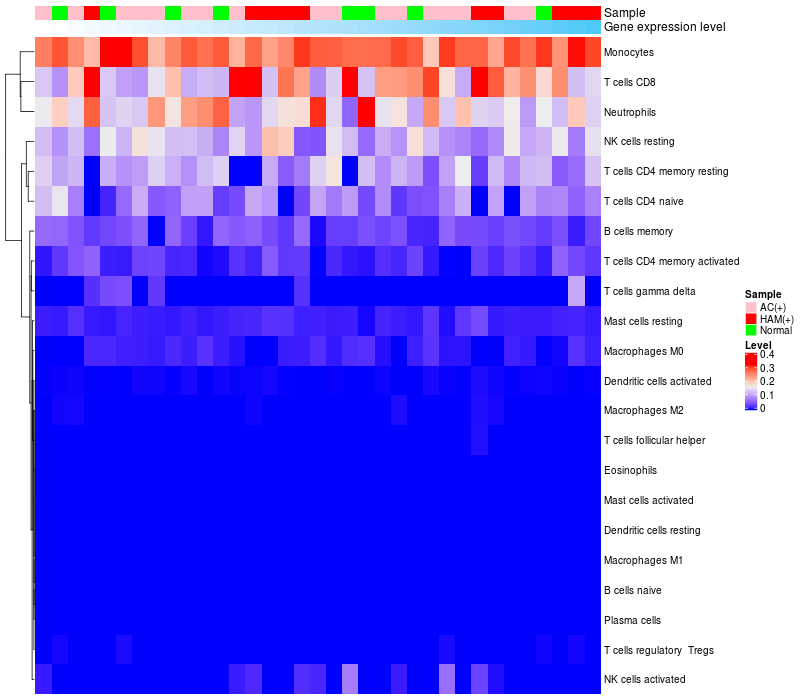
HeatMap of cell type fractions in all samples
|
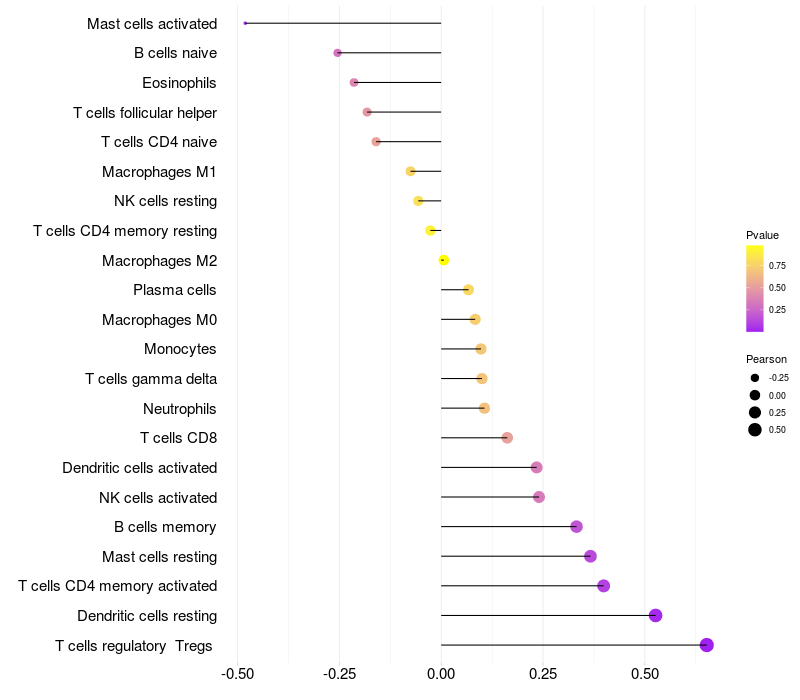
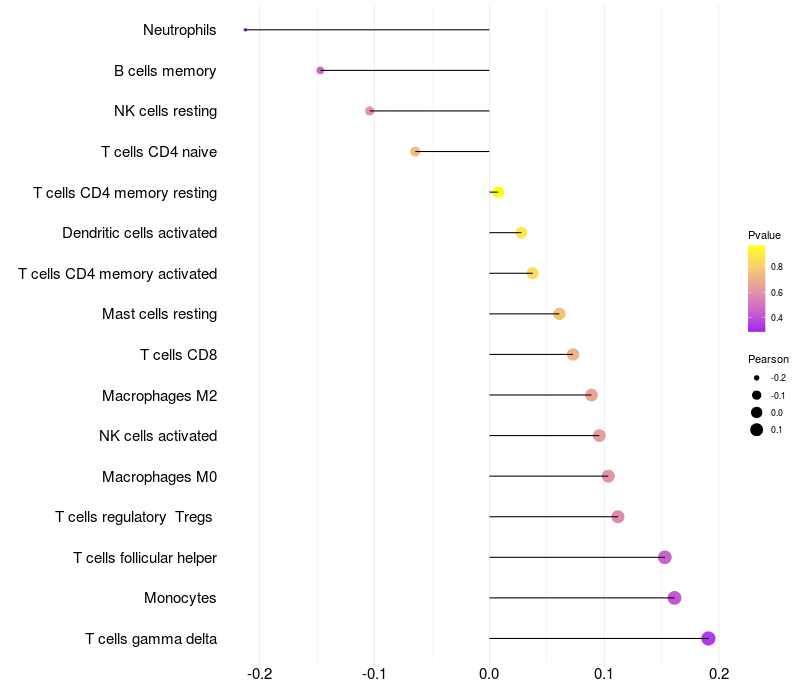
Lollipop of DRD3 expression and immune infiltrating cell level correlation result in HTLV1+ samples
|
DRD3 expression: Low -> High
|
|
|
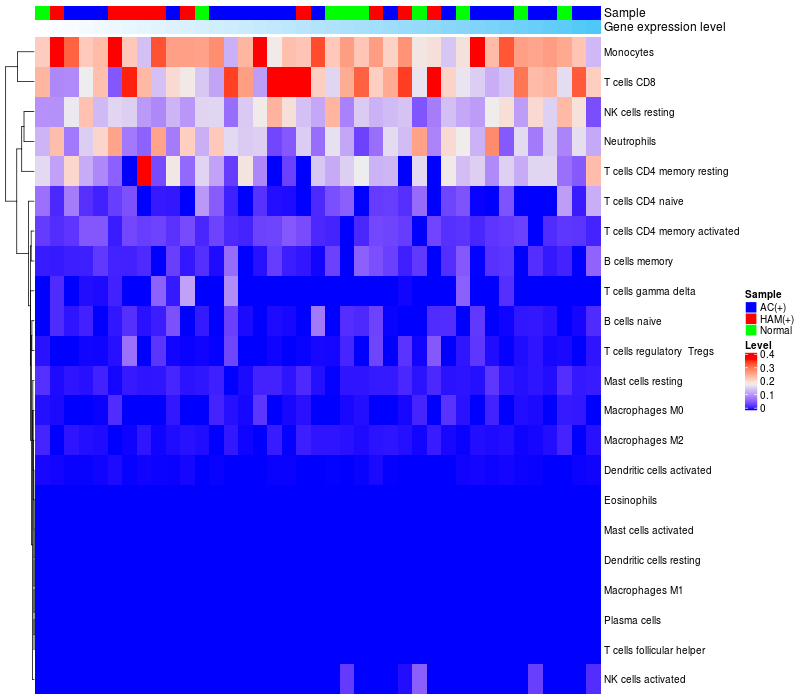
> Dataset: GSE29312
|
|
HeatMap of cell type fractions in all samples
|
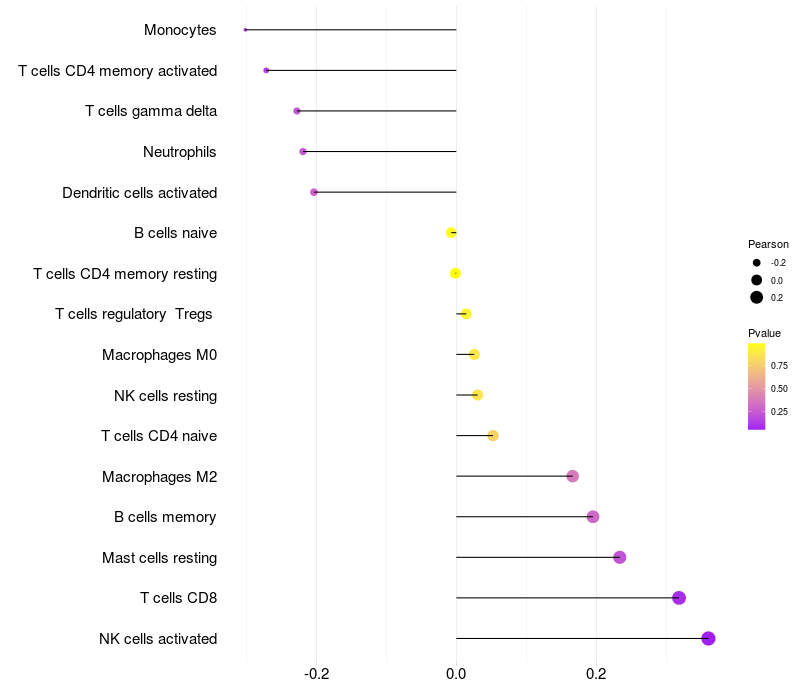
Lollipop of DRD3 expression and immune infiltrating cell level correlation result in HTLV1+ samples
|
DRD3 expression: Low -> High
|
|
|
> Dataset: GSE29332
|
|
HeatMap of cell type fractions in all samples
|
Lollipop of DRD3 expression and immune infiltrating cell level correlation result in HTLV1+ samples
|
DRD3 expression: Low -> High
|
|
|
|
|

 HTLV1 Target gene Detail Information