|
Gene Information
|
Gene Name
|
RET |
|
Gene ID
|
5979
|
|
Gene Full Name
|
ret proto-oncogene |
|
Gene Alias
|
PTC; MTC1; HSCR1; MEN2A; MEN2B; CDHF12; CDHR16; RET-ELE1 |
|
Transcripts
|
ENSG00000165731
|
|
Virus
|
HTLV1 |
|
Gene Type
|
protein coding |
|
HPA Location Info
|
Cytosol;Golgi apparatus;Plasma membrane; 
|
|
Membrane Info
|
Predicted membrane proteins |
|
HPA Protein Class Info
|
Cancer-related genes, Disease related genes, Enzymes, FDA approved drug targets, Plasma proteins, Predicted intracellular proteins, Predicted membrane proteins |
|
Gene Function
|
Oncogene
|
|
Uniport_ID
|
P07949
|
|
HGNC ID
|
HGNC:9967
|
|
VEGA ID
|
OTTHUMG00000018024
|
|
OMIM ID
|
164761 |
|
String ID
|
9606.ENSP00000347942
|
|
Drugbank ID
|
BE0001104;
BE0002411
|
|
PharmGKB ID
|
PA34335
|
|
FDA Approved Drug
|
Cabozantinib;Pralsetinib;Selpercatinib |
Target gene [RET] related to VISs 
| DVID |
Chromosome |
HM |
TFBS |
CA |
Sum of Overlapped Records |
Detail |
| 6016661 |
chr10 |
10 |
1 |
1 |
12 |
View |
Relationship between gene expression and immune infiltrating cell level
| Data ID |
Disease |
Sample number |
Sample type |
|
GSE55851 (GEO) |
Adult T-cell leukemia |
21 |
Normal (3), Asymptomatic carriers (HTLV1+)(6), Adult T-cell Leukemia-lymphoma (HTLV1+)(12) |
|
GSE29312 (GEO) |
HTLV-1 associated myelopathy |
39 |
Normal (9), Asymptomatic carriers (HTLV1+)(20), HTLV-1-associated myelopathy (HTLV1+)(10) |
|
GSE29332 (GEO) |
HTLV-1 associated myelopathy |
35 |
Normal (8), Asymptomatic carriers (HTLV1+)(17), HTLV-1-associated myelopathy (HTLV1+)(10) |
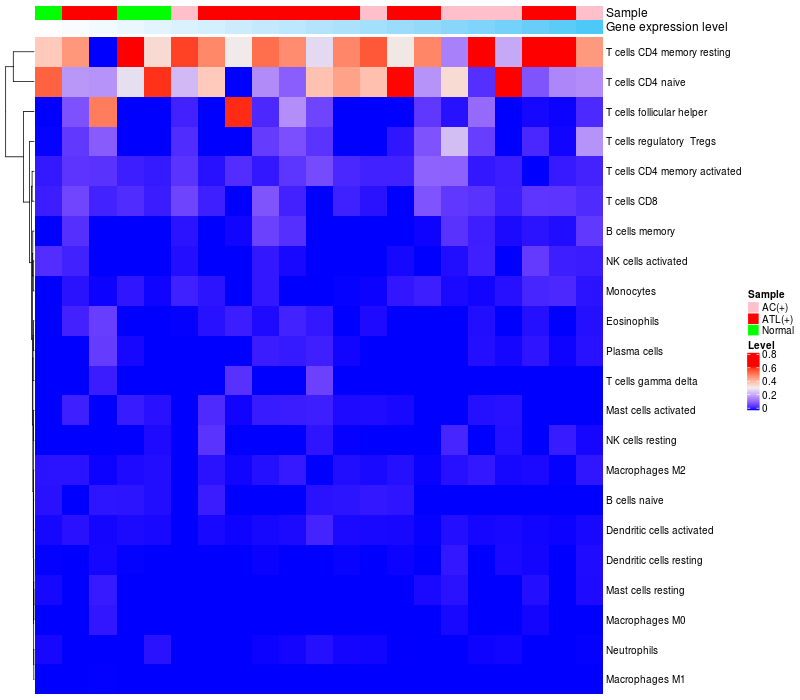
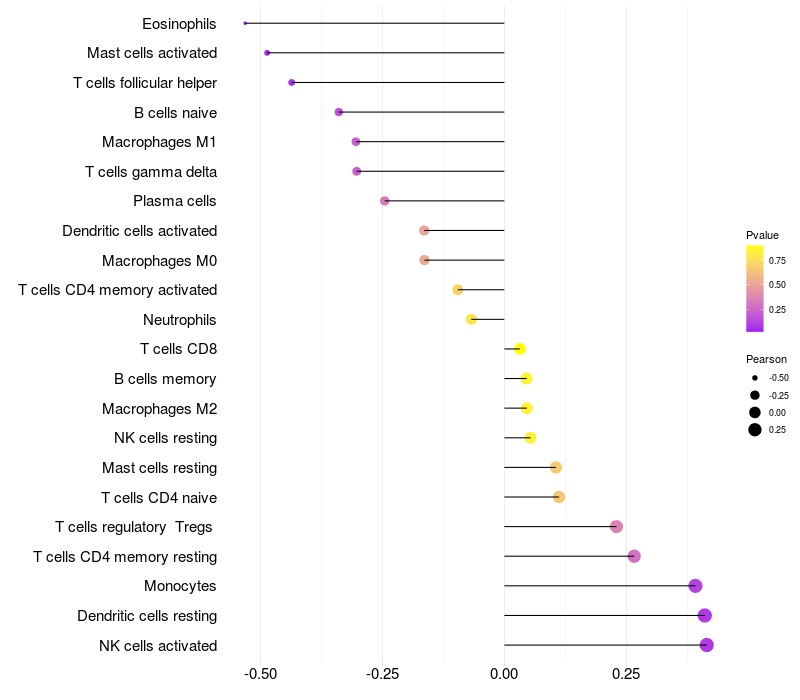
> Dataset: GSE55851
|
|
HeatMap of cell type fractions in all samples
|
Lollipop of RET expression and immune infiltrating cell level correlation result in HTLV1+ samples
|
RET expression: Low -> High
|
|
|
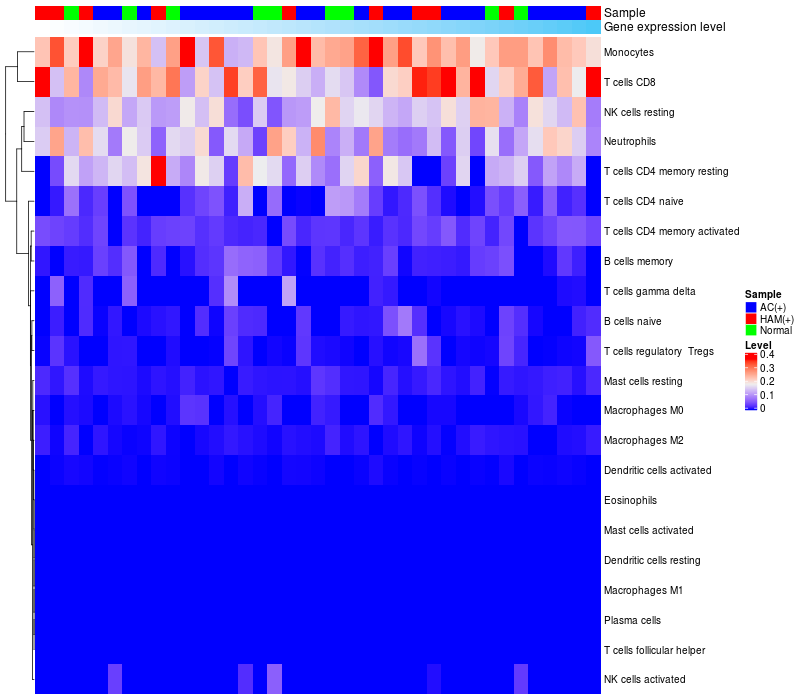
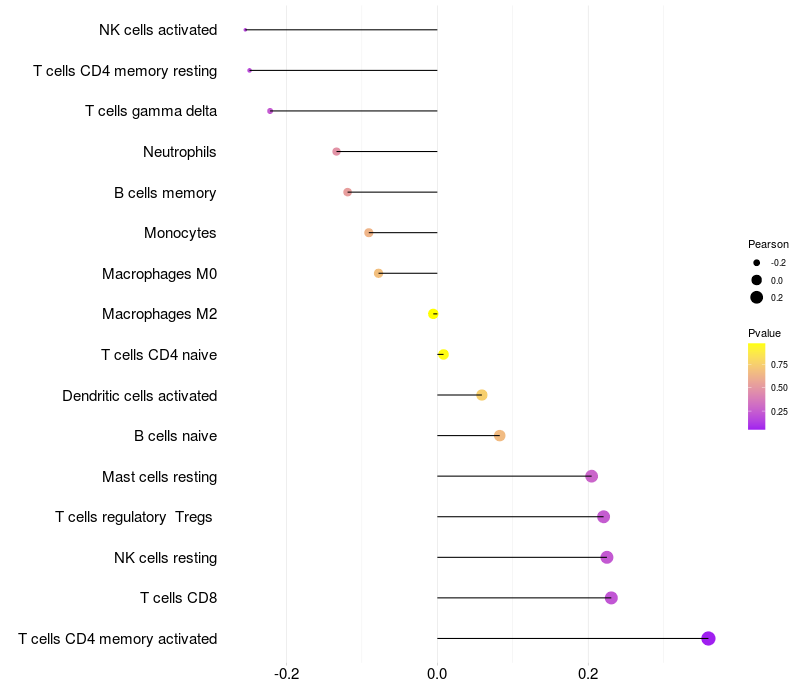
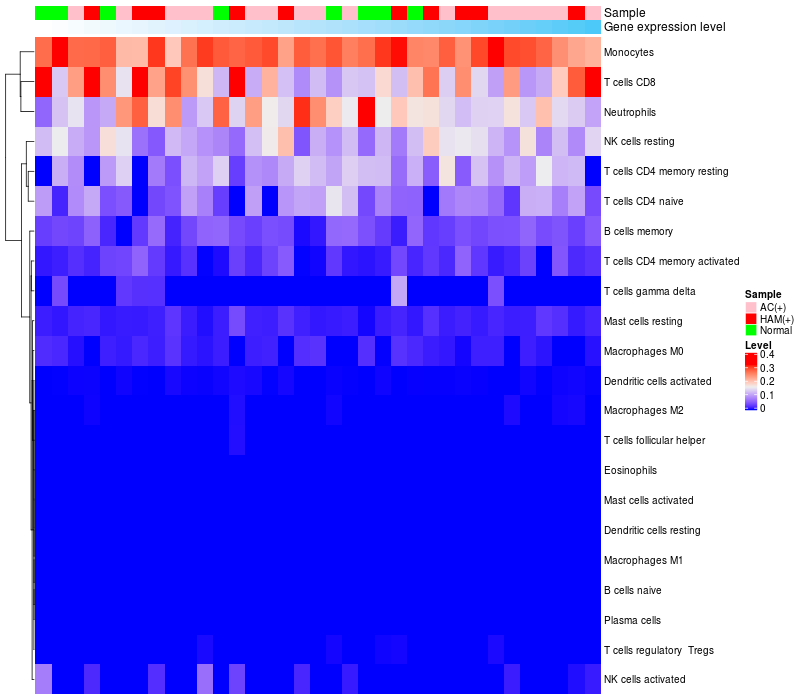
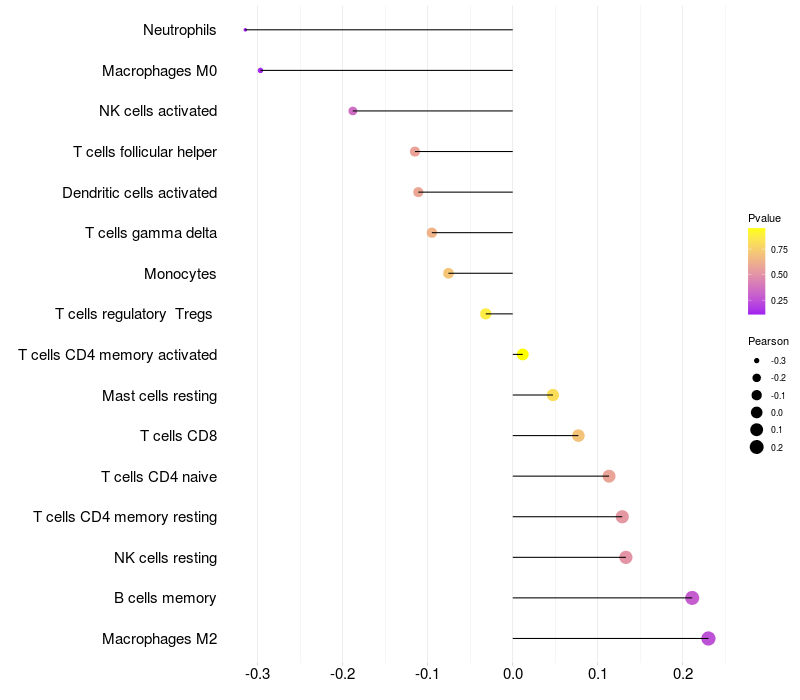
> Dataset: GSE29312
|
|
HeatMap of cell type fractions in all samples
|
Lollipop of RET expression and immune infiltrating cell level correlation result in HTLV1+ samples
|
RET expression: Low -> High
|
|
|
> Dataset: GSE29332
|
|
HeatMap of cell type fractions in all samples
|
Lollipop of RET expression and immune infiltrating cell level correlation result in HTLV1+ samples
|
RET expression: Low -> High
|
|
|
|
|

 HTLV1 Target gene Detail Information