HTLV1 Target gene Detail Information

> SPTBN4 Gene Search Result


Gene Information
Gene Name SPTBN4
Gene ID 57731
Gene Full Name spectrin beta, non-erythrocytic 4
Gene Alias QV; CMND; SPNB4; NEDHND; SPTBN3
Transcripts ENSG00000160460
Virus HTLV1
Gene Type protein coding
HPA Location Info Nucleoli;Nucleoplasm;
HPA Protein Class Info Disease related genes, Plasma proteins, Predicted intracellular proteins
Uniport_ID Q9H254
HGNC ID HGNC:14896
VEGA ID OTTHUMG00000182592
OMIM ID 606214
String ID 9606.ENSP00000263373
PharmGKB ID PA37918
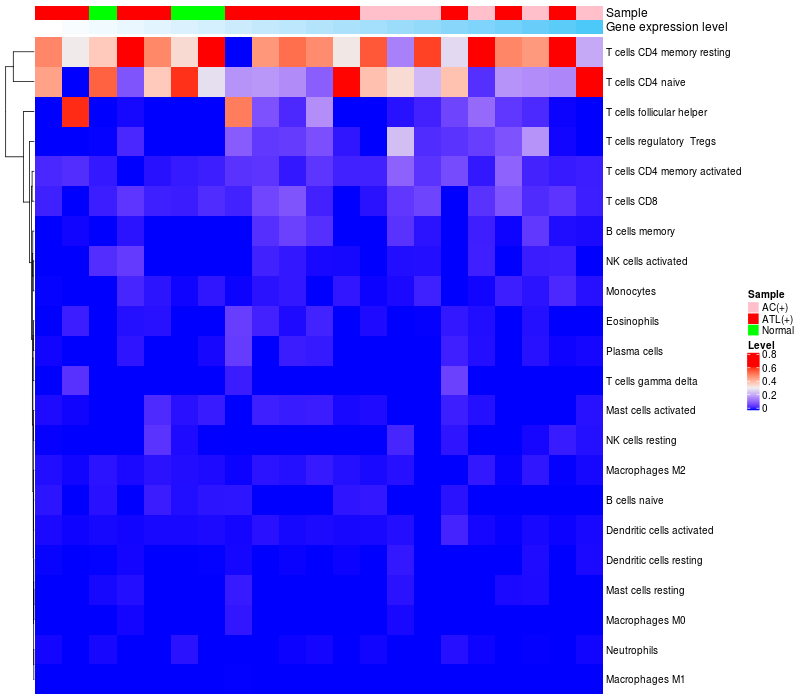
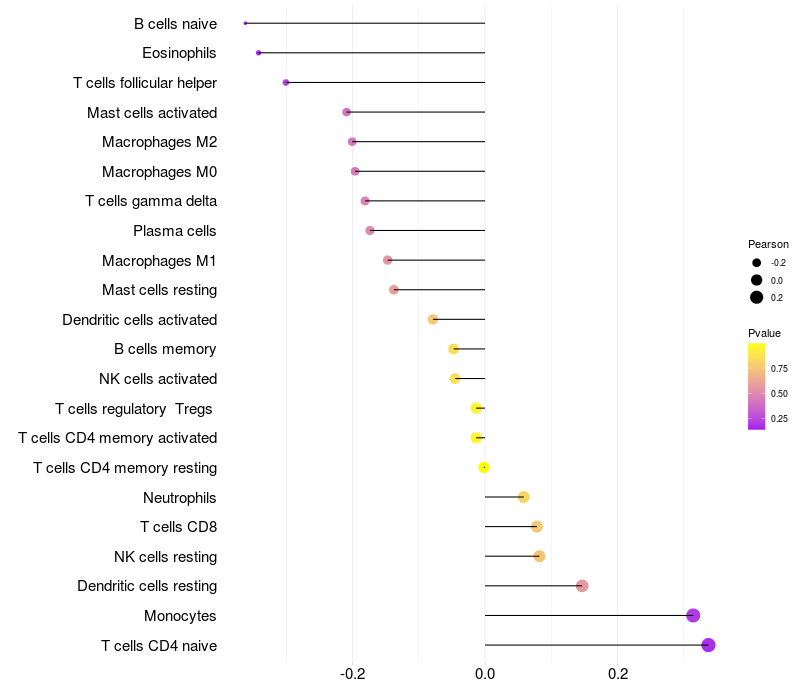
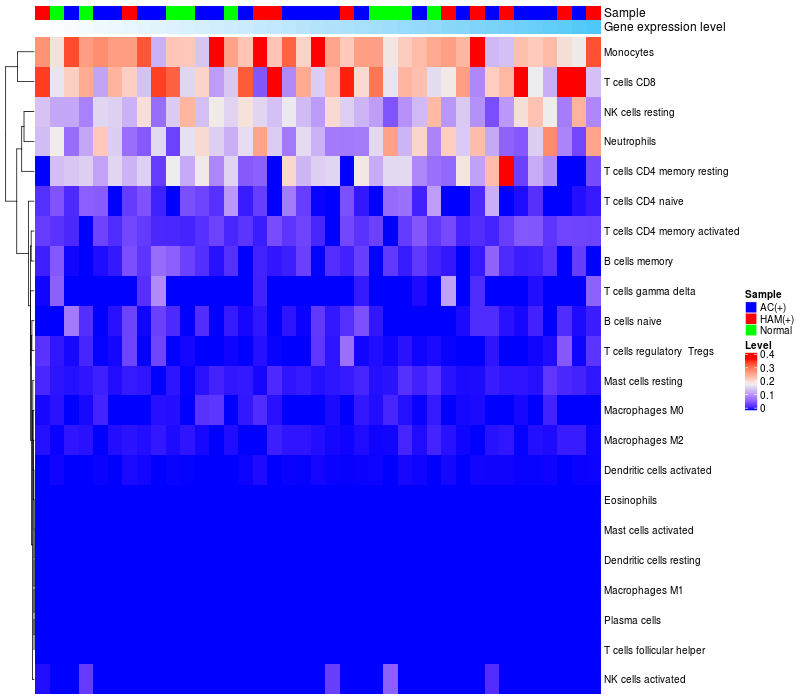
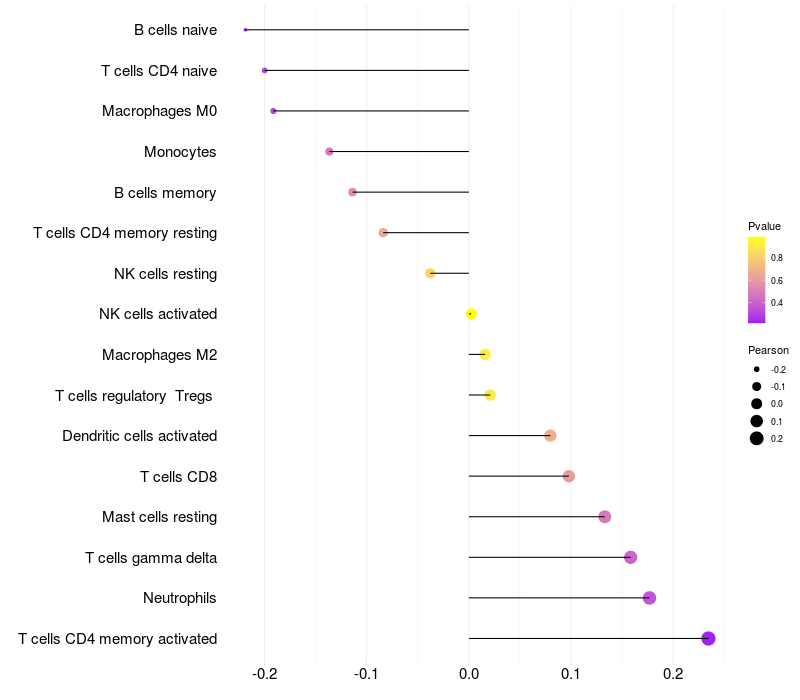
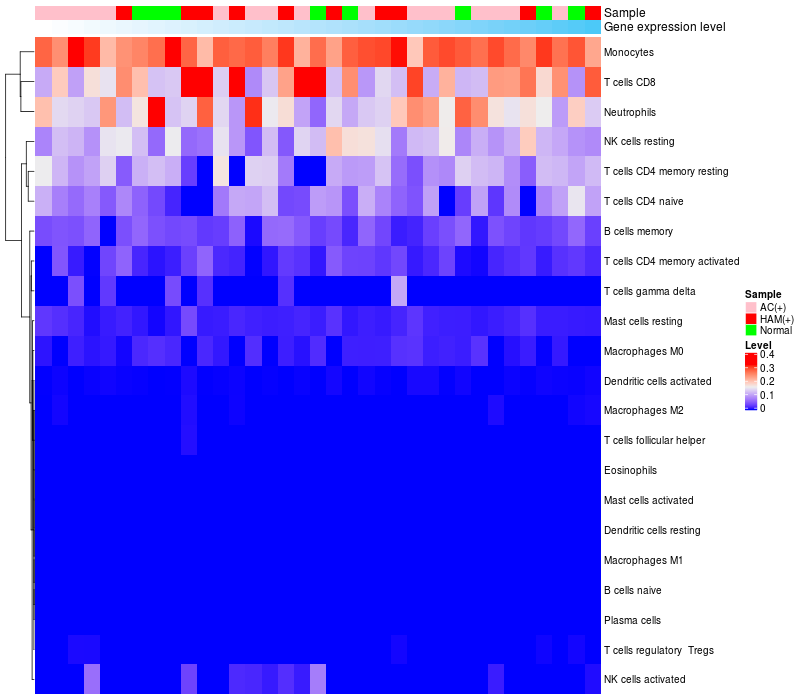
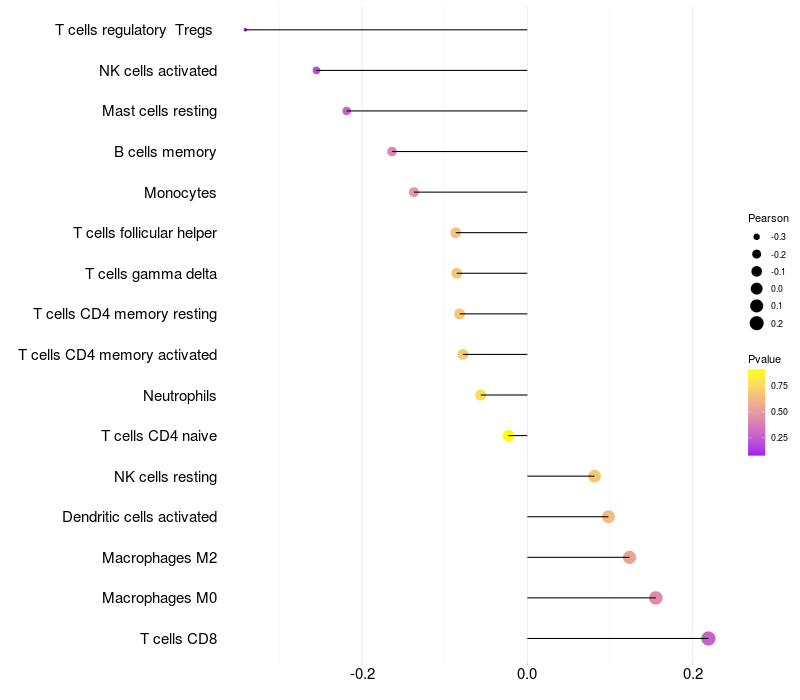
Target gene [SPTBN4] related to VISs
DVID Chromosome HM TFBS CA Sum of Overlapped Records Detail
6001071 chr19 16 414 173 603 View

Relationship between gene expression and immune infiltrating cell level
Data ID Disease Sample number Sample type
GSE55851 (GEO) Adult T-cell leukemia 21 Normal (3), Asymptomatic carriers (HTLV1+)(6), Adult T-cell Leukemia-lymphoma (HTLV1+)(12)
GSE29312 (GEO) HTLV-1 associated myelopathy 39 Normal (9), Asymptomatic carriers (HTLV1+)(20), HTLV-1-associated myelopathy (HTLV1+)(10)
GSE29332 (GEO) HTLV-1 associated myelopathy 35 Normal (8), Asymptomatic carriers (HTLV1+)(17), HTLV-1-associated myelopathy (HTLV1+)(10)

> Dataset: GSE55851

HeatMap of cell type fractions in all samples Lollipop of SPTBN4 expression and immune infiltrating cell level correlation result in HTLV1+ samples
SPTBN4 expression: Low -> High

> Dataset: GSE29312

HeatMap of cell type fractions in all samples Lollipop of SPTBN4 expression and immune infiltrating cell level correlation result in HTLV1+ samples
SPTBN4 expression: Low -> High

> Dataset: GSE29332

HeatMap of cell type fractions in all samples Lollipop of SPTBN4 expression and immune infiltrating cell level correlation result in HTLV1+ samples
SPTBN4 expression: Low -> High

Contents
Description

Gene Information Note

  • Integration Table: if previous studies reported that target gene was altered by virus integration events, the overlap between VISs in this literature and Cistrome factors was listed in the "Target gene [gene] related to VIS" section

Immune Analysis Plot Note

  • Left: Heatmap of target gene expression and the level of various types of immune cells (cell type fractions) in all samples based on CIBERSORT method.
  • Right: Correlation of target gene expression and the level of various types of immune cells in virus positive samples (Pearson Correlation Coefficient).