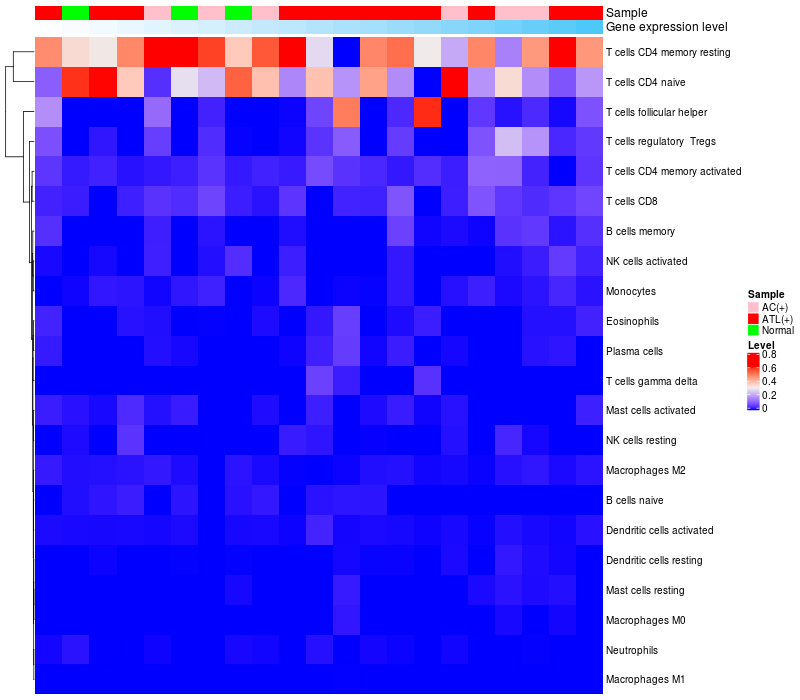
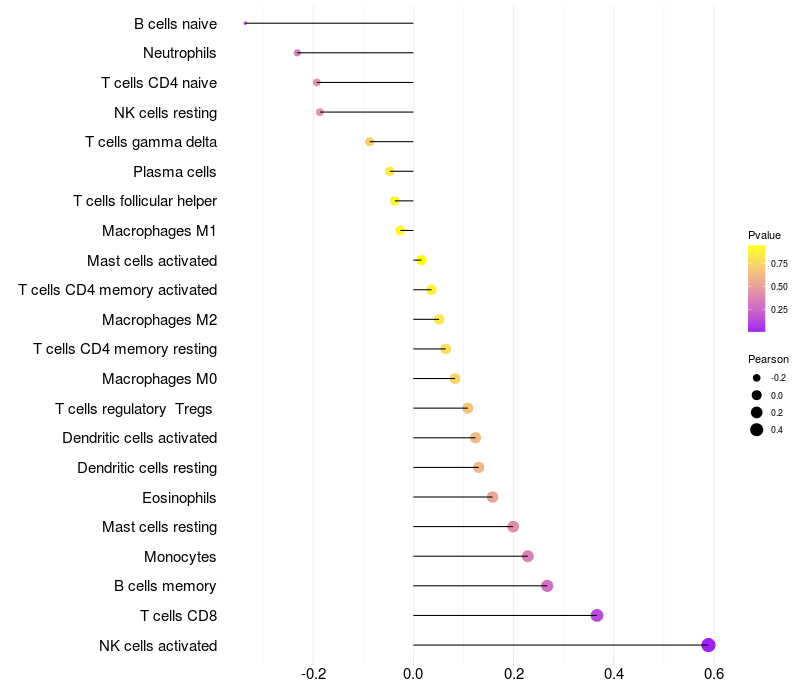
> Dataset: GSE55851
|
|
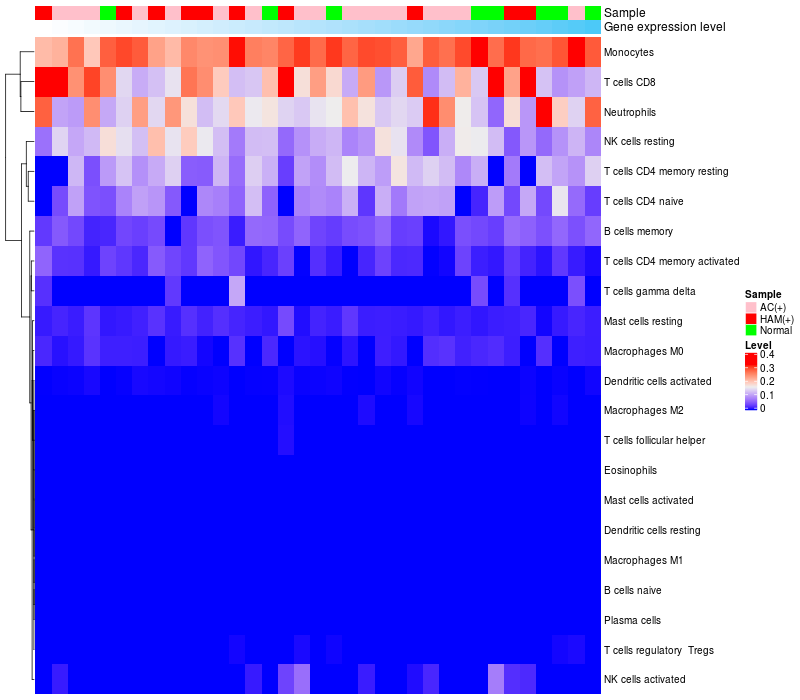
HeatMap of cell type fractions in all samples
|
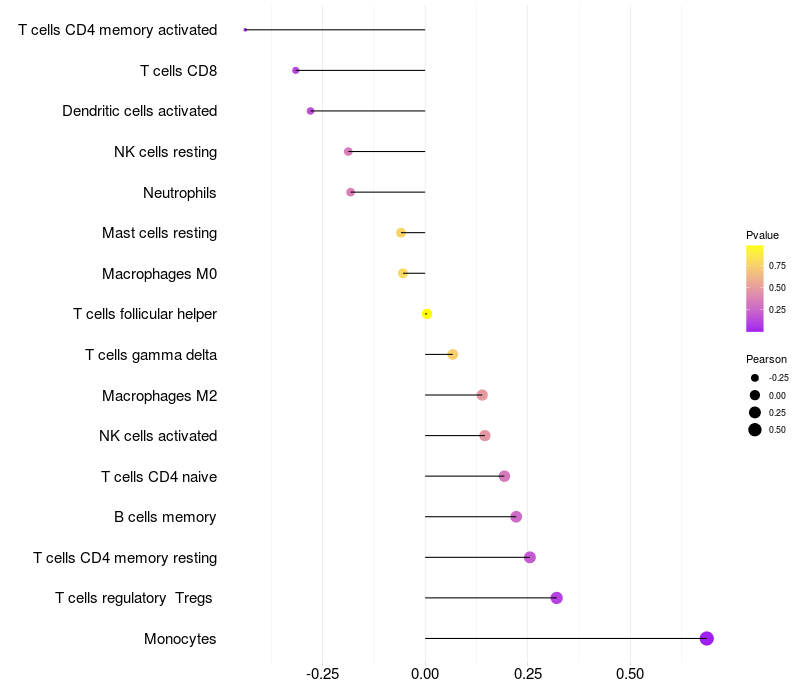
Lollipop of STAB1 expression and immune infiltrating cell level correlation result in HTLV1+ samples
|
STAB1 expression: Low -> High
|
|
|
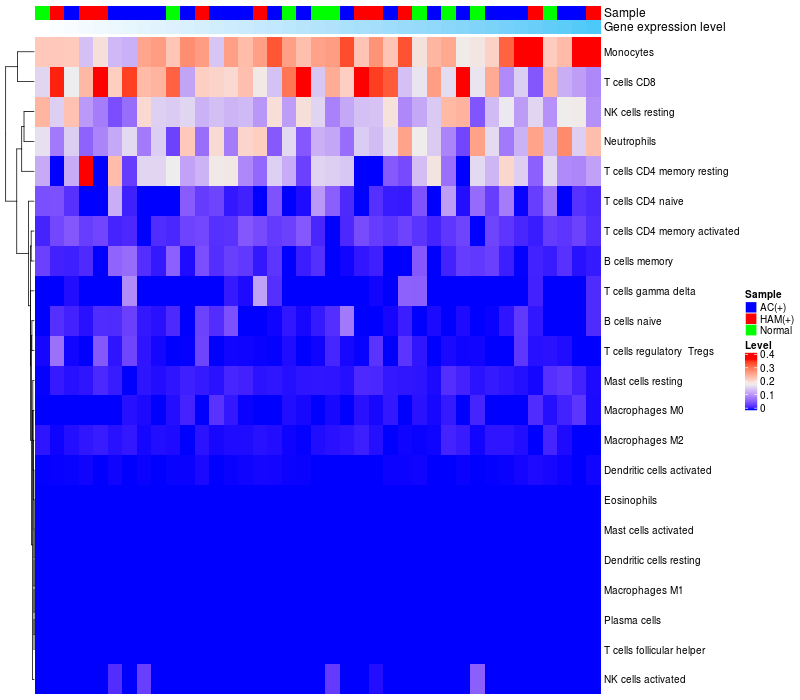
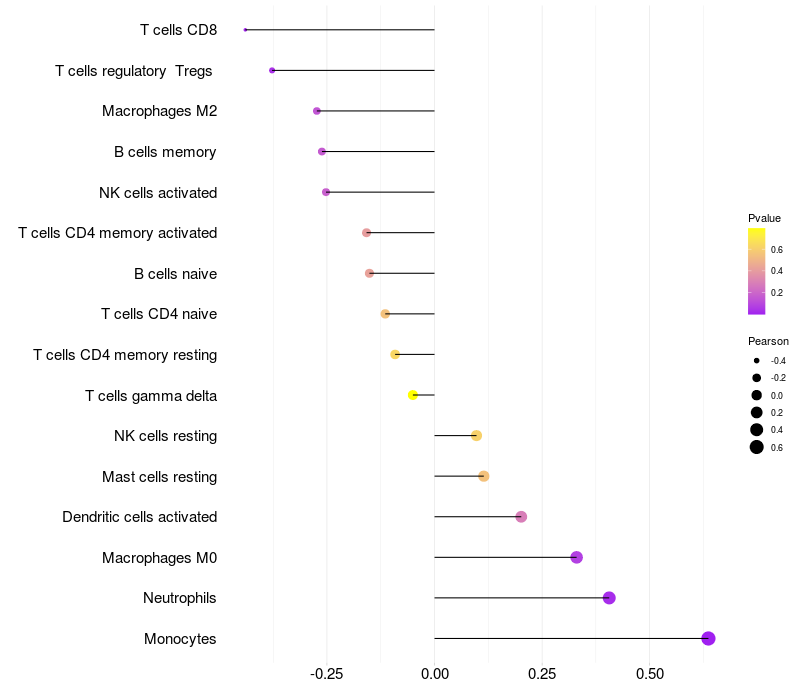
> Dataset: GSE29312
|
|
HeatMap of cell type fractions in all samples
|
Lollipop of STAB1 expression and immune infiltrating cell level correlation result in HTLV1+ samples
|
STAB1 expression: Low -> High
|
|
|
> Dataset: GSE29332
|
|
HeatMap of cell type fractions in all samples
|
Lollipop of STAB1 expression and immune infiltrating cell level correlation result in HTLV1+ samples
|
STAB1 expression: Low -> High
|
|
|
 HTLV1 Target gene Detail Information