
Overview
Welcome to ViMIC 2.0 (A Database of Human Disease-related Virus Mutations, Integration sites and Cis-effects)
The ViMIC 2.0 is a resource of human disease-related virus information. It mainly covers four key features, including virus mutation sites (VMs), viral integration sites (VISs), target genes and multi-omics data. The database allows users to quickly query the information regarding curated VMs, VIS-Cistrome intersections and statistics of virus sequences data. Additionally, users can query gene changes in virus-infected samples, influenced by viral integration events or virus gene/region/protein, with data derived from multi-omics levels.
Homepage
Virus Mutation
Virus Integration
Target Gene
Virus Overview
Virus Associated Disease
Virus Omics Dataset
Search
Download
Contact us
|
Comparison of the data included in ViMIC 2.0 and ViMIC 1.0
|
||||||||||||||||||||||||||||||||||||||||||||||||||||||||||||||||||||||||||||||||||||||||||||||||||||||||||||||
|
|
|
||||||||||||||||||||||||||||||||||||||||||||||||||||||||||||||||||||||||||||||||||||||||||||||||||||||||||||
Help Video
We recommend using google chrome to watch this video.
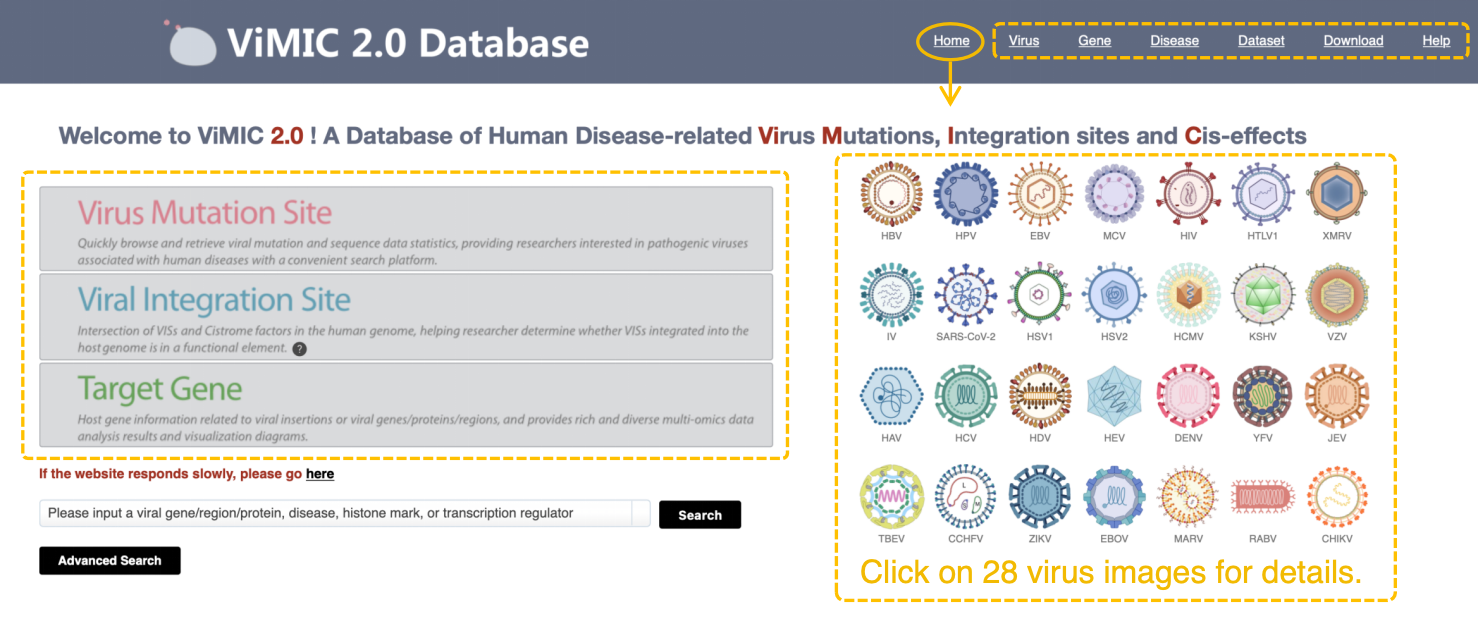
Homepage
The homepage of ViMIC 2.0 mainly gives a navigation of our database, including listing the modules of ViMIC 2.0 on menu bar and upper right panel, to help users to browse, search, visualize and download data. Main modules on upper left consist of Virus Mutation Site, Viral Integration Site and Target Gene. Other modules consist of Virus (virus information overview), Gene (target gene summary and analysis), Disease (virus infected disease information), Dataset (virus related omics dataset), Download (ViMIC 2.0 data download) and Help (ViMIC 2.0 data statistic and help document).
Virus Mutation
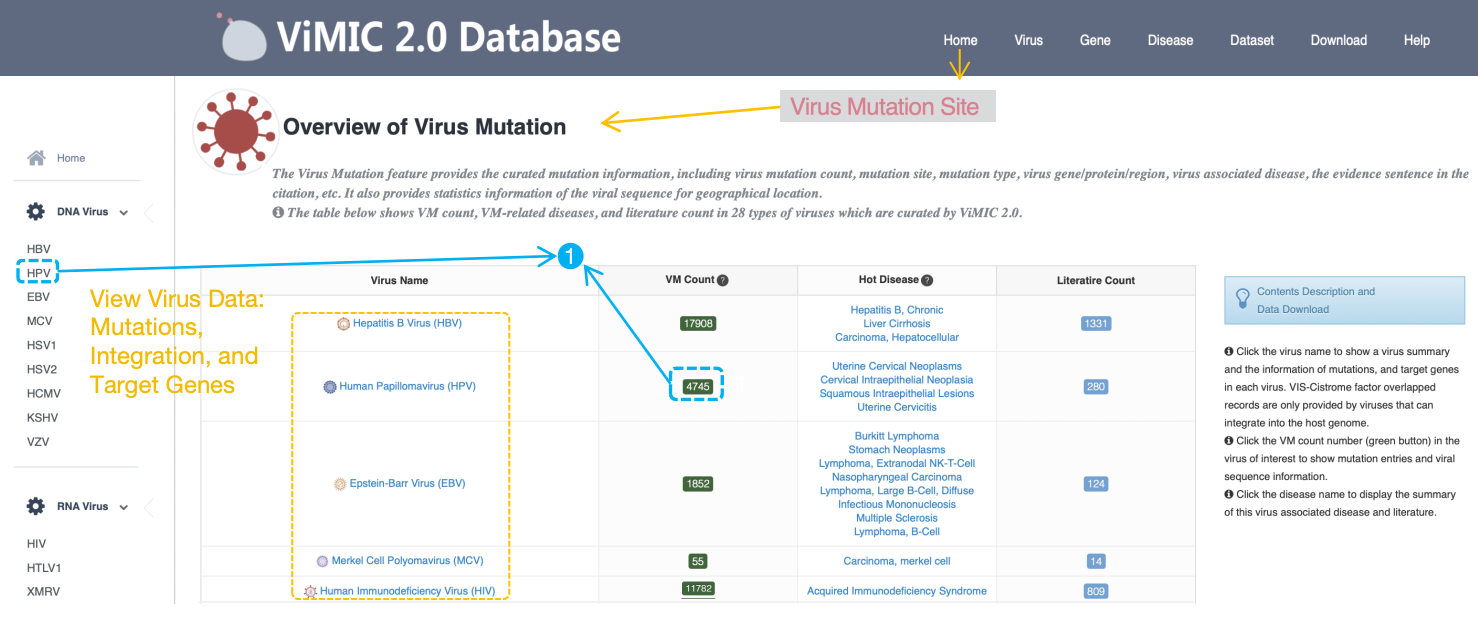
Overview of Mutation
The 'Overview of Mutation' page provides the curated mutation information for each virus. The table shows 'VM Count', virus associated 'Hot Disease' and 'Literature Count' in each virus which are curated by ViMIC 2.0. Click ‘Virus Name’ to show the information of mutations, VIS-Cistrome factor overlapped records (only for integrated virus) and target genes of selected virus. Click 'Hot Disease' to display the summary of literature related to selected virus associated disease. Click 'VM Count' to show the detailed mutation information of selected virus.
Virus Navigation and Mutation Statistics
Virus Mutation Site
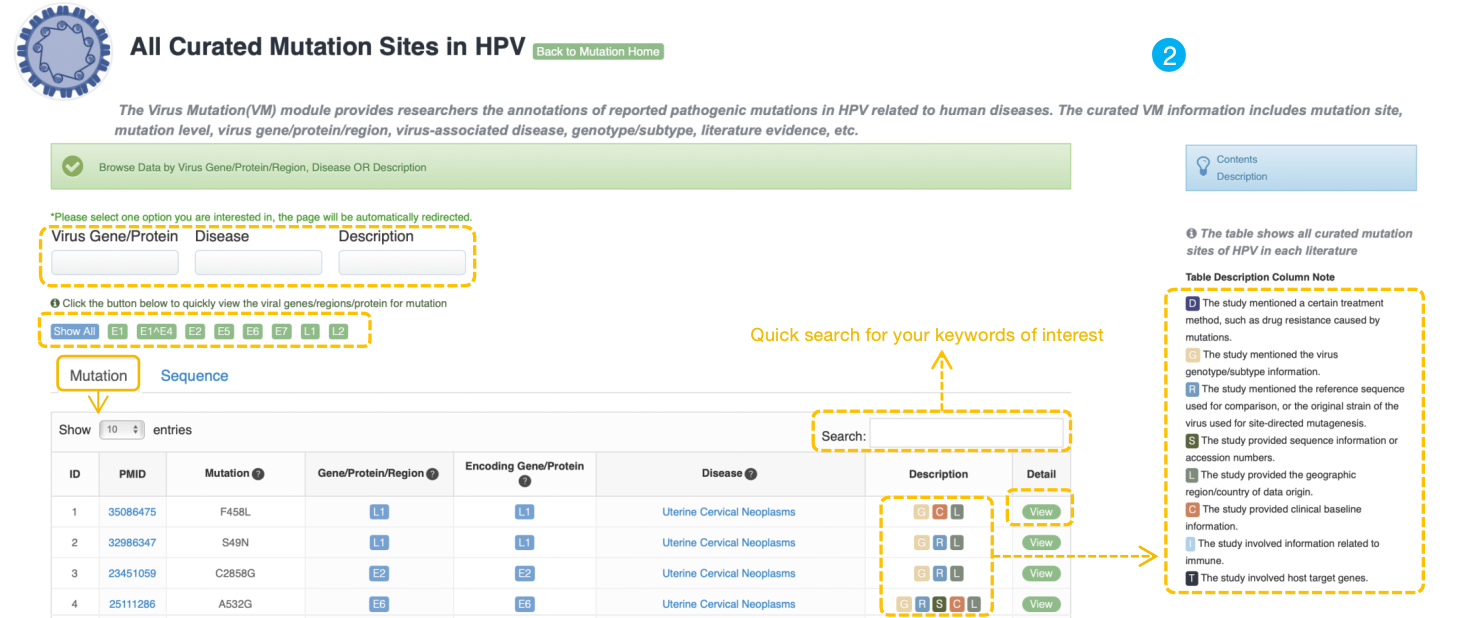
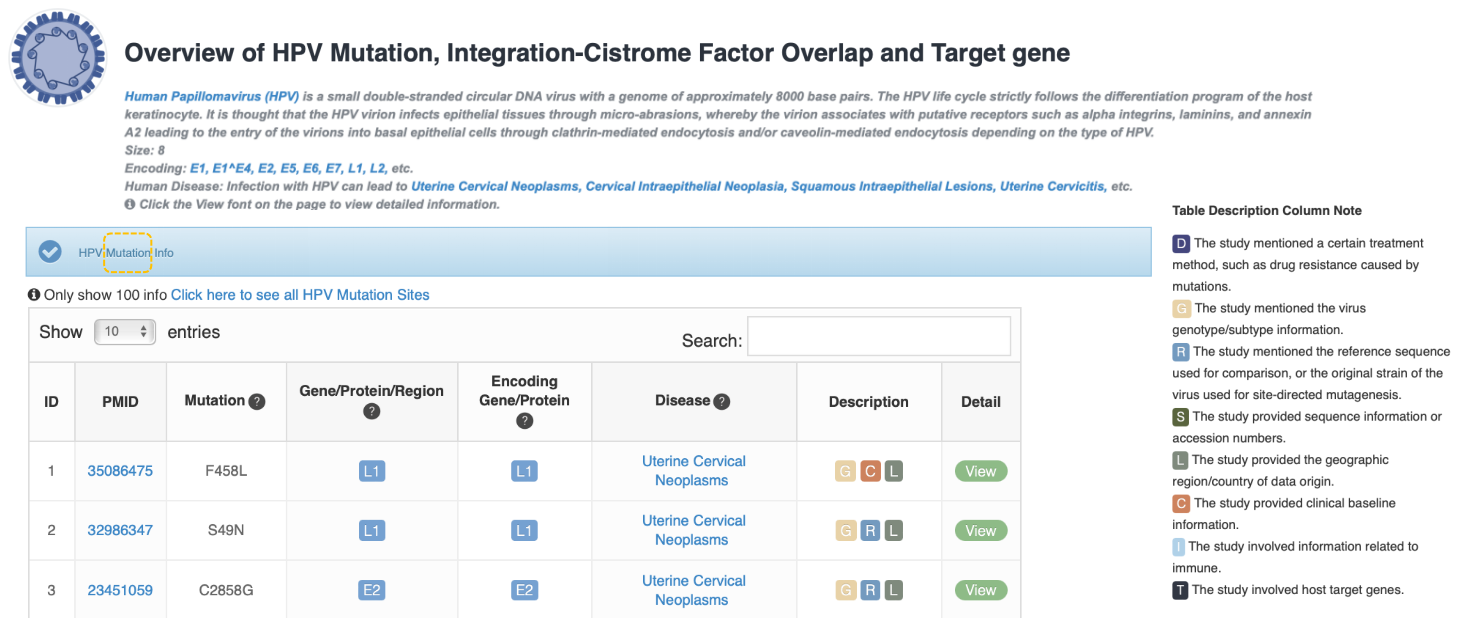
The VM annotation module provides researchers who are interested in VMs with annotations of reported pathogenic mutations in virus related to human diseases easily. The curated mutation information includes mutation site, mutation level, virus gene/protein/region, virus-associated disease, genotype/subtype, literature evidence, etc. Three drop-down menu items above the table for users to choose different virus gene/protein, disease and description browsing options respectively. Users can also Click the button to quickly view the hot viral genes/regions/protein for mutation. The table below shows curated mutation sites of selected virus.
We designed a description column to indicate more detailed information for each mutation site using the following tags:
D: The study mentioned certain treatment method, such as drug-resistant caused by mutations.
G: The study mentioned the genotype information.
R: The study mentioned the reference sequence for comparison, or the original strain of the virus used for site-directed mutagenesis.
S: The study provided sequence information or accession numbers.
L: The study provided the geographic region/country of data origin.
C: The study provided clinical baseline information.
I: The study involved information related to immune.
T: The study involved host target genes.
When selecting the virus gene of interest, users can quickly search the keyword of interest in the search box on the top-right of the table. Click the "View" button to show the detail information of this mutation.
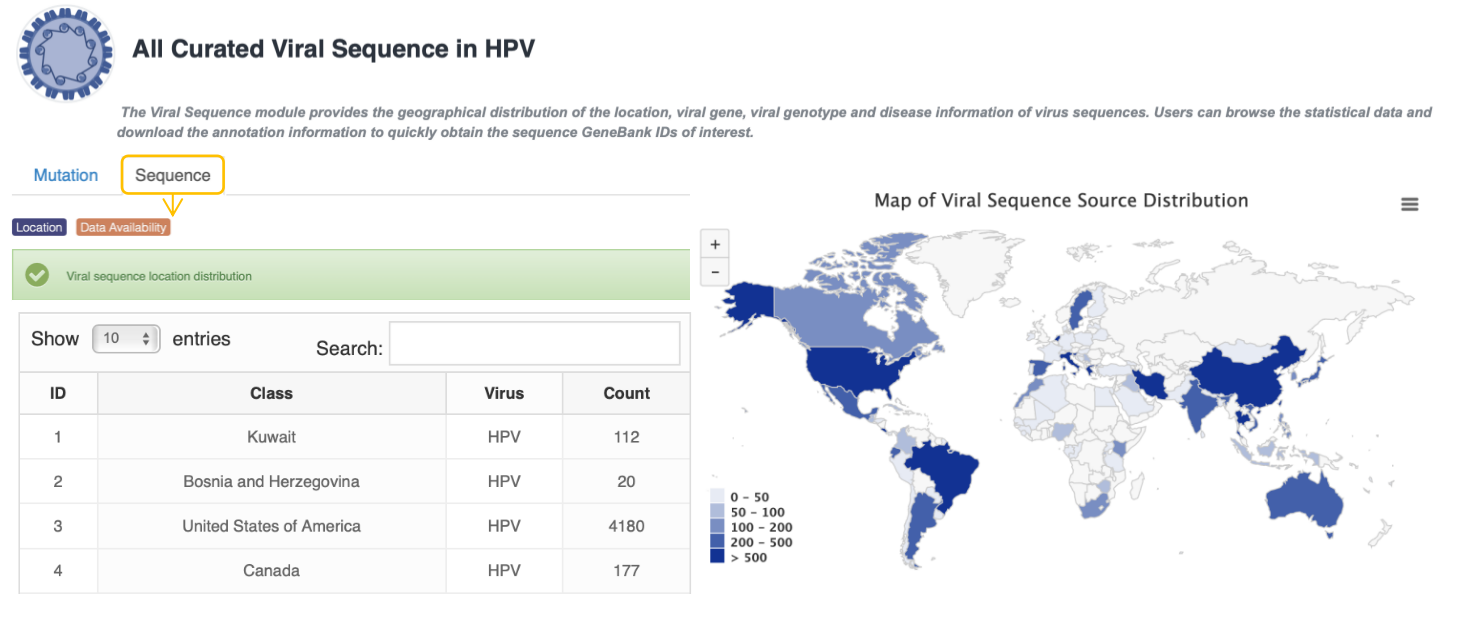
Statistics of Virus Sequences Data
The Viral Sequence module provides the geographical distribution of the source, viral gene, region and genotype of virus sequences. Users can browse the statistical data o for geographical distribution and download the annotation information to quickly obtain the sequence GeneBank IDs of interest.
Viral Integration
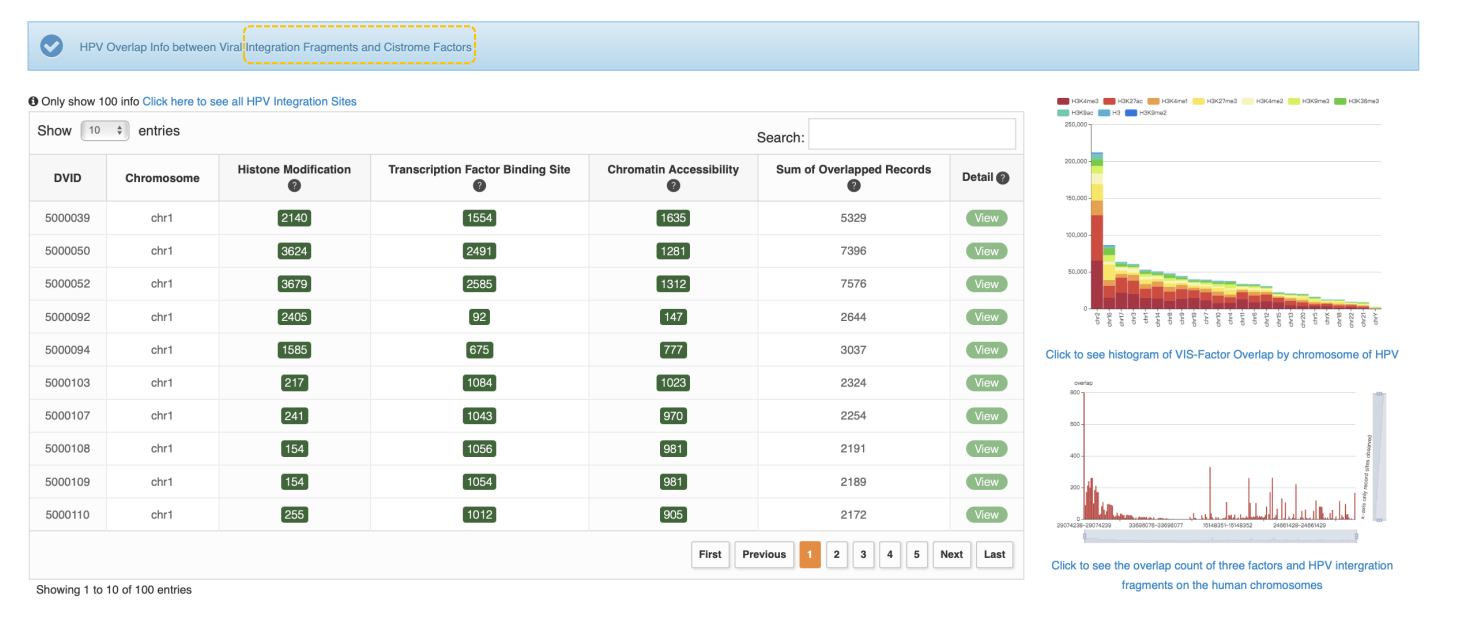
Overview of Virus Integration Site (VIS)-Cistrome Factor Feature
This feature provides information of the overlapped records between VIS and Cistrome factors as well as Cistrome factor-related samples, the associated factor and overlap amount could indicate that the virus integration site is a potentially functional DNA element. The cistrome refers to "the set of cis-acting targets of a trans-acting factor on a genome-wide scale." The table below provide virus navigation and VIS-cistrome data statistics which summaries about VIS we collected as well as VIS-Cistrome factor overlapped records in each virus. Click virus name to view virus overview of virus mutation, integration and target gene. Click VIS count number (green button) to view VIS-Cistrome factor data. Click Disease Information to display the summary of this disease and disease related literature. The user can click “Search VIS-Cistrome Overlap” to access advanced search options for finding overlapping records by combining various keywords or choose "Explore VIS batch (list)" to search VIS batch.

Search VIS-Cistrome Overlap
Advanced search option for sophisticated overlapped records searches by combining various keywords (e.g. virus name, chromosome, location, disease, Cistrome biological source or Cistrome type). Specifically, the user can combine keywords of related disease and biological resource to filter out overlapped records of interest.
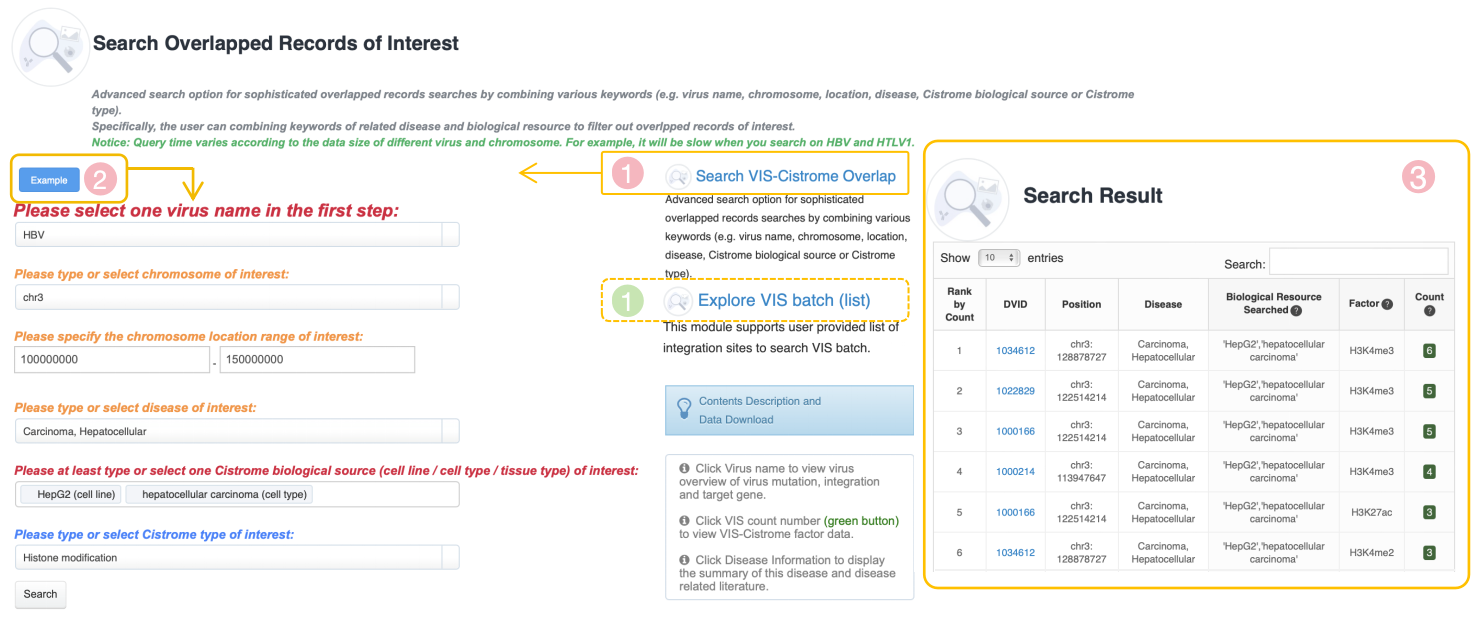
Explore VIS batch (list)
This module supports user provided list of integration sites to search VIS batch.

VIS-Cistrome Factor Overlap in each human chromosome
• Overall Heatmap
Here, take HBV as an example. This heatmap is an overall statistic for HBV VIS-Cistrome factor overlapped records by chromosome. An overlapped record means a match between VIS and 1 of 3 Cistrome factors (histone modification, transcription factor binding site and chromatin accessibility), more specifically, this match includes at least 1 overlap between this VIS and 1 Cistrome factor-related sample from 1 of 3 Cistrome factor data. The darker the red, the greater the overlapped records number. The user can view specific number by moving mouse pointer.

• Browse Data by Chromosome or Factor
The user can browse HBV VIS-Cistrome factor overlapped records data by specific chromosome or statistics histogram for specific Cistrome factor when click the chromosome or Cistrome factor the user is interested in.
• VIS locations with VIS-cistrome overlap information and VIS details for each chromosome
This table shows VIS locations with VIS-Cistrome overlap information for each chromosome. When selecting the chromosome of interest, users can browse VIS information which indicates the numbers of VIS and three Cistrome factors’ overlapped records. Click ‘View’ button to show the detailed information of selected VIS.

By clicking “Show VIS with two points” button, ViMIC2.0 will return VIS-Cistrome table of VIS with two points. Columns with “(S)” are overlaps calculated by single start s ite and columns with “(B)” are overlaps calculated by both two sites. Column “Case/Length” shows the case classification of VISs with two sites based on the original literature and length between two sites.
1. Case 1: The deletion of human fragments during the integration event.
2. Case 2: Due to the experimental method/design, two viral insertion positions were provided in the literature.

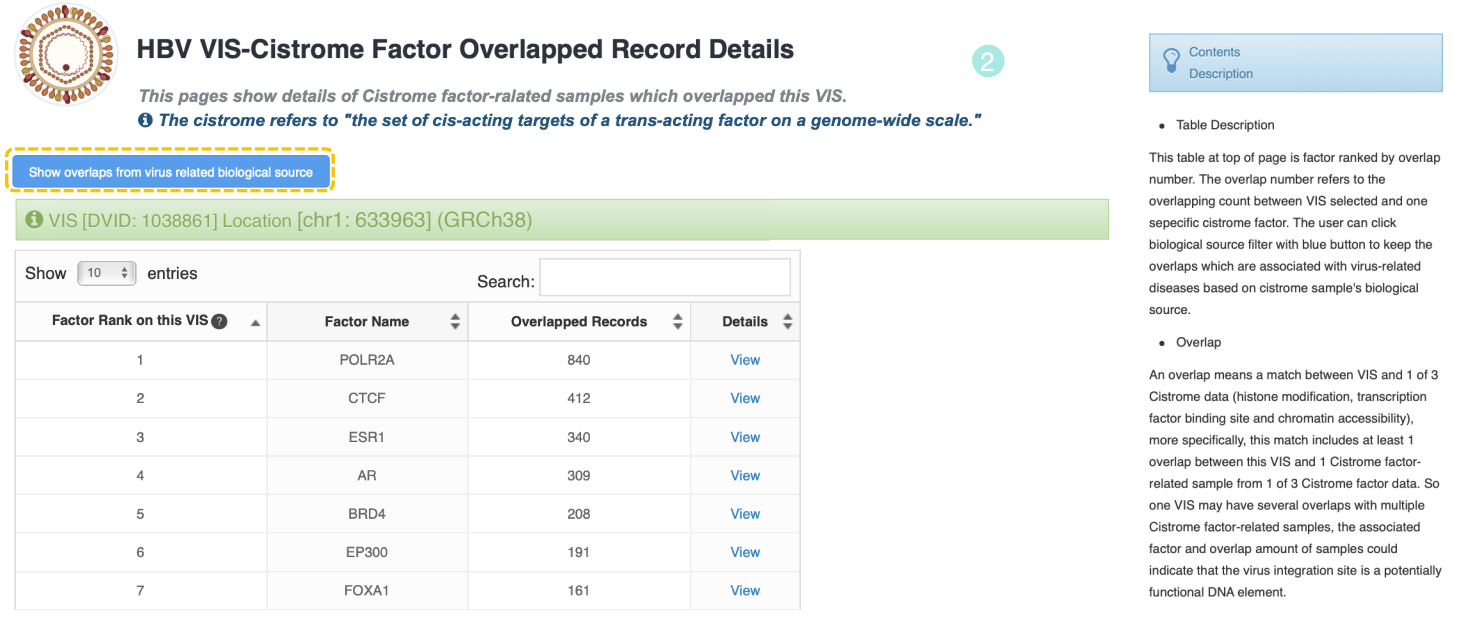
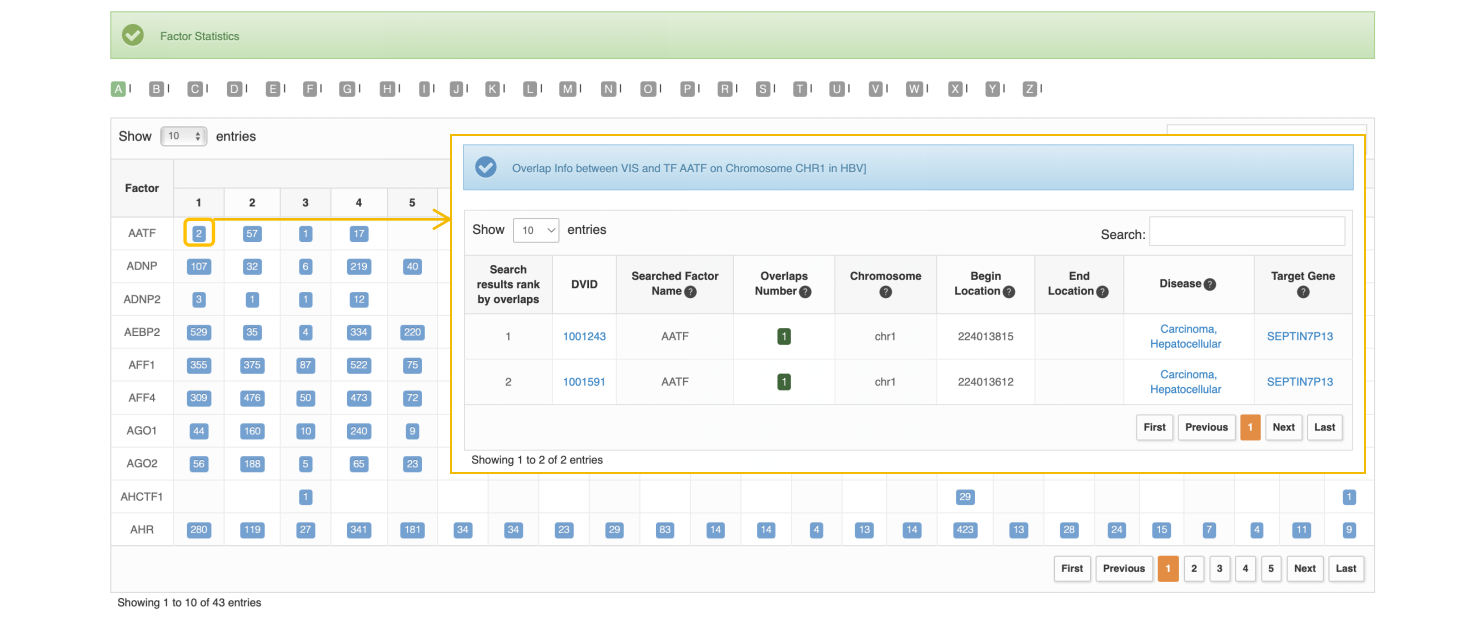
VIS-Cistrome Factor Overlapped Record Details
This table at top of page is factor ranked by overlap number. The overlap number refers to the overlapping count between VIS selected and one specific Cistrome factor. The user can click biological source filter with blue button to keep the overlaps which are associated with virus-related diseases based on Cistrome sample's biological source.
An ‘Overlapped Records’ means a match between VIS and 1 of 3 Cistrome factor (histone modification, transcription factor binding site and chromatin accessibility), more specifically, this match includes at least 1 overlap between this VIS and 1 Cistrome factor-related sample from 1 of 3 Cistrome factor data. So, one VIS may have several overlaps with multiple Cistrome factor-related samples, the associated factor and overlap number of samples could indicate that the virus integration site is a potentially functional DNA element. The interface details are as follows:
We take the entry of “1000606” on chromosome 5 in HBV as an example. After users click the “chr5” and search the entry of “1000606” in HBV VIS-Cistrome Factor Overlap in each human chromosome page, ViMIC shows the overlaps result of three cistrome factors. The user can click green button to view VIS-Cistrome Factor Overlapped Record Details related to selected VIS, in addition, the user can inspect some other VIS detail information such as disease and literature by clicking "View" button at Detail column. By clicking the green button with number at “TF” (Transcription factor binding site) column, ViMIC shows the ranking of all transcriptional regulators that have overlaps with this VIS. In this case exploration, users can view cistrome samples by clicking the ‘View’ button of the transcription factor MYC, and then users can view the detail information of samples (GSMID, cell line, cell type, tissue type and factor name). Additionally, sample ID and factor name are crosslinked to the related resources, including GEO and ENCODE databases.

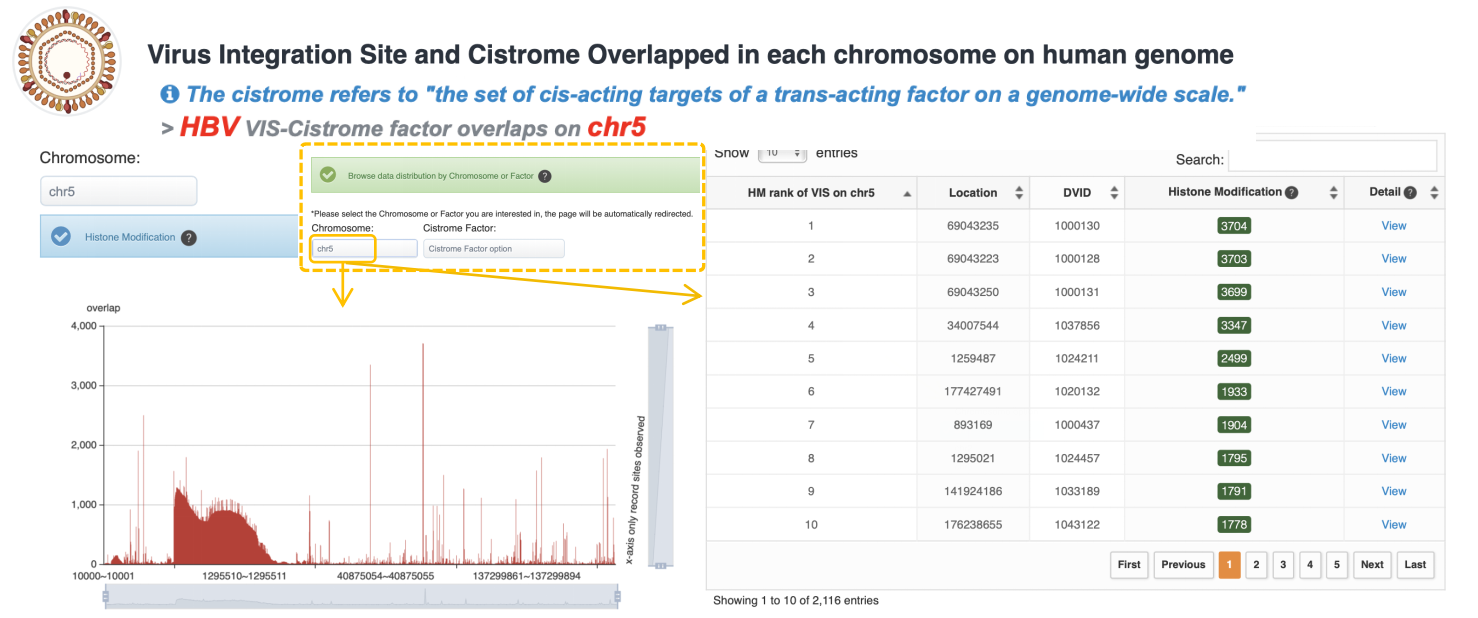
Virus Integration Site and Cistrome Overlapped in each chromosome on human genome
The histogram shows the overlap count of three factors (histone modification, transcription factor binding site, and chromatin accessibility) and virus integration fragments on the human chromosomes. The y-axis represents the number of overlaps, and the X-axis represents the integrated fragments. The table shows the Cistrome factor count rank of VIS on the chromosome user selected. The user can click green button to view details and view VIS detail information by clicking "View" button at Detail column.
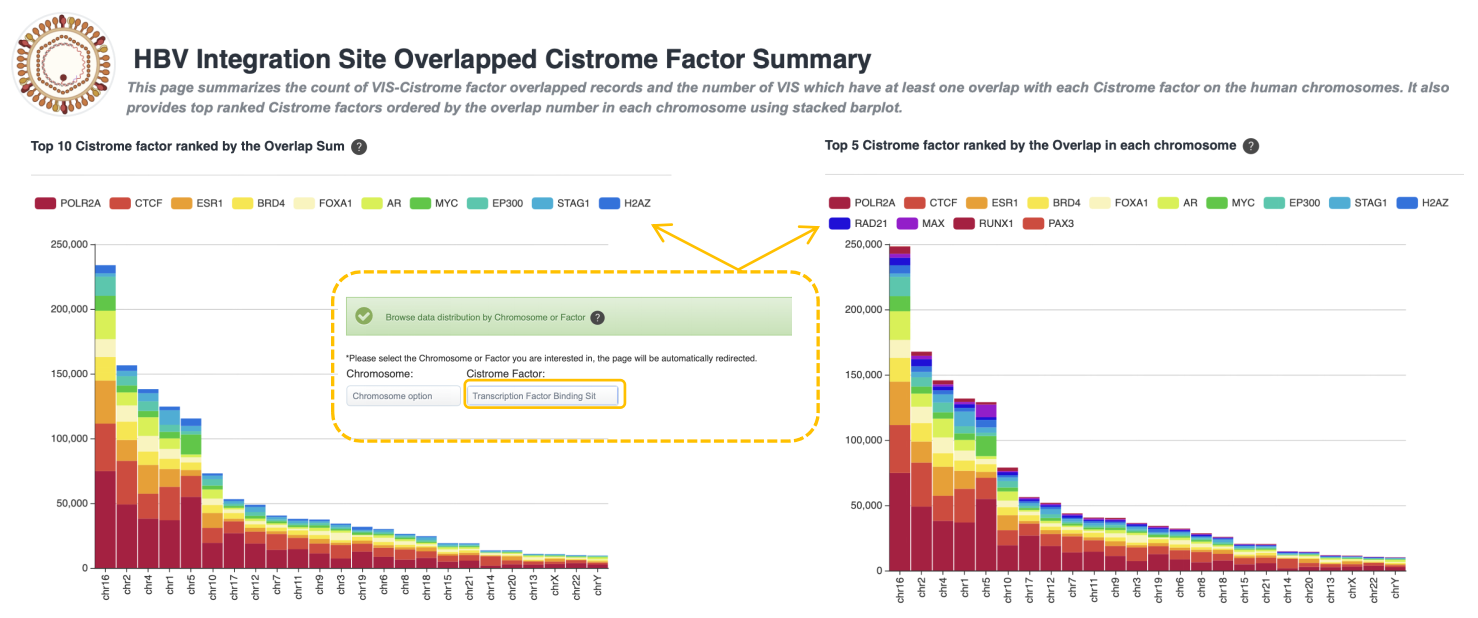
Integration Site Overlapped Cistrome Factor Summary
This page summarizes the count of VIS-Cistrome factor overlapped records and the number of VIS which have at least one overlap with each Cistrome factor on the human chromosomes. It also provides top ranked Cistrome factors ordered by the overlap number in each chromosome using stacked barplot.
• Top 10 Cistrome factor ranked by the Overlap Sum
Histogram of factors by chromosome. The statistic factors are top 10 amount factors on all HBV VIS-Cistrome factor overlapped records data. Strategy: Firstly, rank the overlapped records by Cistrome factor, then only visualize the top 10 Cistrome factor statistics to histogram by Chromosome.
• Top 5 Cistrome factor ranked by the Overlap in each chromosome
Histogram of factors by chromosome. The statistic factors on are the sum of the top 5 amount factors on each Chromosome. Strategy: Firstly, rank the overlapped records by Cistrome factor for each Chromosome, then only visualize the sum of top 5 Cistrome factor statistics of each Chromosome to histogram by Chromosome.
• Factor Statistics
The table summarizes the number of VIS which have at least one overlap with each Cistrome factor on the human chromosomes.
Return to Top
Target Gene
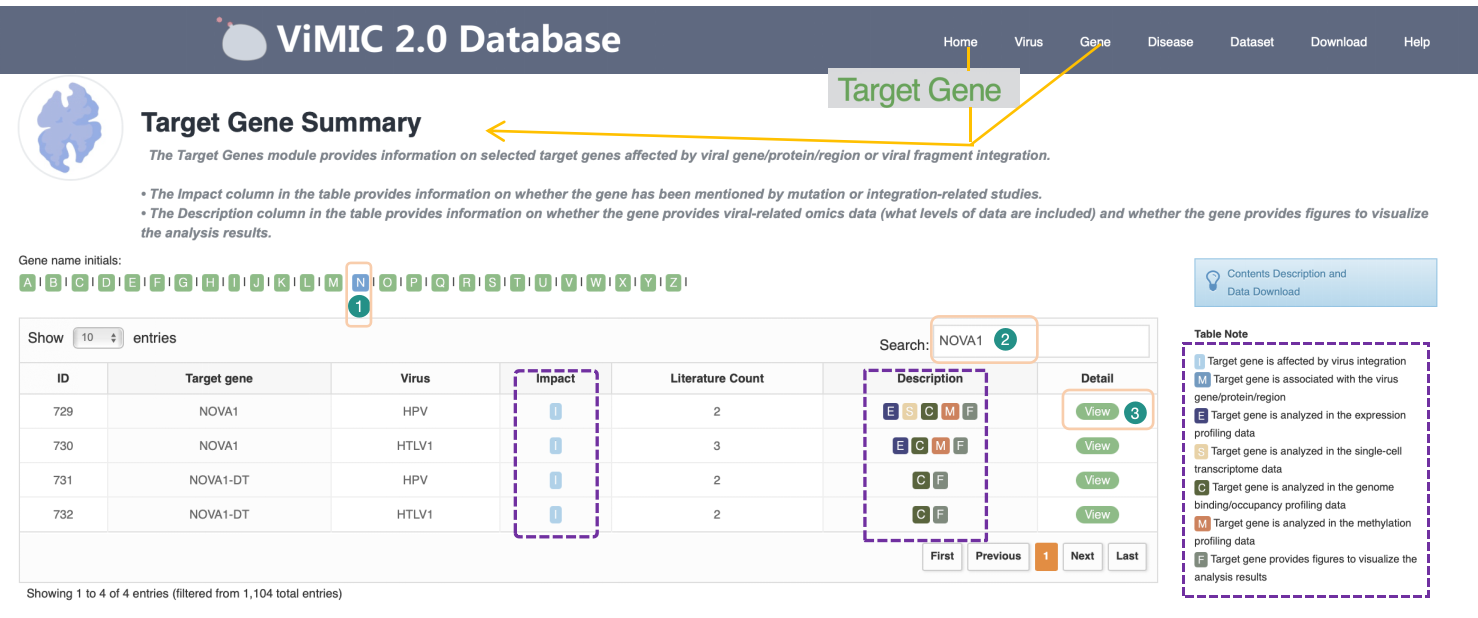
Overview of Virus Target Gene
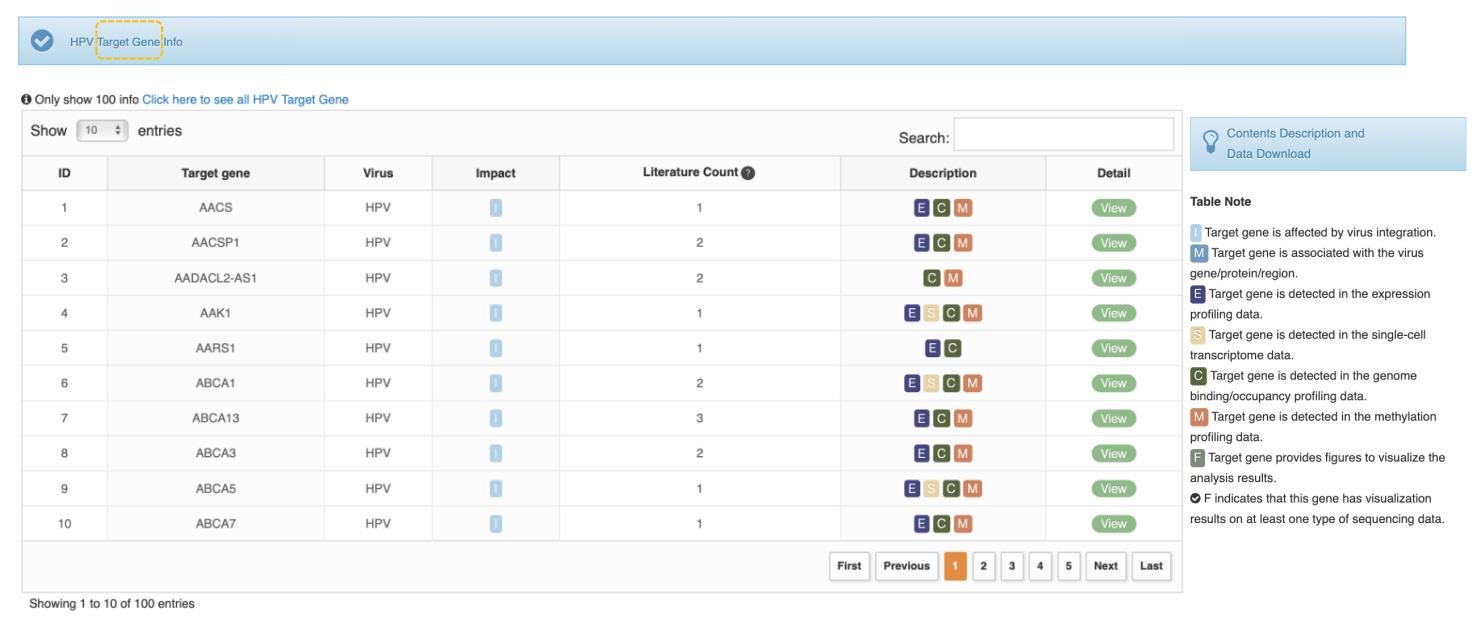
The Target Gene feature provides information for the target gene affected by viral insertion or virus gene/protein regulation. The Impact column in the table provides information on whether the gene has been mentioned in studies related to mutation or integration. The Description column in the table provides information on whether the gene provides virus-related omics data (which level of data is included) and whether a visualization graph is provided. A description of each tag is as follows:
I: Target gene is affected by virus integration.
M: Target gene is associated with the virus gene/protein/region.
E: Target gene is detected in the expression profiling data.
S: Target gene is detected in the single-cell transcriptome data.
C: Target gene is detected in the genome binding/occupancy profiling data.
M: Target gene is detected in the methylation profiling data.
F: Target gene provides figures to visualize the analysis results. F indicates that this gene has visualization results on at least one type of sequencing data.
Using the NOVA1 gene from HPV research as an example, we've segmented the data by initial letter to speed up access. Click the letter "N" to search for NOVA1 in the upper right corner of the table. Click the "View" button for the corresponding virus to view detailed information.
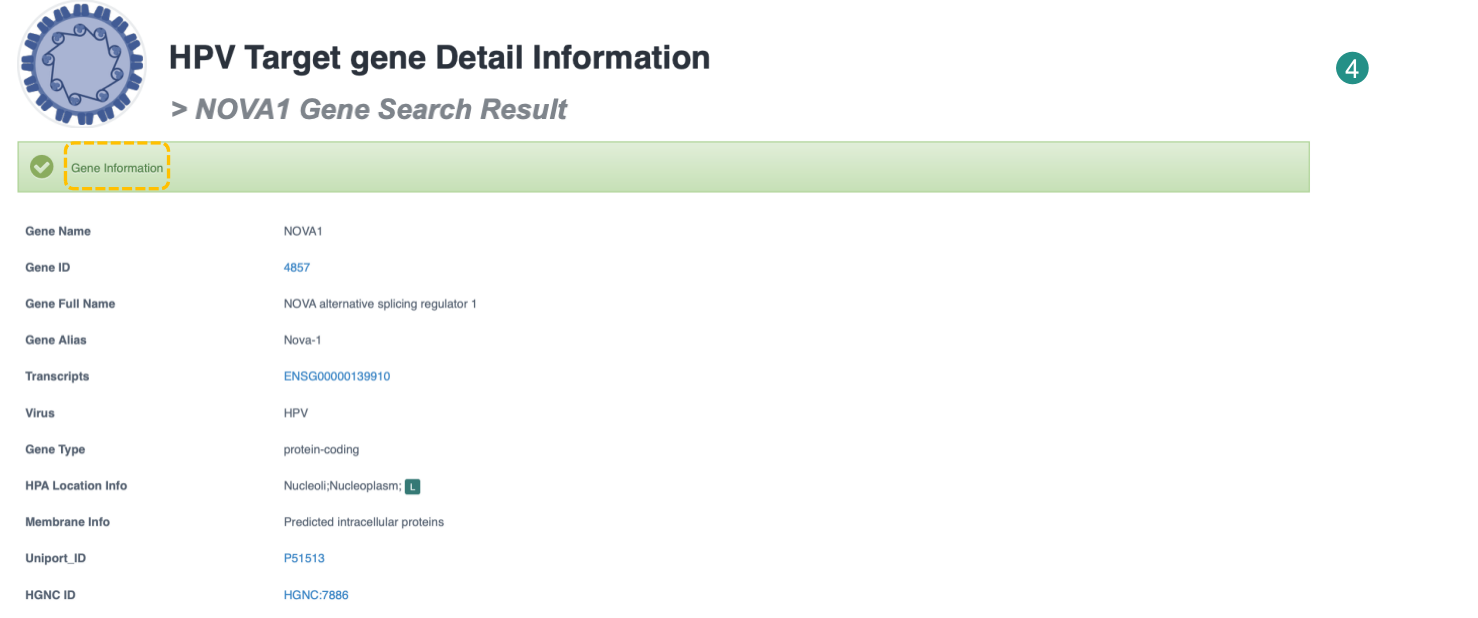
Target gene Detail Information
Gene information mainly shows gene name, gene id, gene type, resources' ID, etc, three tables (the mutation table, integration table and gene expression dataset table) and omics analysis plot. If previous studies reported that the target gene was altered by viral integration events or viral gene/region/protein, the table lists the overlap between VIS and Cistrome factors in the literature. The following is an integration example. The omics table provides basic information on the relevant viral omics data for the gene. ViMIC2.0 provides target gene analysis for 4 types of sequencing data.
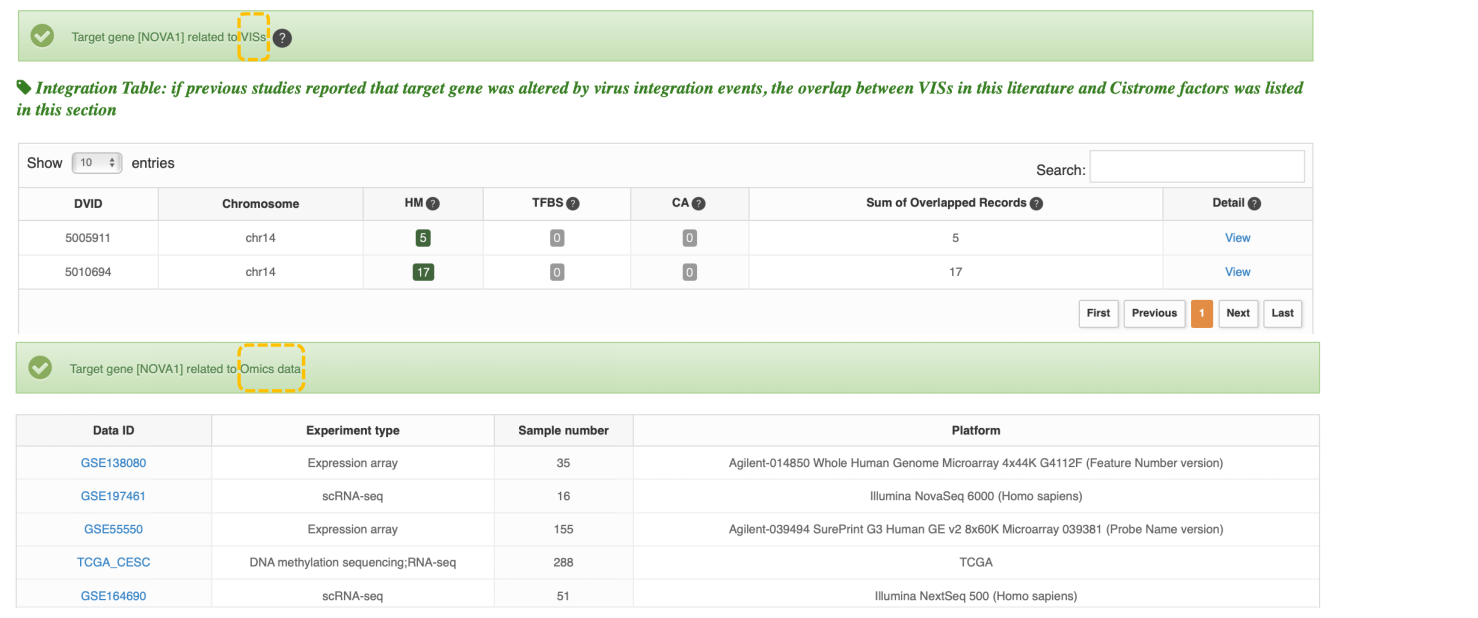
1. If the gene is a differentially expressed gene, a volcano plot and a bar plot are displayed below.
2. If the gene is differentially expressed in a cluster of single-cell transcriptome data, the sample and cell annotation UMAP and gene feature plot are displayed below.
3. If the gene contains differentially methylated sites, a volcano plot and a bar plot are displayed below.
4. If a peak is detected in the virus-related Genome binding/occupancy profiling data for this gene region, the peak graph is shown below.
Return to Top
Virus Overview
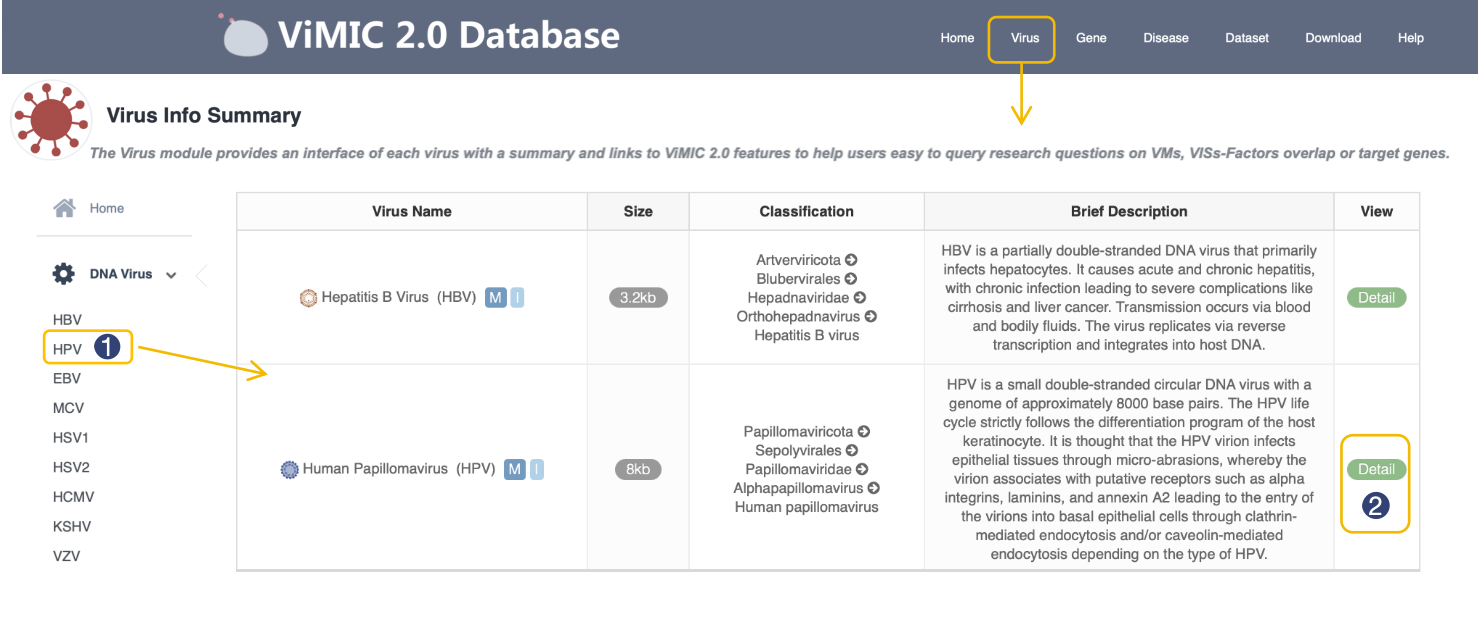
Virus Info Summary
The Virus module provides an interface of each virus with a summary and links to ViMIC2.0 features to help users easy to query research questions on VMs, VISs-Factors overlap (only for integrated viruses) or target genes, the table below shows basic information of 28 viruses in ViMIC2.0, including Virus Name, Size, Classification and Brief Description, click the View button in table to see the overview of three modules.
Overview of Virus Mutation, Integration-Cistrome Factor Overlap and Target gene
This page gives an overview of Virus Mutation, Integration-Cistrome Factor Overlap and Target gene.
Return to Top
Virus Associated Disease
Virus Infected Disease Summary
The Disease module provides the curated information in each type of virus-related disease, including mutation and integration. Mutation Count means the total PMID number of virus mutation in virus associated diseases. Integration Count means the total PMID number of virus integration in virus associated diseases.

Overview of Disease
The table shows literature information of this disease.
Two related tags:
• Mutation Tag: literature about this virus mutation and click the eye icon to see detail mutation information in literature.
• Integration Tag: literature associated this virus integration and click the eye icon to see detail information of 3 cistrome factors (histone modification, transcription factor binding site and chromatin accessibility).


Return to Top
Virus Dataset
Virus Dataset Summary
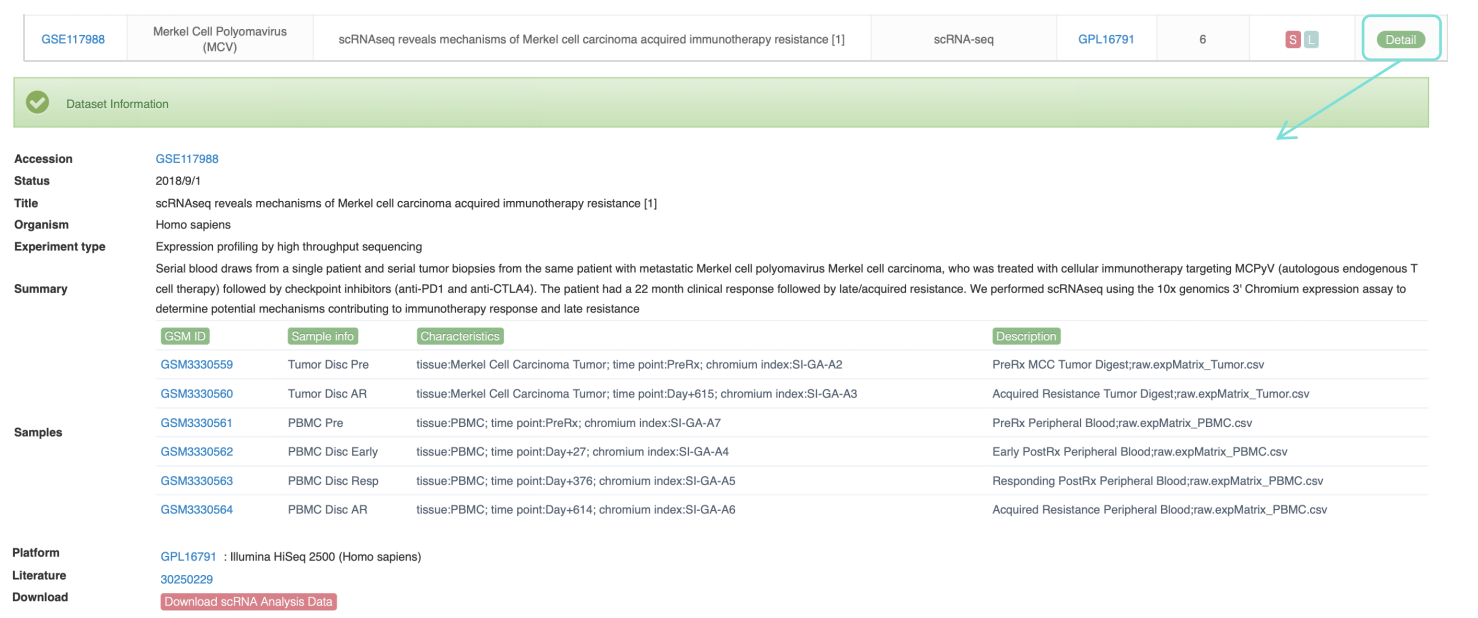
This module is dedicated to providing researchers with comprehensive and detailed virus-related omics data from the public databases. The current version brings together Transcriptome, Epigenome and Genome data. The experiment types include: Expression profiling by high throughput sequencing/array, Methylation profiling by high throughput sequencing/array/genome tiling array, Genome binding/occupancy profiling by genome tiling array, Genome variation profiling by high throughput sequencing, etc.
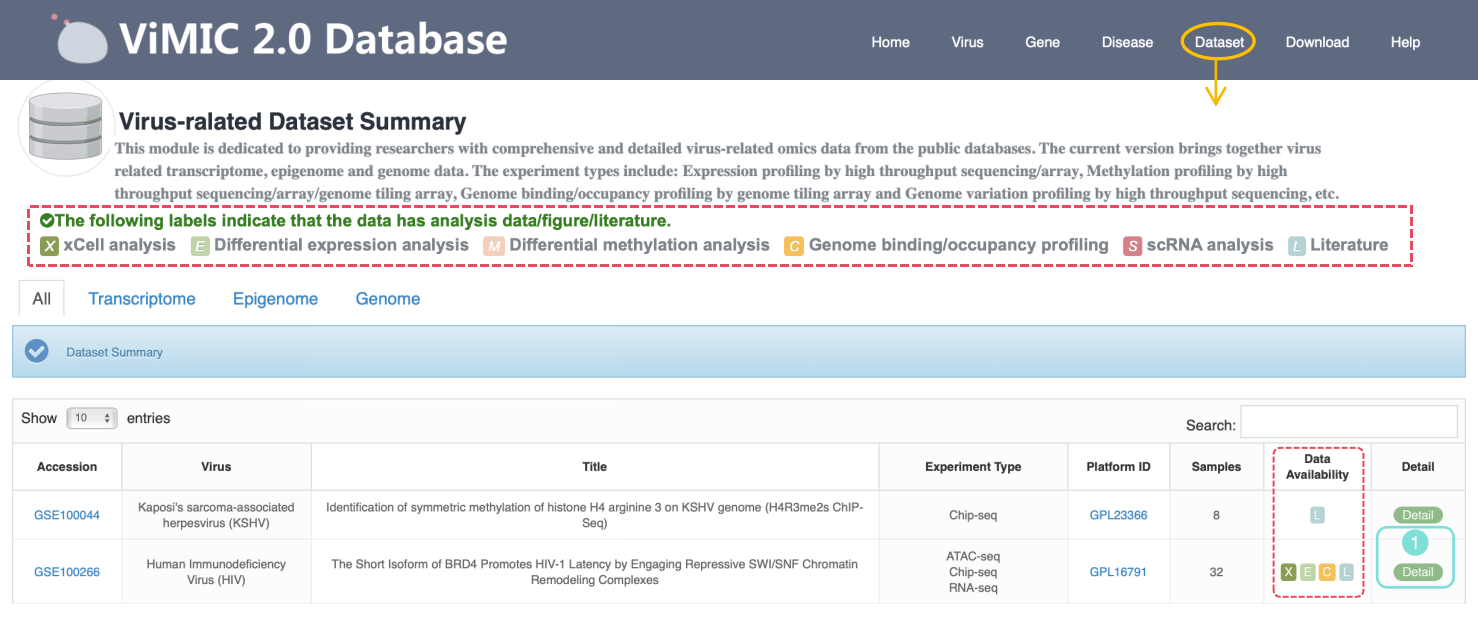
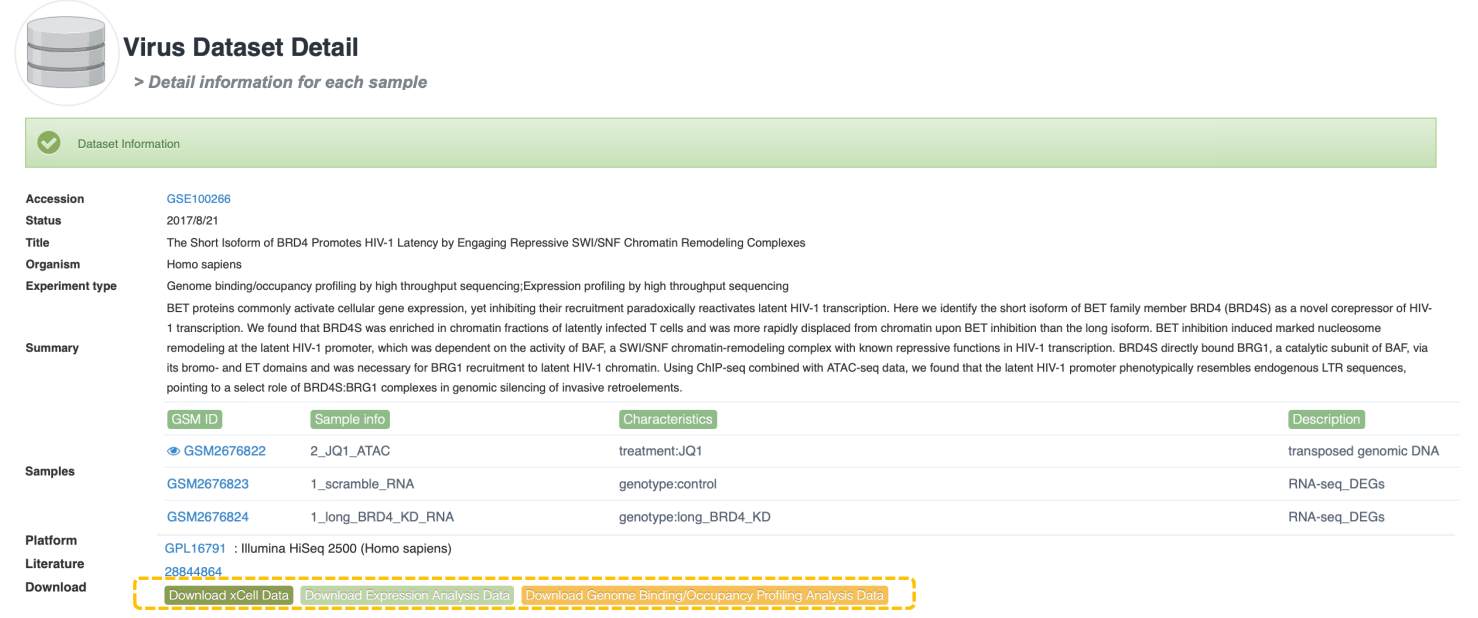
Data Availability column indicates that the data provided by this dataset can be analyzed. In ViMIC 2.0, only basic information of the dataset is displayed for data that cannot be processed or analyzed. We also designed corresponding classification labels: X represents xCell analysis, E represents Differential expression analysis, M represents Differential methylation analysis, C represents Genome binding/occupancy profiling analysis, S represents scRNA analysis, and L represents Literature. Click the Detail button to the detailed information page of the dataset, which provides basic information about the dataset, including the experimental design of each sample. Click the corresponding Download button to download the data results of the corresponding omics analysis.
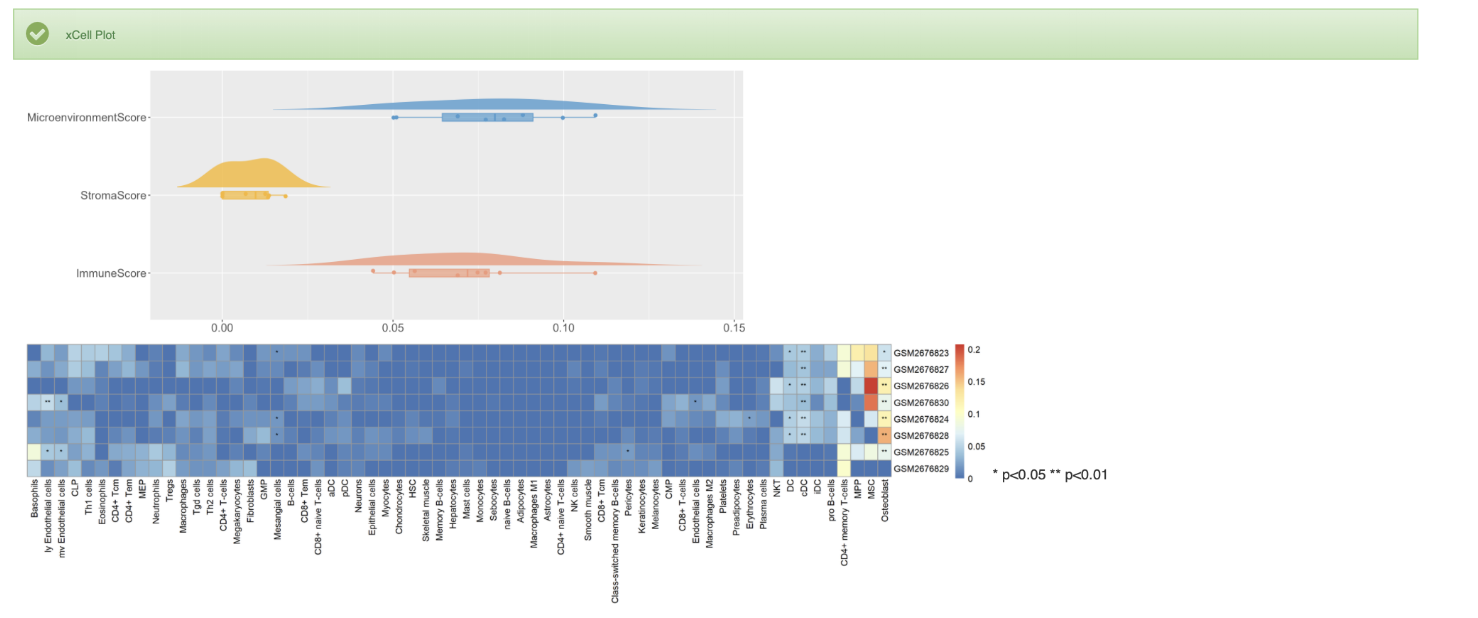
1. For bulk RNA-seq, ViMIC2.0 provides xCell's immune cell infiltration analysis results, heatmap, and microenvironment score cloud-rain map.
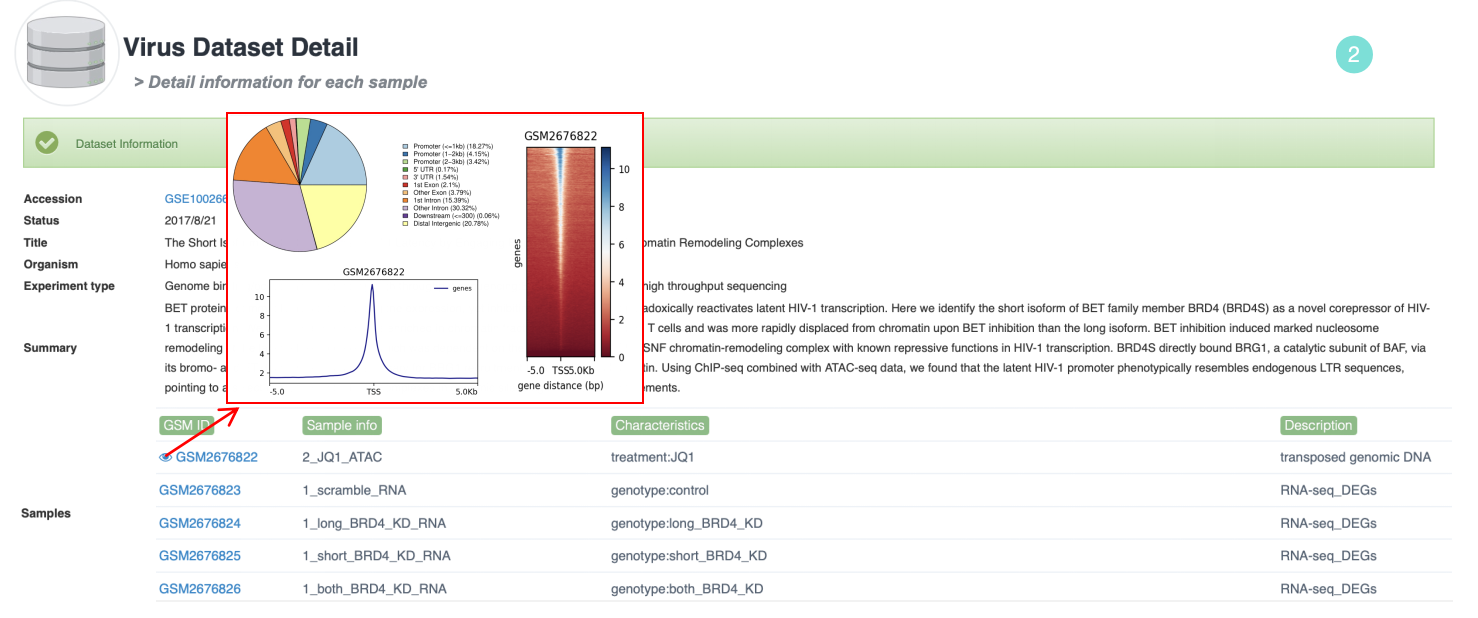
2. For Chip-seq or ATAC-seq data, ViMIC2.0 provides chipseeker annotation pie chart, deeptools analysis heatmap and profile maps for each GSM sample.
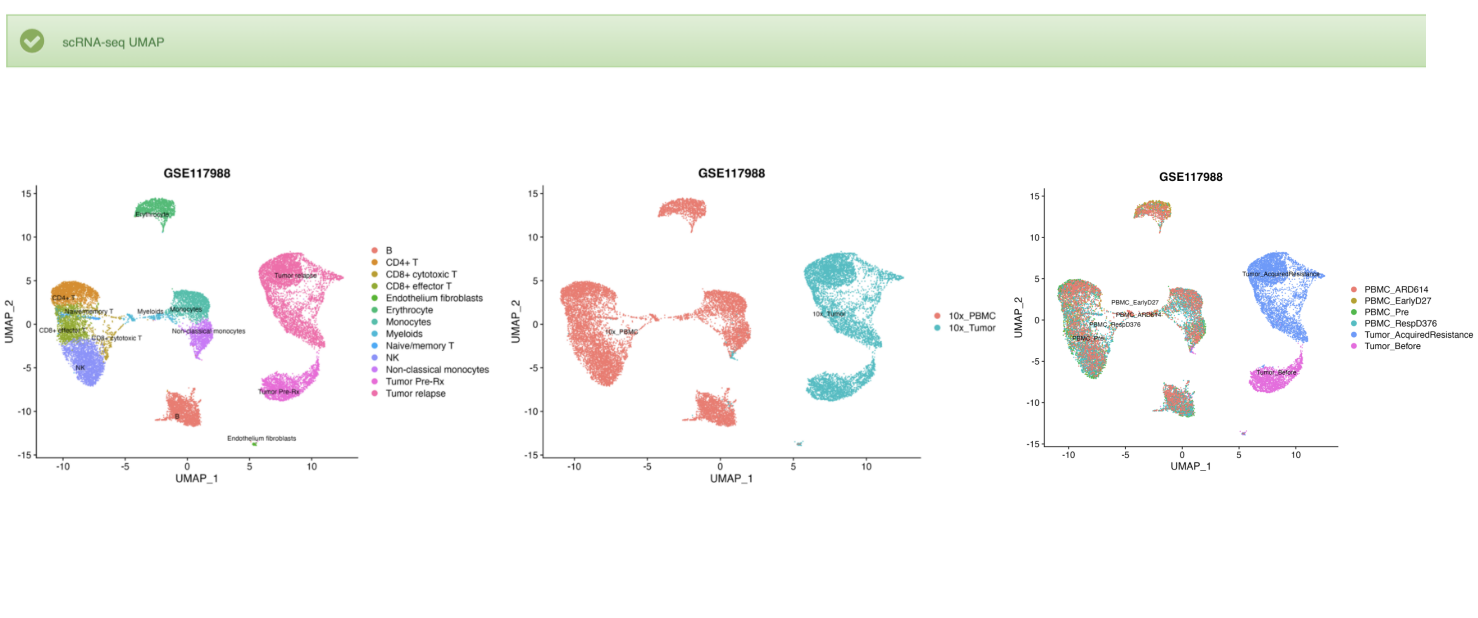
3. For scRNA-seq data, ViMIC2.0 provides UMAP of samples and cell types.
Search
Quick Search
Input the virus related disease, histone mark, transcription regulator or gene/protein/region directly in the search box at homepage, popping out a window about results of searched words.
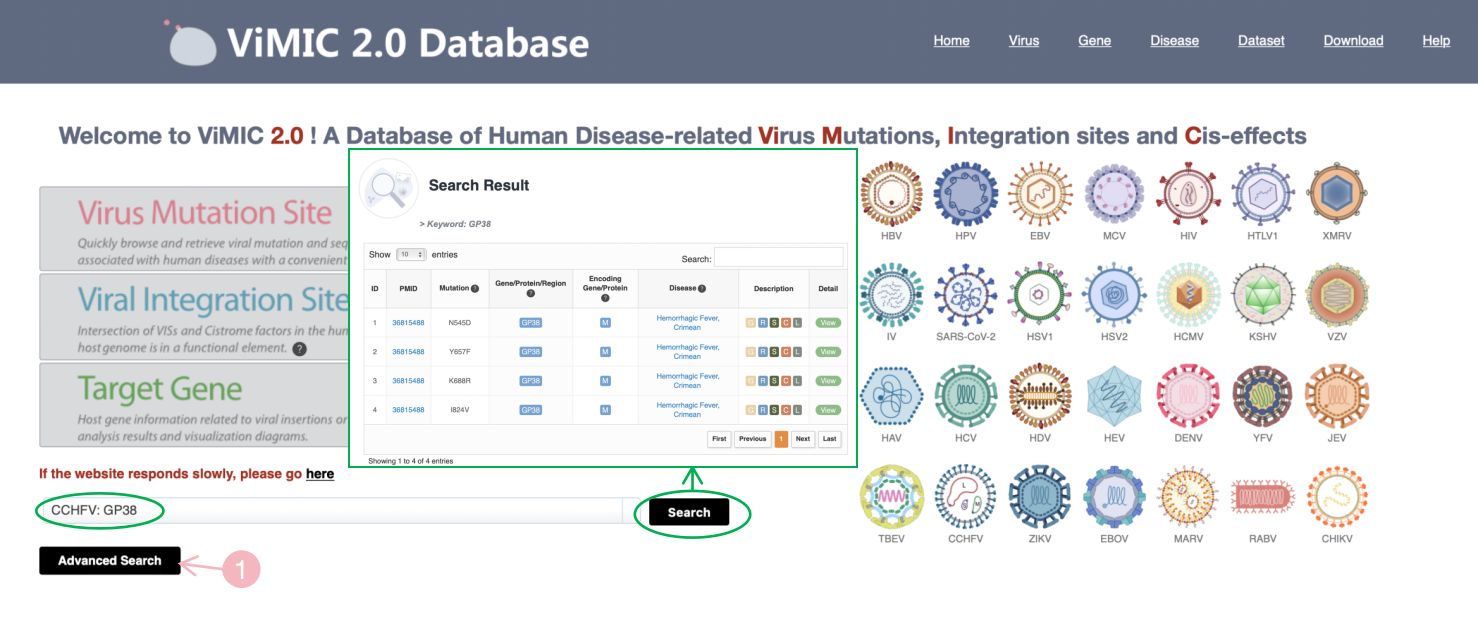
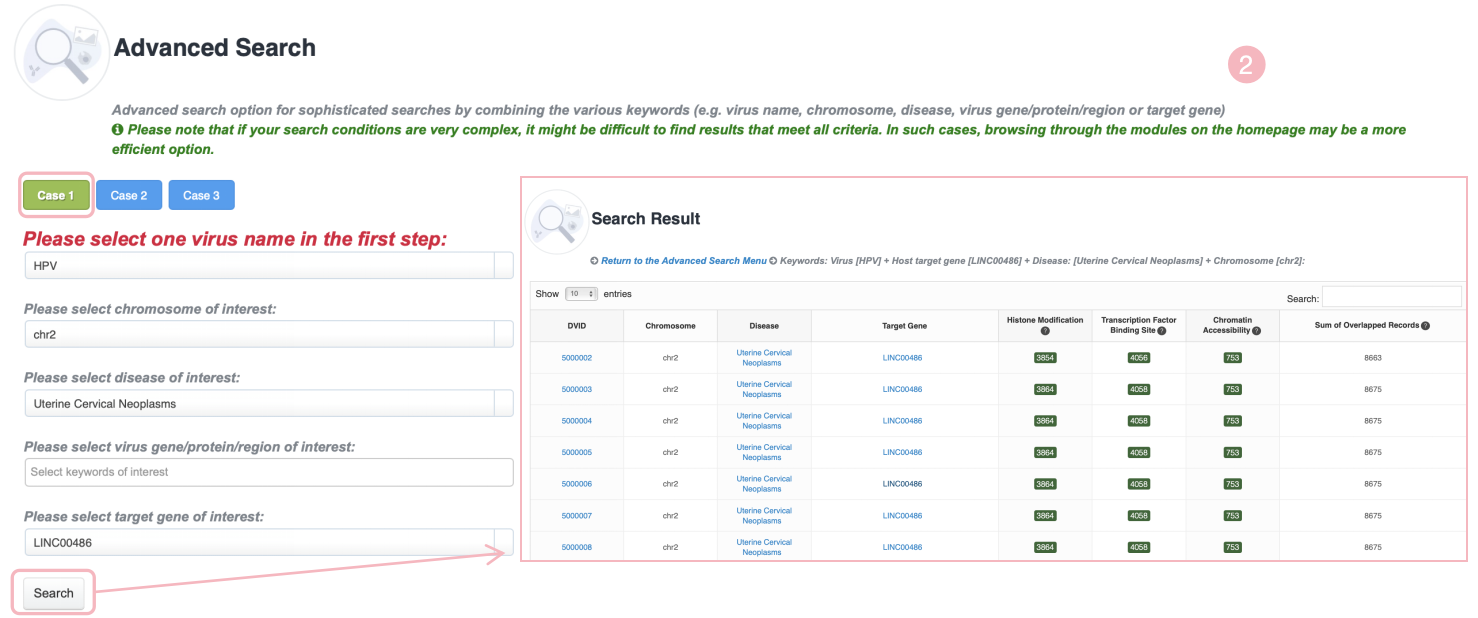
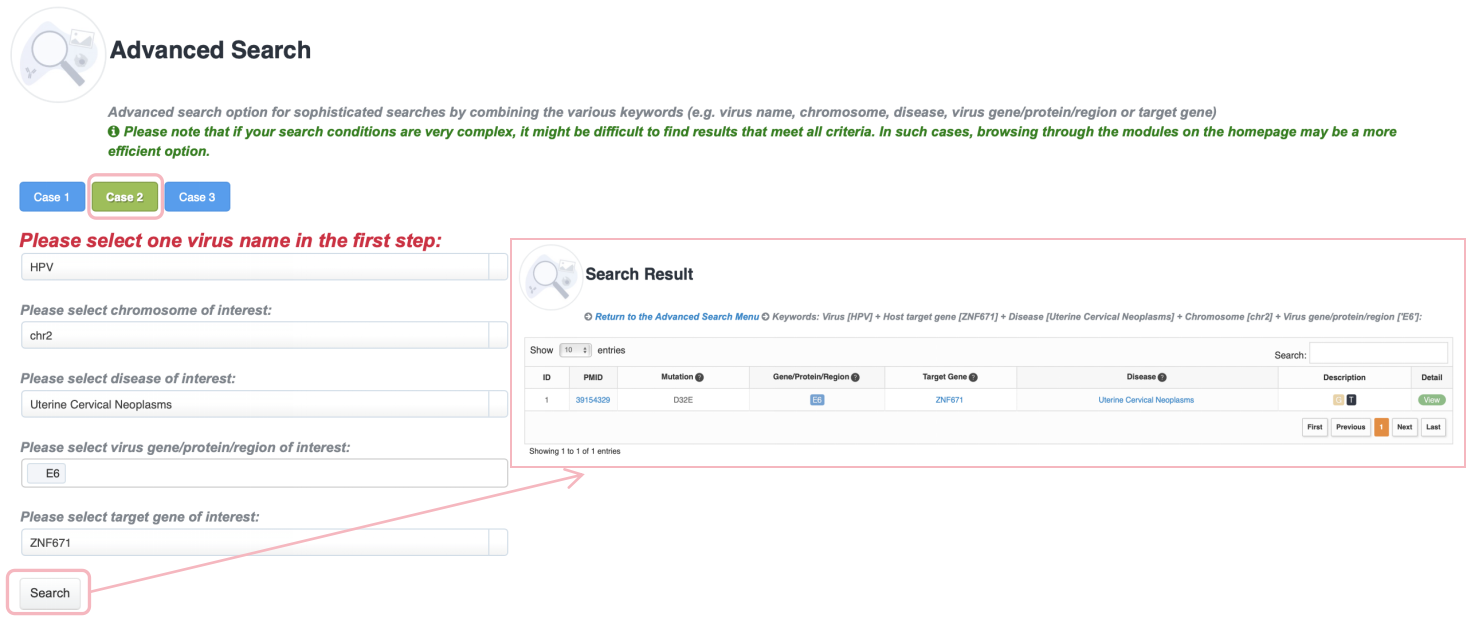
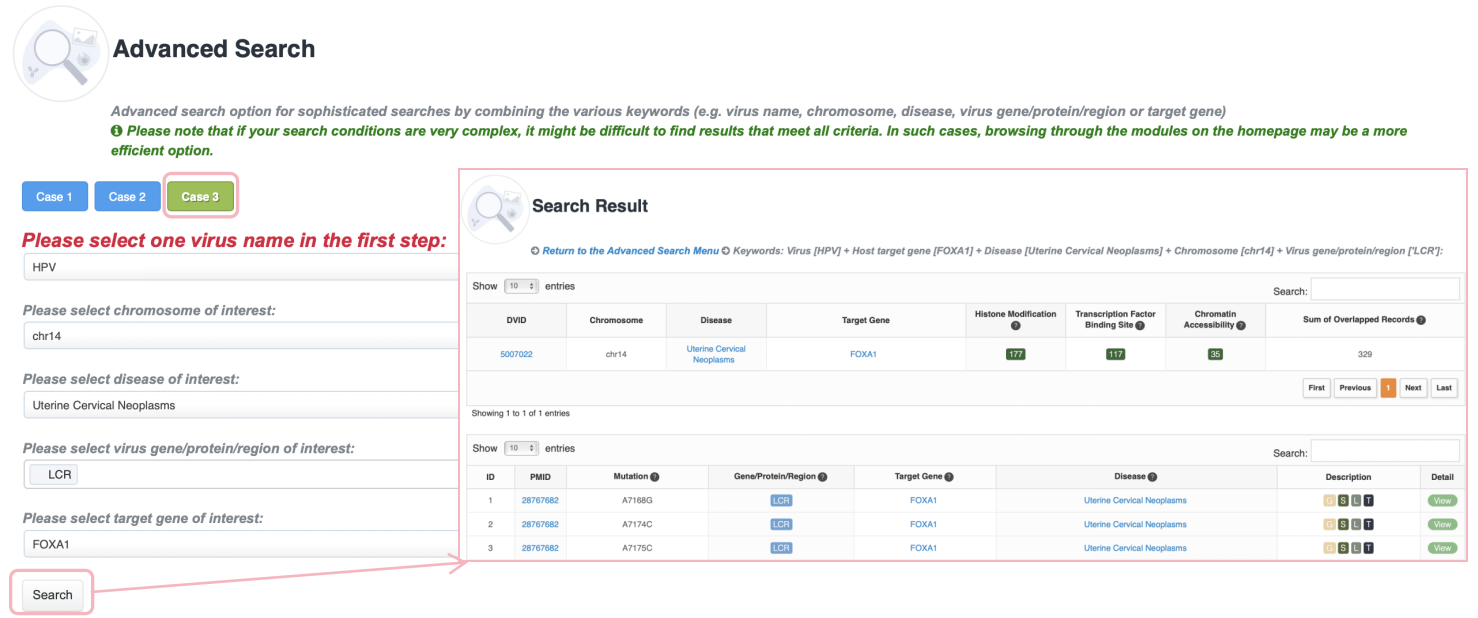
Advanced Search
Advanced search option for sophisticated searches by combining the various keywords (e.g., virus name, chromosome, disease, virus gene/protein/region or target gene). ViMIC 2.0 provides three search examples. Please note that if your search conditions are very complex, it might be difficult to find results that meet all criteria. In such cases, browsing through the modules on the homepage may be a more efficient option.
Return to Top
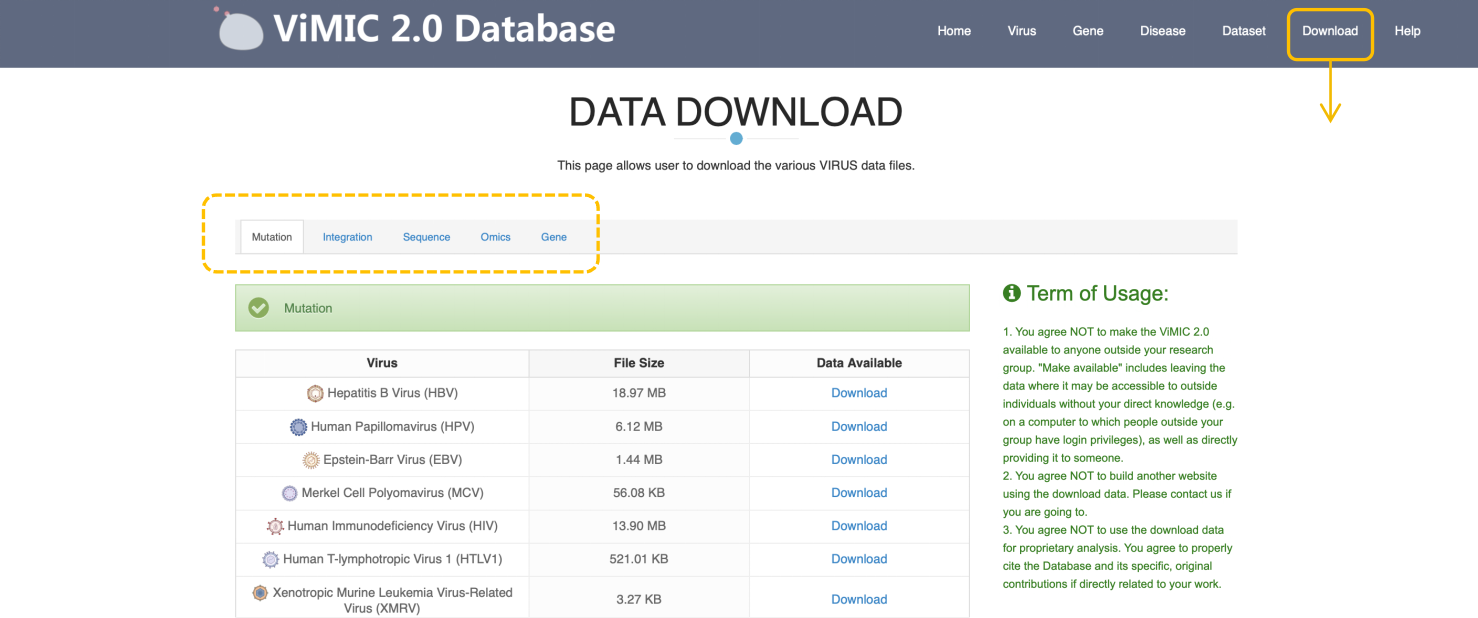
Download
The ViMIC 2.0 allows the user to download the various virus data files including mutation, integration, sequences annotation, omics and target gene.
Return to Top
Contact us
EmailsYing Wang: nadger_wang@139.comAddressYueyang Hospital of Integrated Traditional Chinese and Western Medicine, Ganhe Road, No.110, Shanghai, P.R. ChinaReturn to Top |
|