Gene Information
|
Gene Name
|
ABCC8 |
|
Gene ID
|
6833
|
|
Gene Full Name
|
ATP binding cassette subfamily C member 8 |
|
Gene Alias
|
ABC36|HHF1|HI|HRINS|MRP8|PHHI|PNDM3|SUR|SUR1|SUR1delta2|TNDM2 |
|
Transcripts
|
ENSG00000006071
|
|
Virus
|
HBV |
|
Gene Type
|
protein-coding |
|
HPA Location Info
|
Nucleoli, Golgi apparatus;Cytosol, Principal piece; 
|
|
Membrane Info
|
Disease related genes, FDA approved drug targets, Human disease related genes, Metabolic proteins, Plasma proteins, Predicted membrane proteins, Transporters |
|
Uniport_ID
|
Q09428
|
|
HGNC ID
|
HGNC:59
|
|
OMIM ID
|
600509 |
|
Summary
|
The protein encoded by this gene is a member of the superfamily of ATP-binding cassette (ABC) transporters. ABC proteins transport various molecules across extra- and intra-cellular membranes. ABC genes are divided into seven distinct subfamilies (ABC1, MDR/TAP, MRP, ALD, OABP, GCN20, White). This protein is a member of the MRP subfamily which is involved in multi-drug resistance. This protein functions as a modulator of ATP-sensitive potassium channels and insulin release. Mutations in the ABCC8 gene and deficiencies in the encoded protein have been observed in patients with hyperinsulinemic hypoglycemia of infancy, an autosomal recessive disorder of unregulated and high insulin secretion. Mutations have also been associated with non-insulin-dependent diabetes mellitus type II, an autosomal dominant disease of defective insulin secretion. Alternatively spliced transcript variants have been found for this gene. [provided by RefSeq, Jul 2020] |
Target gene [ABCC8] related to VISs 
Integration Table: if previous studies reported that target gene was altered by virus integration events, the overlap between VISs in this literature and Cistrome factors was listed in this section
| DVID |
Chromosome |
HM |
TFBS |
CA |
Sum of Overlapped Records |
Detail |
| 1009999 |
chr11 |
8 |
5 |
0 |
13 |
View |
| 1012352 |
chr11 |
4 |
3 |
0 |
7 |
View |
Target gene [ABCC8] related to Omics data
| Data ID |
Experiment type |
Sample number |
Platform |
|
GSE236281
|
RNA-seq |
12 |
Illumina MiSeq (Homo sapiens) |
|
C GSE35465
|
Chip-seq;RNA-seq |
6 |
Illumina HiSeq 2000 (Homo sapiens) |
|
C GSE68402
|
Chip-seq |
26 |
Illumina MiSeq (Homo sapiens);Illumina HiSeq 2500 (Homo sapiens) |
|
TCGA_LIHC_HBV
|
DNA methylation sequencing;RNA-seq |
97 |
TCGA |
|
GSE224901
|
RNA-seq |
21 |
Illumina NovaSeq 6000 (Homo sapiens) |
|
C GSE100400
|
Chip-seq;RNA-seq;4C_cccDNA |
31 |
Illumina NextSeq 500 (Homo sapiens);Illumina NextSeq 500 (Mus musculus) |
|
GSE173897
|
RNA-seq |
95 |
Illumina HiSeq 4000 (Homo sapiens) |
|
GSE262515
|
RNA-seq |
21 |
Illumina HiSeq 2500 (Homo sapiens);Illumina HiSeq 2500 (Mus musculus) |
|
GSE110345
|
RNA-seq |
4 |
Illumina HiSeq 2500 (Homo sapiens) |
|
C GSE131257
|
ATAC-seq;RNA-seq |
19 |
Illumina HiSeq 2500 (Homo sapiens) |
|
GSE94660
|
RNA-seq |
42 |
Illumina HiSeq 2500 (Homo sapiens) |
When the gene can detect a peak in the dataset, a peak plot will be displayed.
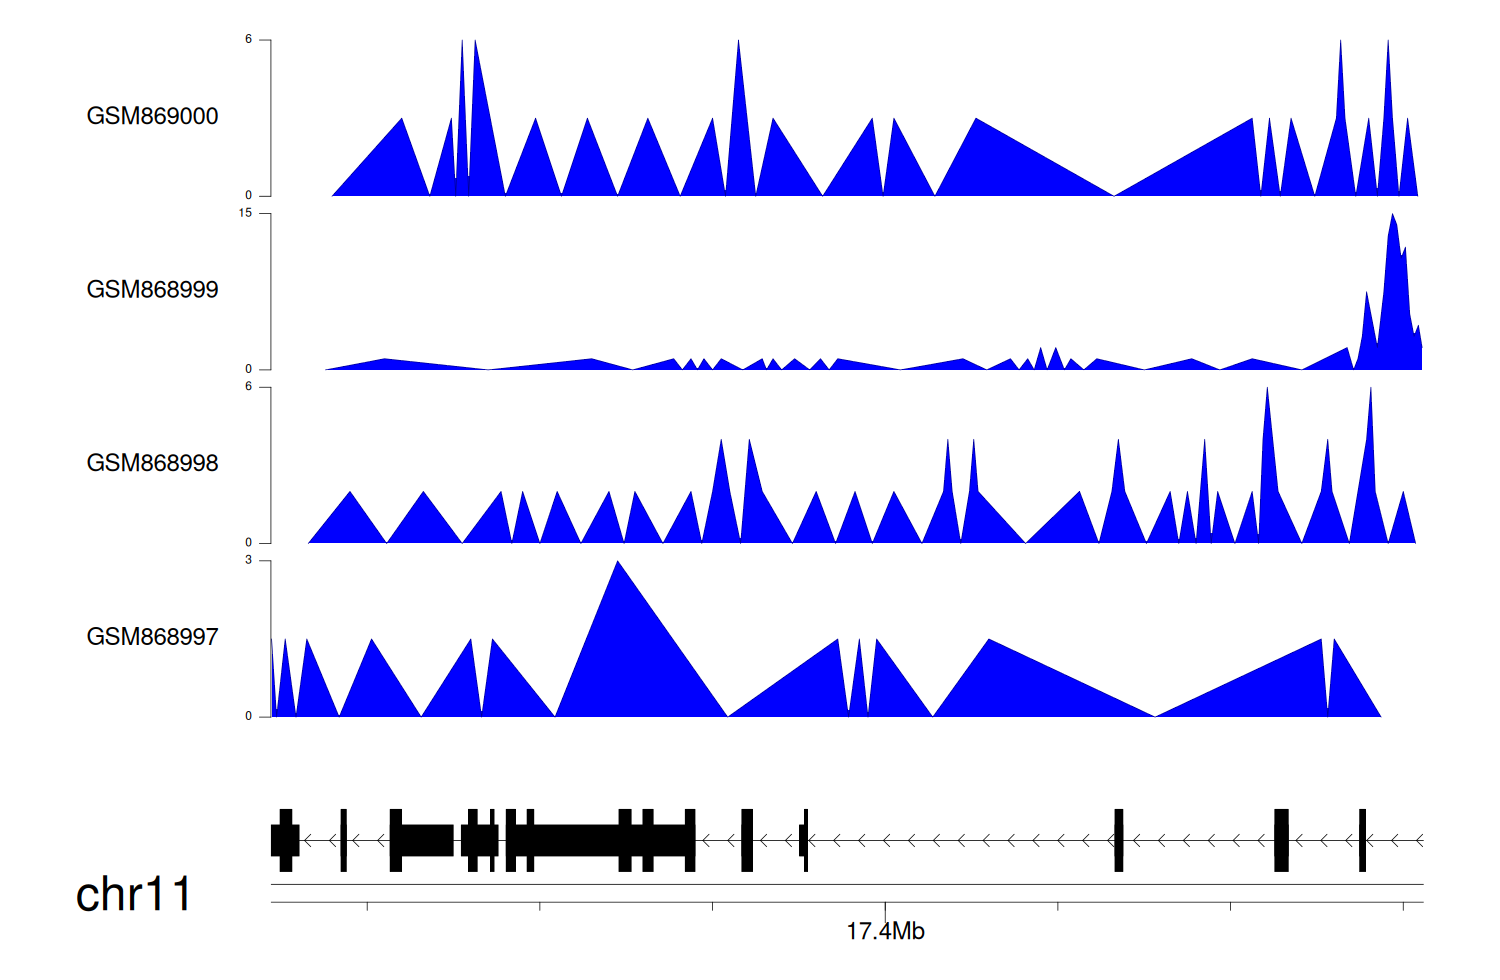
> Dataset: GSE35465 - ABCC8 peak across samples
|
Peak Plot
|
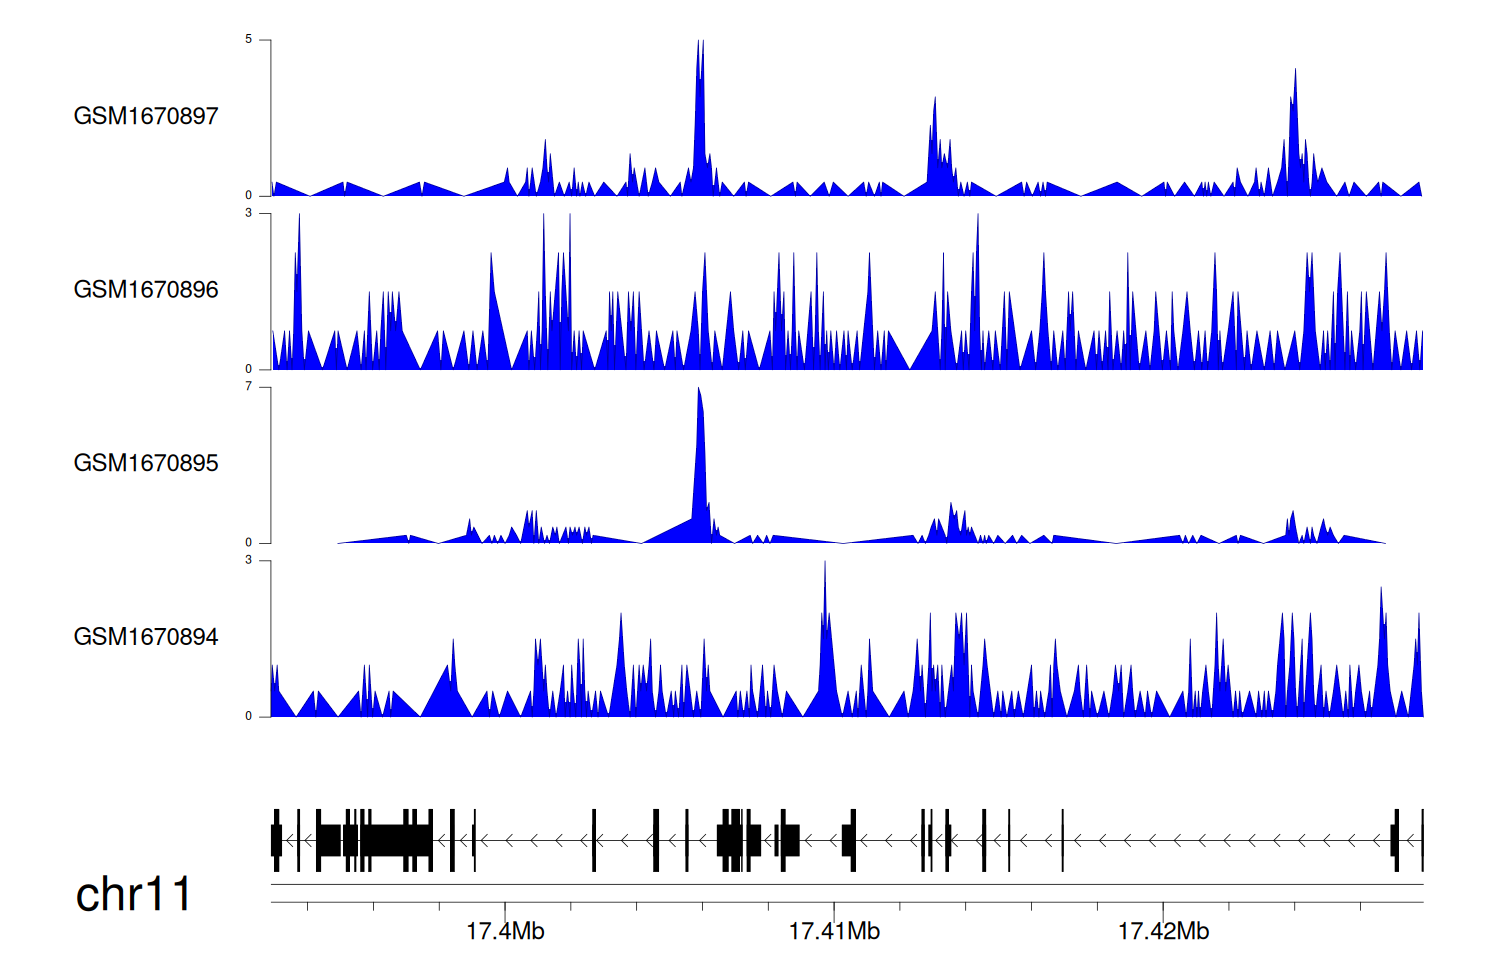
> Dataset: GSE68402 - ABCC8 peak across samples
|
Peak Plot
|
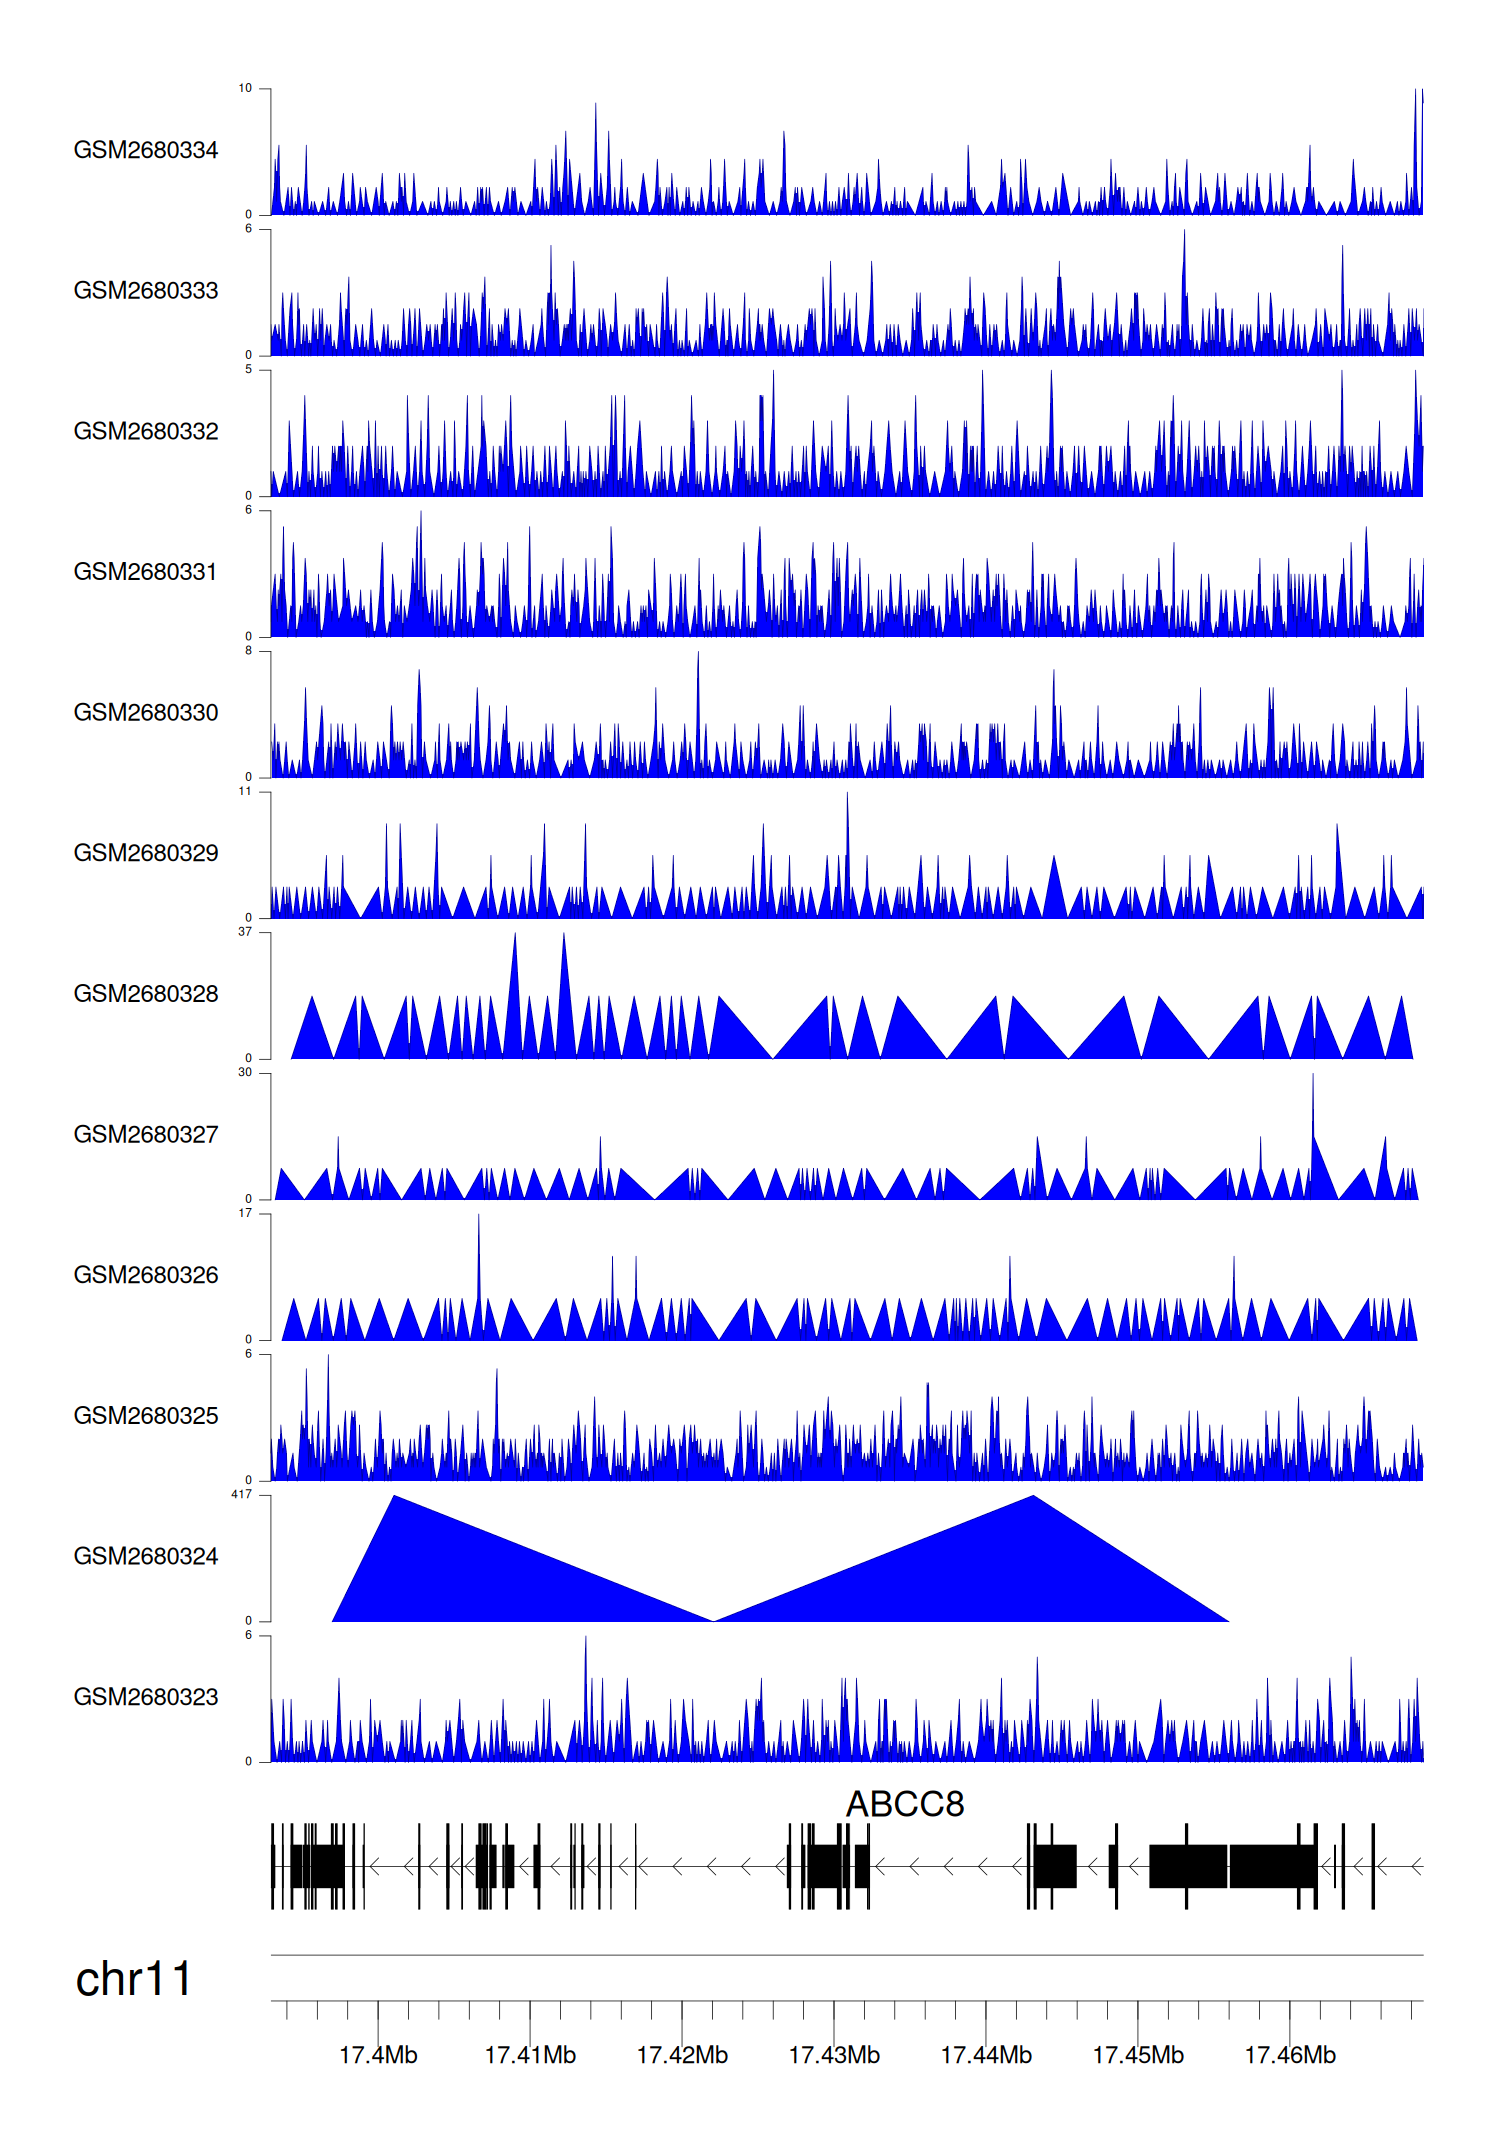
> Dataset: GSE100400 - ABCC8 peak across samples
|
Peak Plot
|
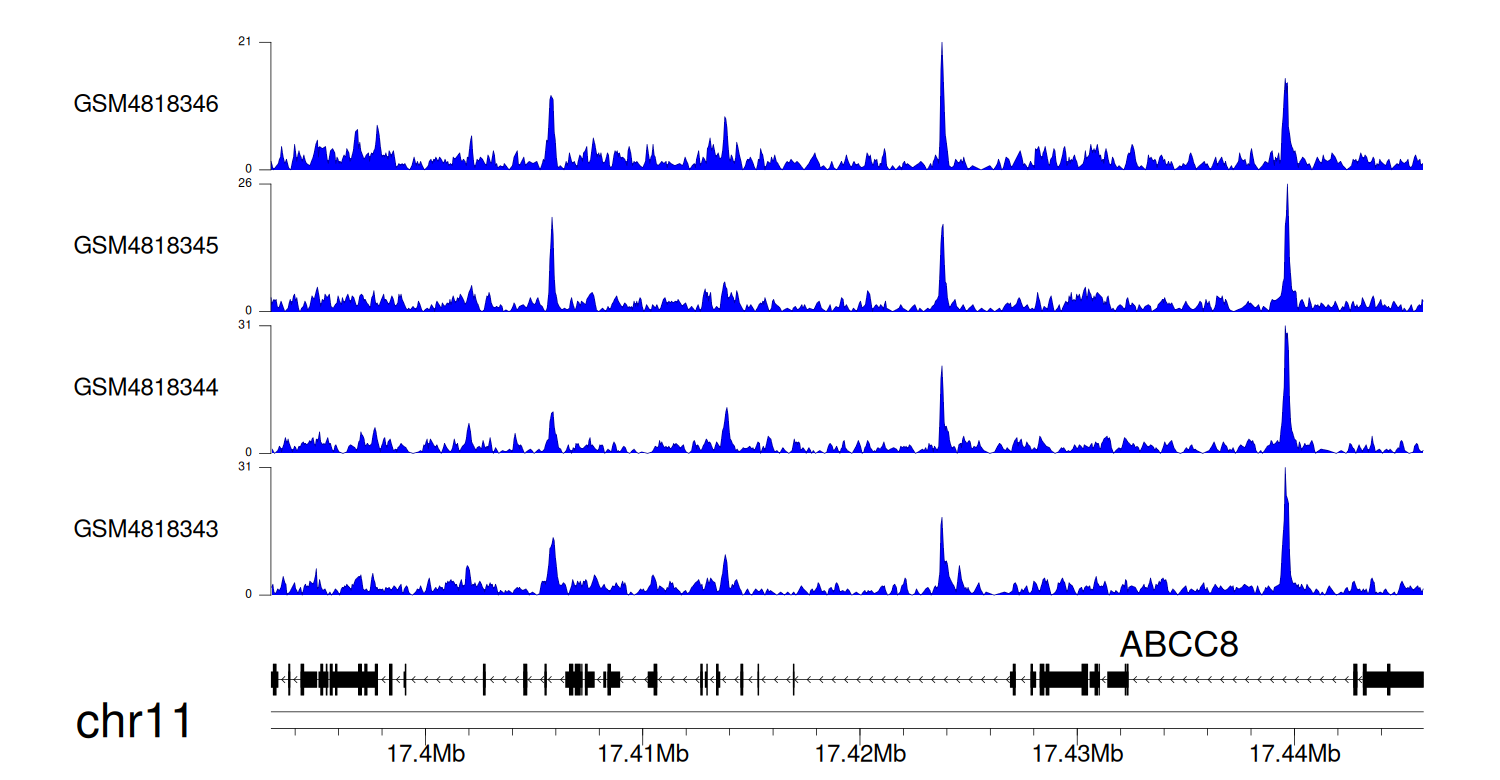
> Dataset: GSE131257 - ABCC8 peak across samples
|
Peak Plot
|
|
|
