Gene Information
|
Gene Name
|
ATP13A5 |
|
Gene ID
|
344905
|
|
Gene Full Name
|
ATPase 13A5 |
|
Gene Alias
|
- |
|
Transcripts
|
ENSG00000187527
|
|
Virus
|
HBV |
|
Gene Type
|
protein-coding |
|
HPA Location Info
|
Plasma membrane;Nucleoplasm; 
|
|
Membrane Info
|
Predicted membrane proteins |
|
Uniport_ID
|
Q4VNC0
|
|
HGNC ID
|
HGNC:31789
|
|
OMIM ID
|
619119 |
|
Summary
|
This gene encodes a member of the P5 subfamily of P-type transport ATPases. P-type ATPases form a large superfamily of cation and lipid pumps that transport inorganic cations and other substrates across cell membranes. P5 ATPases are localized to membranes of the endoplasmic reticulum (ER) and serve many important functions including transport of cargo proteins to the Golgi, glycosylation and cell wall biosynthesis, control of protein insertion orientation, 3-hydroxy-3-methylglutaryl-CoA reductase (HMGR) degradation, and sensitivity to unfolded protein response (UPR) activators. The encoded protein is organized into three cytoplasmic domains (A, P, and N) and two membrane-embedded domains (T and S). The N-domain binds ATP and serves as a built-in protein kinase, which phosphorylates the P-domain. The A-domain is an intrinsic protein phosphatase, which dephosphorylates the P-domain once during each catalytic cycle. [provided by RefSeq, Jul 2017] |
Target gene [ATP13A5] related to VISs 
Integration Table: if previous studies reported that target gene was altered by virus integration events, the overlap between VISs in this literature and Cistrome factors was listed in this section
| DVID |
Chromosome |
HM |
TFBS |
CA |
Sum of Overlapped Records |
Detail |
| 1013684 |
chr3 |
2 |
1 |
1 |
4 |
View |
| 1023881 |
chr3 |
2 |
1 |
1 |
4 |
View |
Target gene [ATP13A5] related to Omics data
| Data ID |
Experiment type |
Sample number |
Platform |
|
GSE236281
|
RNA-seq |
12 |
Illumina MiSeq (Homo sapiens) |
|
C GSE68402
|
Chip-seq |
26 |
Illumina MiSeq (Homo sapiens);Illumina HiSeq 2500 (Homo sapiens) |
|
TCGA_LIHC_HBV
|
DNA methylation sequencing;RNA-seq |
97 |
TCGA |
|
GSE224901
|
RNA-seq |
21 |
Illumina NovaSeq 6000 (Homo sapiens) |
|
GSE100400
|
Chip-seq;RNA-seq;4C_cccDNA |
31 |
Illumina NextSeq 500 (Homo sapiens);Illumina NextSeq 500 (Mus musculus) |
|
GSE173897
|
RNA-seq |
95 |
Illumina HiSeq 4000 (Homo sapiens) |
|
GSE262515
|
RNA-seq |
21 |
Illumina HiSeq 2500 (Homo sapiens);Illumina HiSeq 2500 (Mus musculus) |
|
GSE110345
|
RNA-seq |
4 |
Illumina HiSeq 2500 (Homo sapiens) |
|
C GSE131257
|
ATAC-seq;RNA-seq |
19 |
Illumina HiSeq 2500 (Homo sapiens) |
|
GSE94660
|
RNA-seq |
42 |
Illumina HiSeq 2500 (Homo sapiens) |
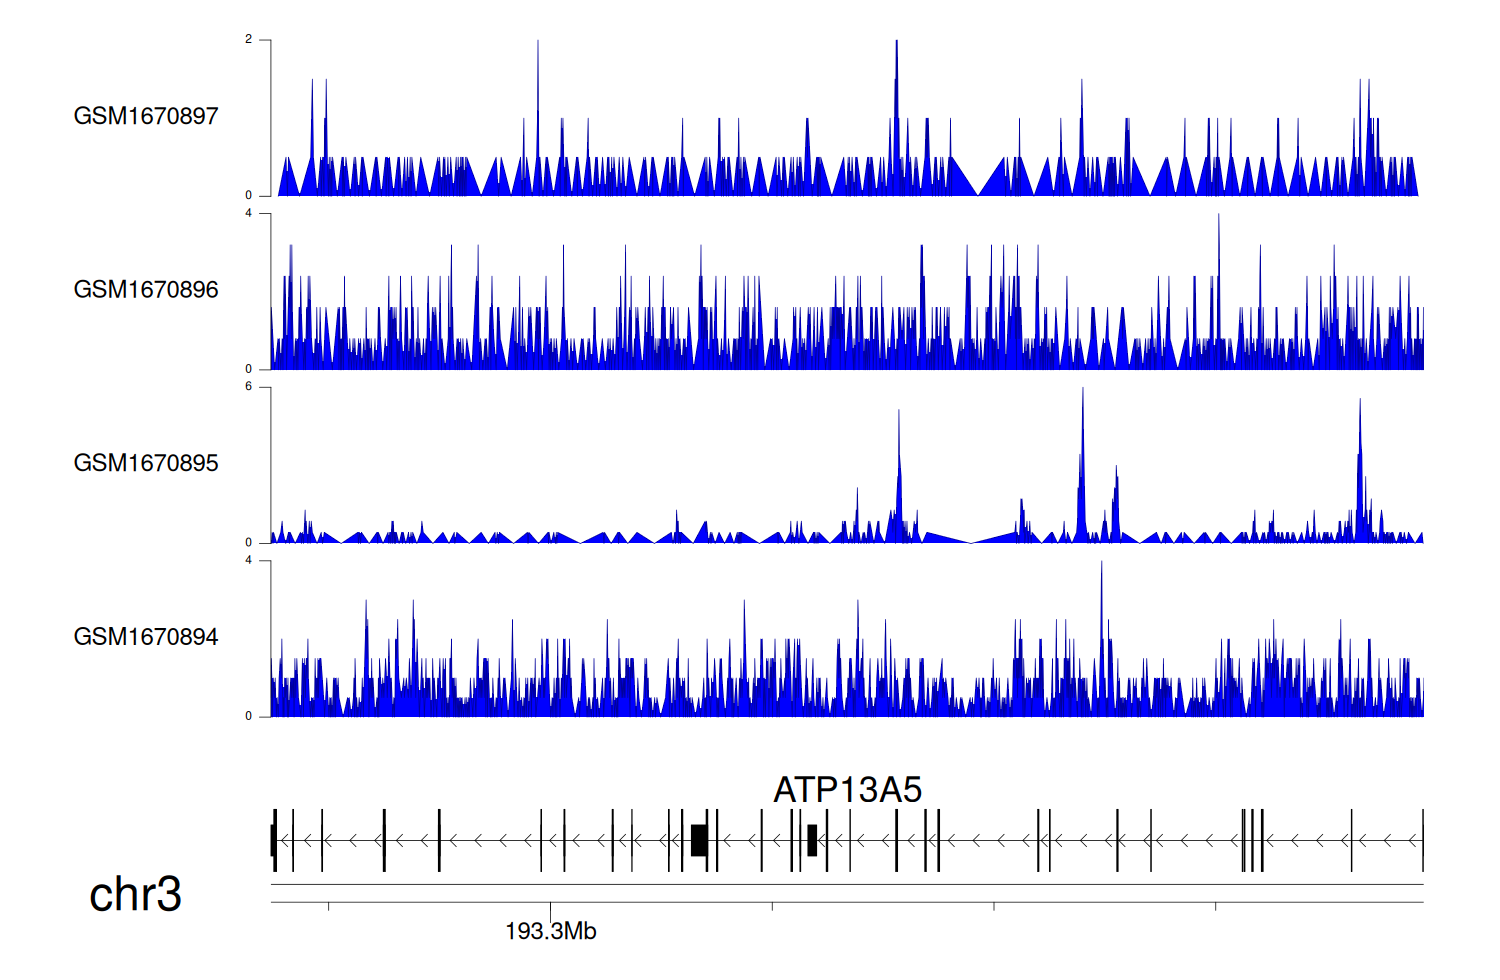
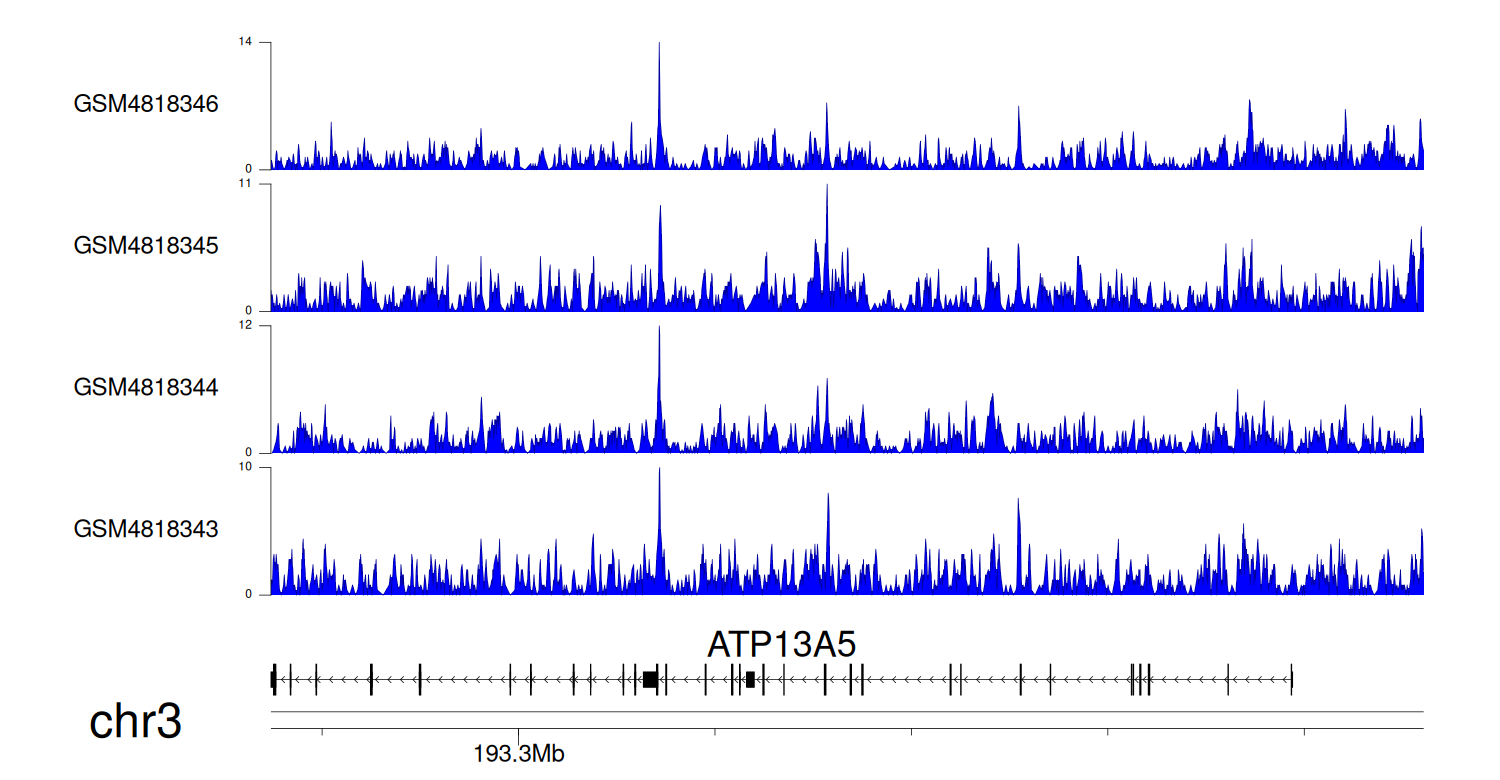
When the gene can detect a peak in the dataset, a peak plot will be displayed.
> Dataset: GSE68402 - ATP13A5 peak across samples
|
Peak Plot
|
> Dataset: GSE131257 - ATP13A5 peak across samples
|
Peak Plot
|
|
|
