Gene Information
|
Gene Name
|
COL25A1 |
|
Gene ID
|
84570
|
|
Gene Full Name
|
collagen type XXV alpha 1 chain |
|
Gene Alias
|
AMY|CFEOM5|CLAC|CLAC-P|CLACP |
|
Transcripts
|
ENSG00000188517
|
|
Virus
|
HBV |
|
Gene Type
|
protein-coding |
|
HPA Location Info
|
Vesicles, Cytosol;Endoplasmic reticulum; 
|
|
Membrane Info
|
Disease related genes, Human disease related genes, Predicted intracellular proteins, Predicted membrane proteins |
|
Uniport_ID
|
Q9BXS0
|
|
HGNC ID
|
HGNC:18603
|
|
OMIM ID
|
610004 |
|
Summary
|
This gene encodes a brain-specific membrane associated collagen. A product of proteolytic processing of the encoded protein, CLAC (collagenous Alzheimer amyloid plaque component), binds to amyloid beta-peptides found in Alzheimer amyloid plaques but CLAC inhibits rather than facilitates amyloid fibril elongation (PMID: 16300410). A study of over-expression of this collagen in mice, however, found changes in pathology and behavior suggesting that the encoded protein may promote amyloid plaque formation (PMID: 19548013). Multiple transcript variants encoding different isoforms have been found for this gene. [provided by RefSeq, Dec 2011] |
Target gene [COL25A1] related to VISs 
Integration Table: if previous studies reported that target gene was altered by virus integration events, the overlap between VISs in this literature and Cistrome factors was listed in this section
| DVID |
Chromosome |
HM |
TFBS |
CA |
Sum of Overlapped Records |
Detail |
| 1013405 |
chr4 |
1 |
3 |
1 |
5 |
View |
Target gene [COL25A1] related to Omics data
| Data ID |
Experiment type |
Sample number |
Platform |
|
GSE236281
|
RNA-seq |
12 |
Illumina MiSeq (Homo sapiens) |
|
C GSE68402
|
Chip-seq |
26 |
Illumina MiSeq (Homo sapiens);Illumina HiSeq 2500 (Homo sapiens) |
|
TCGA_LIHC_HBV
|
DNA methylation sequencing;RNA-seq |
97 |
TCGA |
|
GSE224901
|
RNA-seq |
21 |
Illumina NovaSeq 6000 (Homo sapiens) |
|
C GSE100400
|
Chip-seq;RNA-seq;4C_cccDNA |
31 |
Illumina NextSeq 500 (Homo sapiens);Illumina NextSeq 500 (Mus musculus) |
|
GSE173897
|
RNA-seq |
95 |
Illumina HiSeq 4000 (Homo sapiens) |
|
GSE262515
|
RNA-seq |
21 |
Illumina HiSeq 2500 (Homo sapiens);Illumina HiSeq 2500 (Mus musculus) |
|
GSE110345
|
RNA-seq |
4 |
Illumina HiSeq 2500 (Homo sapiens) |
|
C GSE131257
|
ATAC-seq;RNA-seq |
19 |
Illumina HiSeq 2500 (Homo sapiens) |
|
GSE94660
|
RNA-seq |
42 |
Illumina HiSeq 2500 (Homo sapiens) |
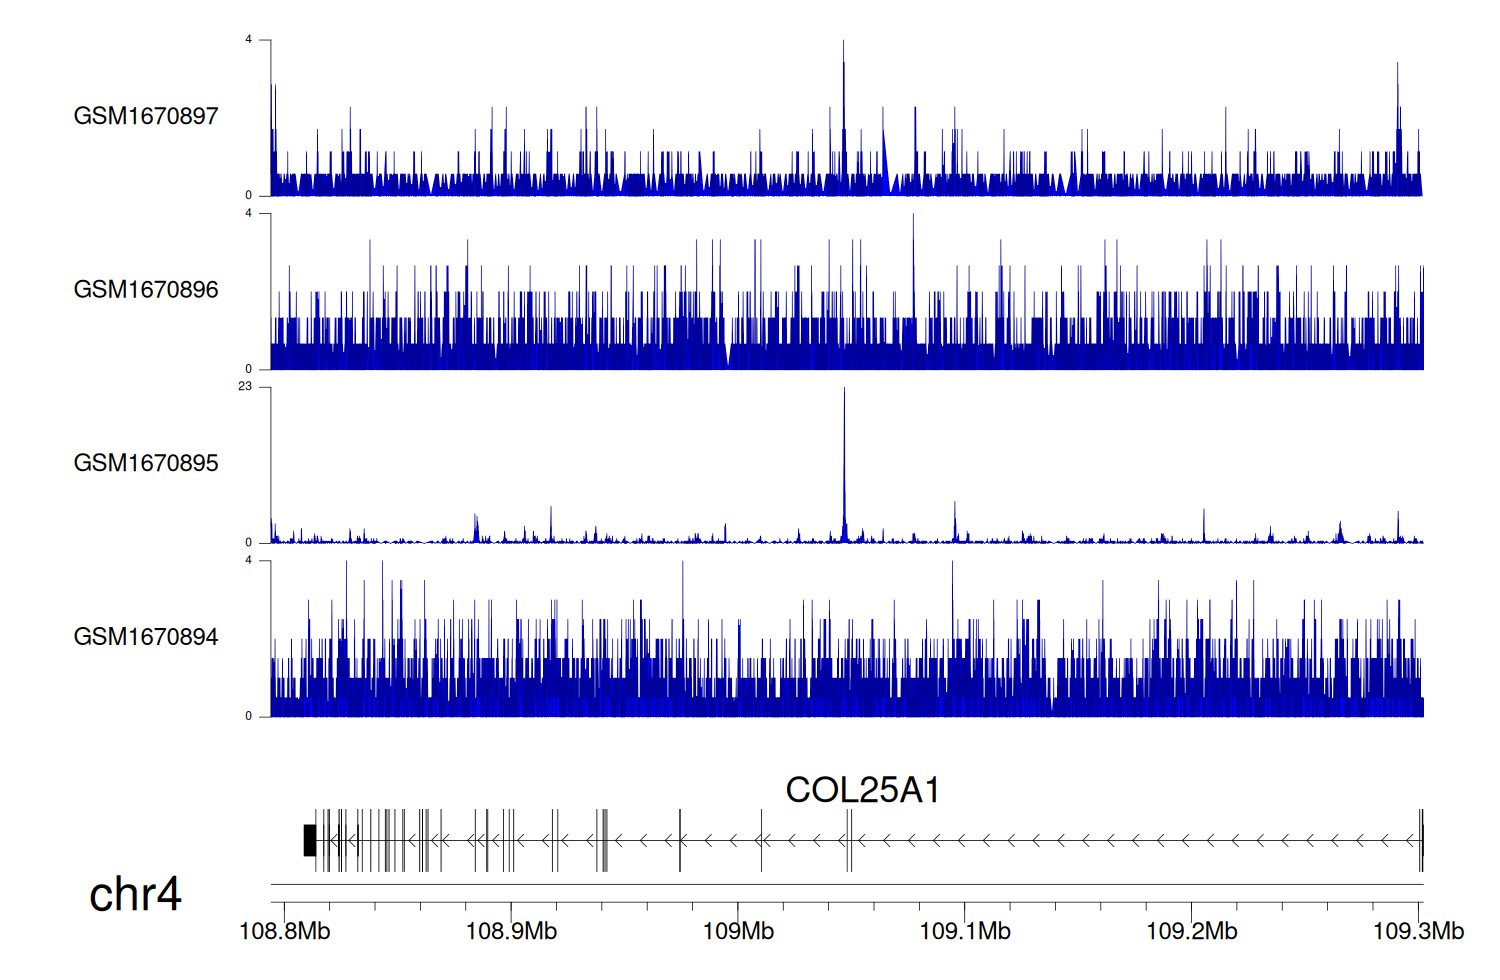
When the gene can detect a peak in the dataset, a peak plot will be displayed.
> Dataset: GSE68402 - COL25A1 peak across samples
|
Peak Plot
|
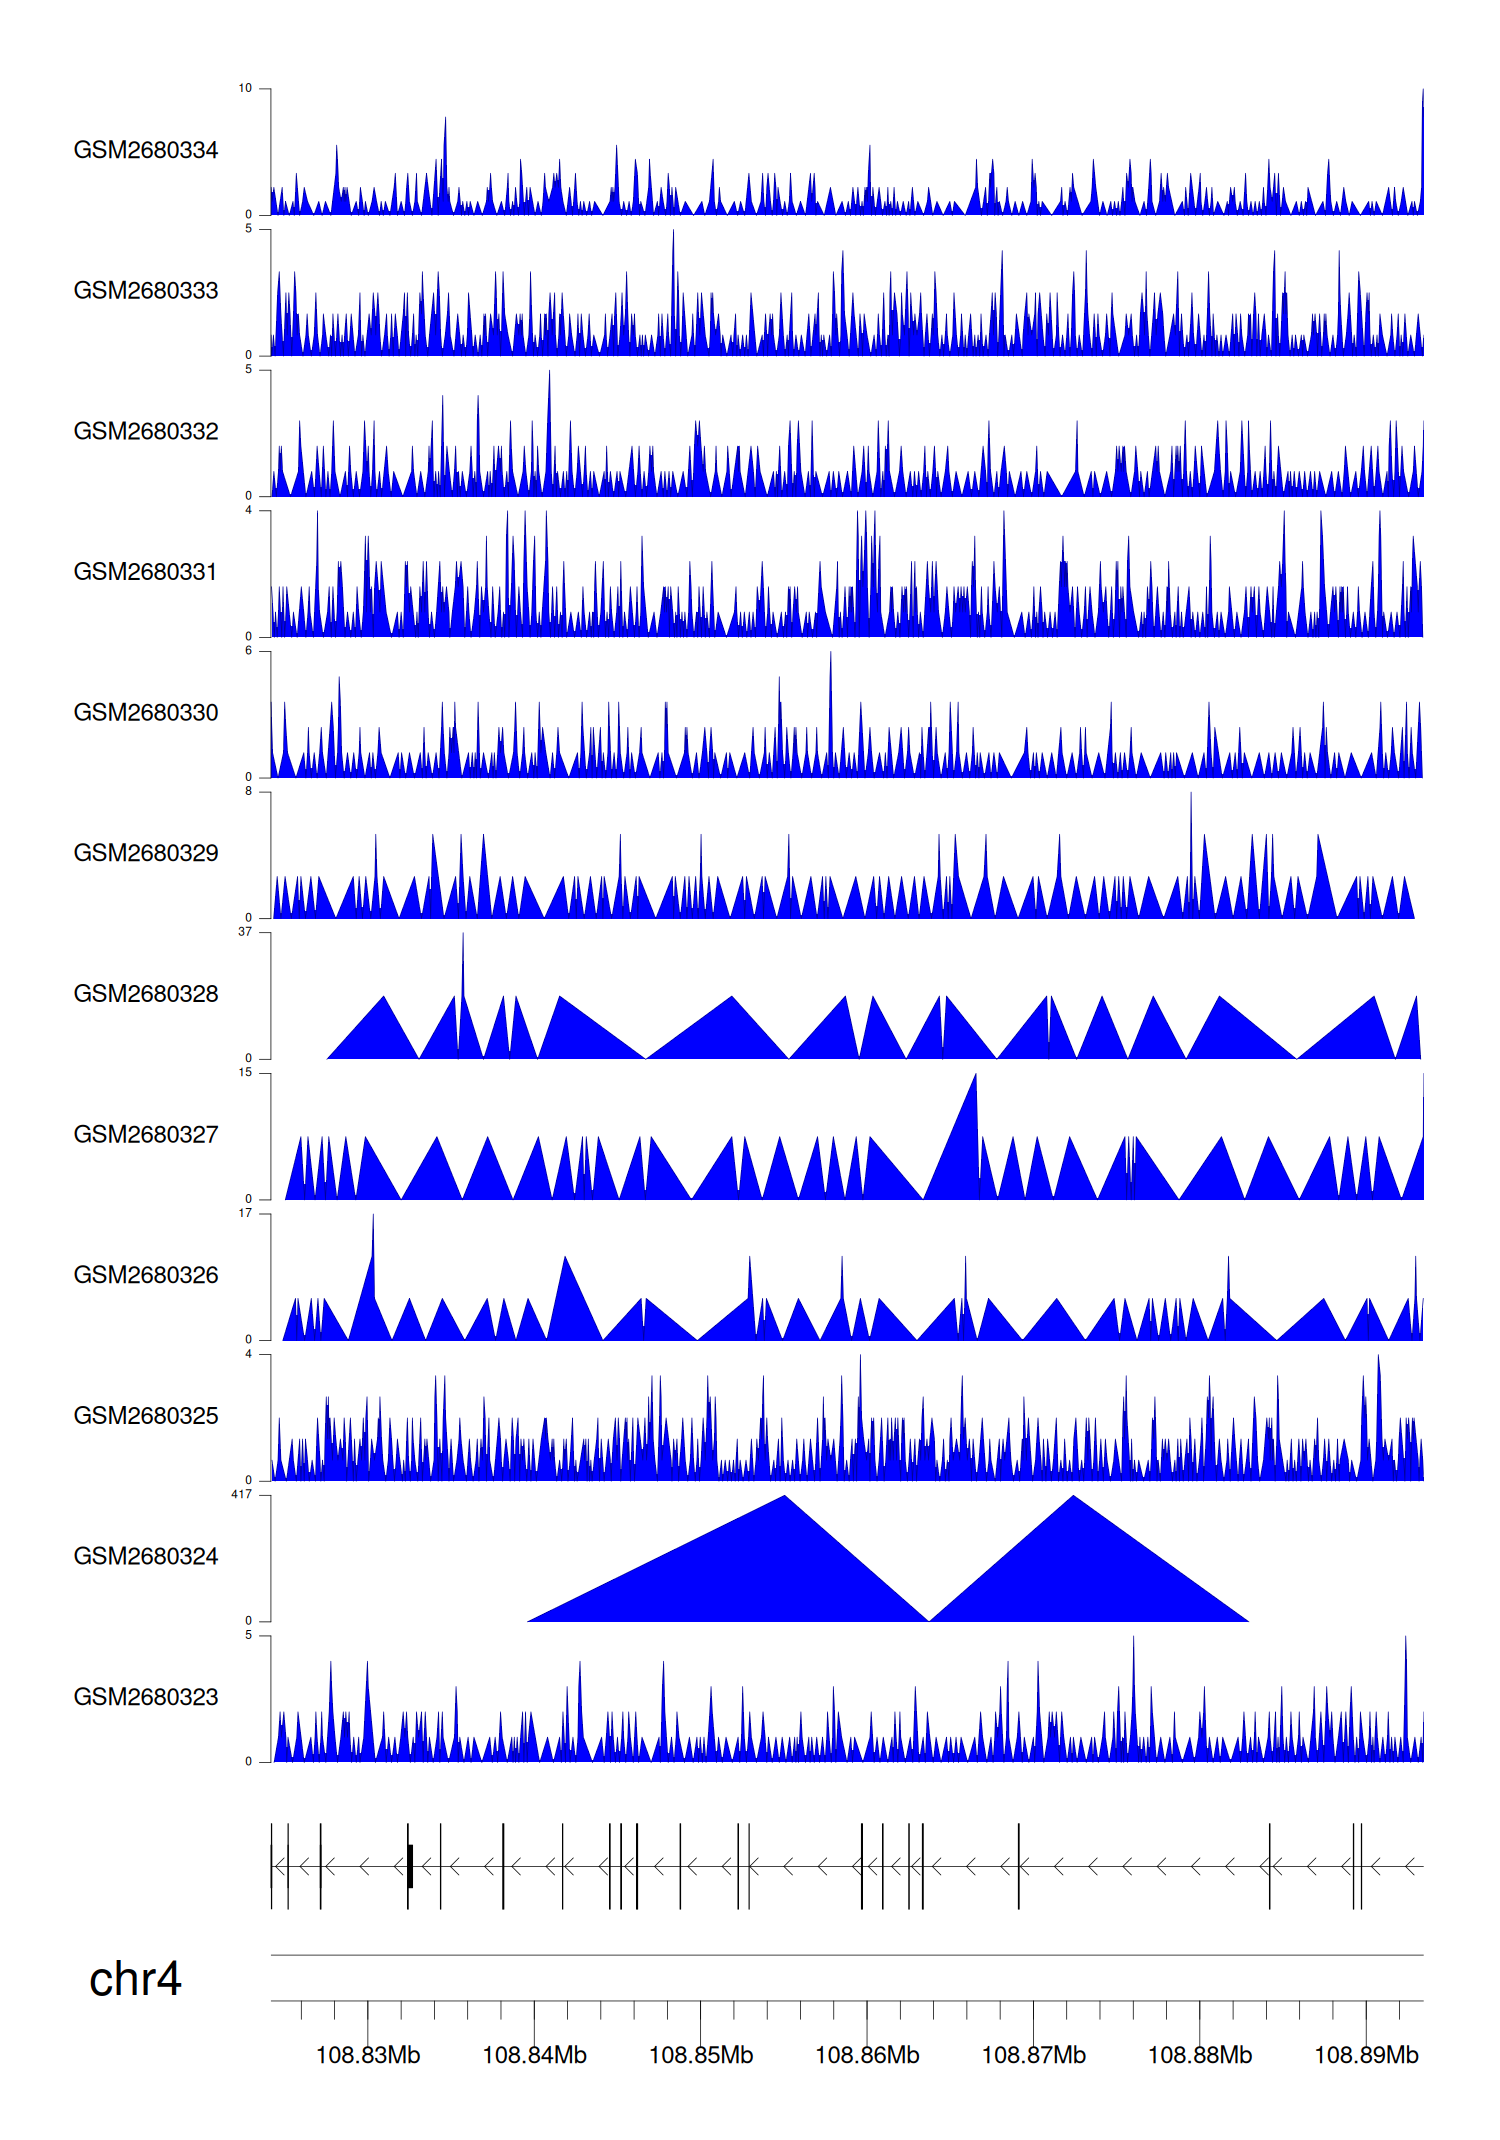
> Dataset: GSE100400 - COL25A1 peak across samples
|
Peak Plot
|
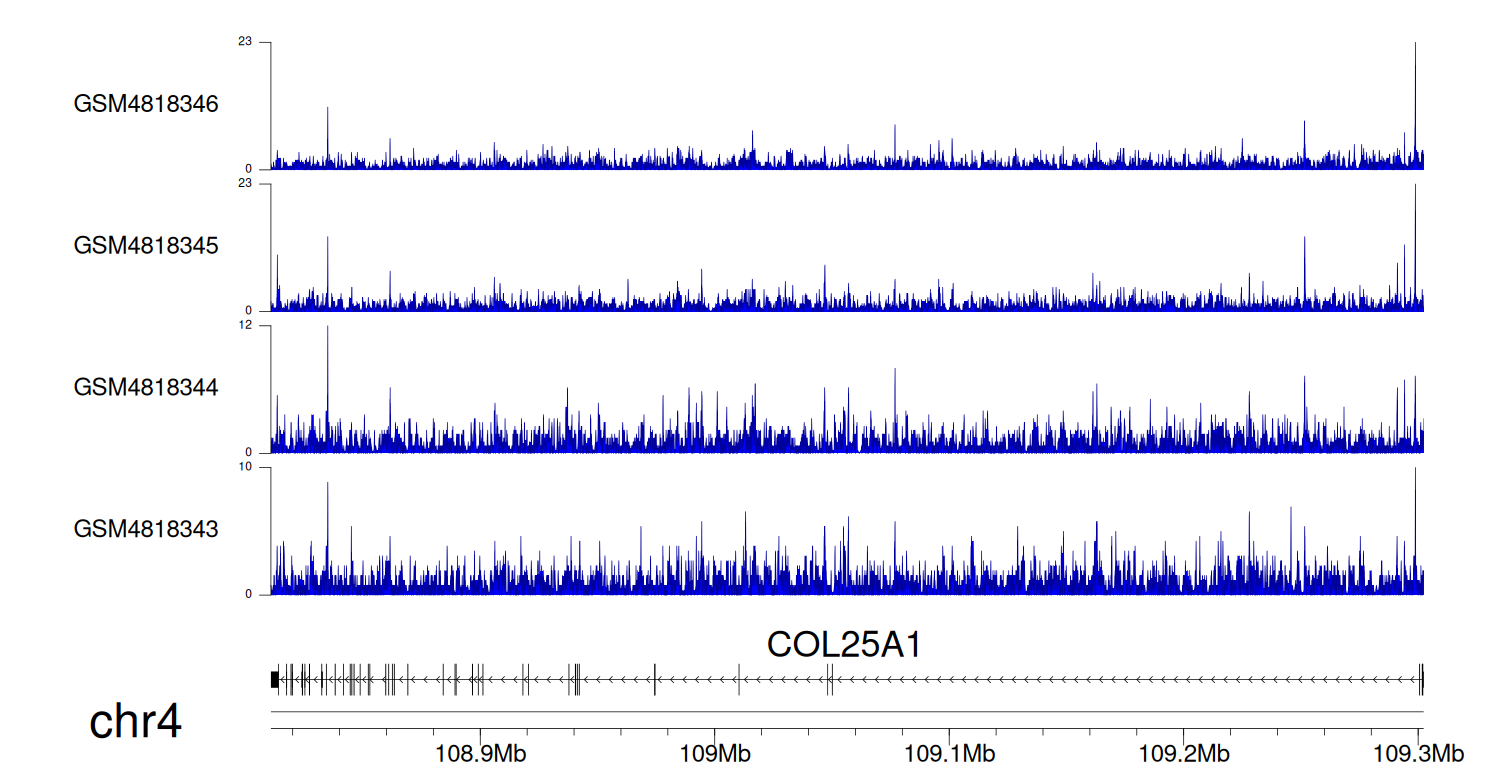
> Dataset: GSE131257 - COL25A1 peak across samples
|
Peak Plot
|
|
|
