Gene Information
|
Gene Name
|
GRM3 |
|
Gene ID
|
2913
|
|
Gene Full Name
|
glutamate metabotropic receptor 3 |
|
Gene Alias
|
GLUR3|GPRC1C|MGLUR3|mGlu3 |
|
Transcripts
|
ENSG00000198822
|
|
Virus
|
HBV |
|
Gene Type
|
protein-coding |
|
HPA Location Info
|
Intracellular and membrane; 
|
|
Membrane Info
|
G-protein coupled receptors, Predicted intracellular proteins, Predicted membrane proteins |
|
Uniport_ID
|
Q14832
|
|
HGNC ID
|
HGNC:4595
|
|
OMIM ID
|
601115 |
|
Summary
|
L-glutamate is the major excitatory neurotransmitter in the central nervous system and activates both ionotropic and metabotropic glutamate receptors. Glutamatergic neurotransmission is involved in most aspects of normal brain function and can be perturbed in many neuropathologic conditions. The metabotropic glutamate receptors are a family of G protein-coupled receptors, that have been divided into 3 groups on the basis of sequence homology, putative signal transduction mechanisms, and pharmacologic properties. Group I includes GRM1 and GRM5 and these receptors have been shown to activate phospholipase C. Group II includes GRM2 and GRM3 while Group III includes GRM4, GRM6, GRM7 and GRM8. Group II and III receptors are linked to the inhibition of the cyclic AMP cascade but differ in their agonist selectivities. [provided by RefSeq, Jul 2008] |
Target gene [GRM3] related to VISs 
Integration Table: if previous studies reported that target gene was altered by virus integration events, the overlap between VISs in this literature and Cistrome factors was listed in this section
| DVID |
Chromosome |
HM |
TFBS |
CA |
Sum of Overlapped Records |
Detail |
| 1041540 |
chr7 |
14 |
0 |
0 |
14 |
View |
Target gene [GRM3] related to Omics data
| Data ID |
Experiment type |
Sample number |
Platform |
|
GSE236281
|
RNA-seq |
12 |
Illumina MiSeq (Homo sapiens) |
|
C GSE68402
|
Chip-seq |
26 |
Illumina MiSeq (Homo sapiens);Illumina HiSeq 2500 (Homo sapiens) |
|
TCGA_LIHC_HBV
|
DNA methylation sequencing;RNA-seq |
97 |
TCGA |
|
GSE224901
|
RNA-seq |
21 |
Illumina NovaSeq 6000 (Homo sapiens) |
|
C GSE100400
|
Chip-seq;RNA-seq;4C_cccDNA |
31 |
Illumina NextSeq 500 (Homo sapiens);Illumina NextSeq 500 (Mus musculus) |
|
GSE173897
|
RNA-seq |
95 |
Illumina HiSeq 4000 (Homo sapiens) |
|
GSE262515
|
RNA-seq |
21 |
Illumina HiSeq 2500 (Homo sapiens);Illumina HiSeq 2500 (Mus musculus) |
|
GSE110345
|
RNA-seq |
4 |
Illumina HiSeq 2500 (Homo sapiens) |
|
C GSE131257
|
ATAC-seq;RNA-seq |
19 |
Illumina HiSeq 2500 (Homo sapiens) |
|
GSE94660
|
RNA-seq |
42 |
Illumina HiSeq 2500 (Homo sapiens) |
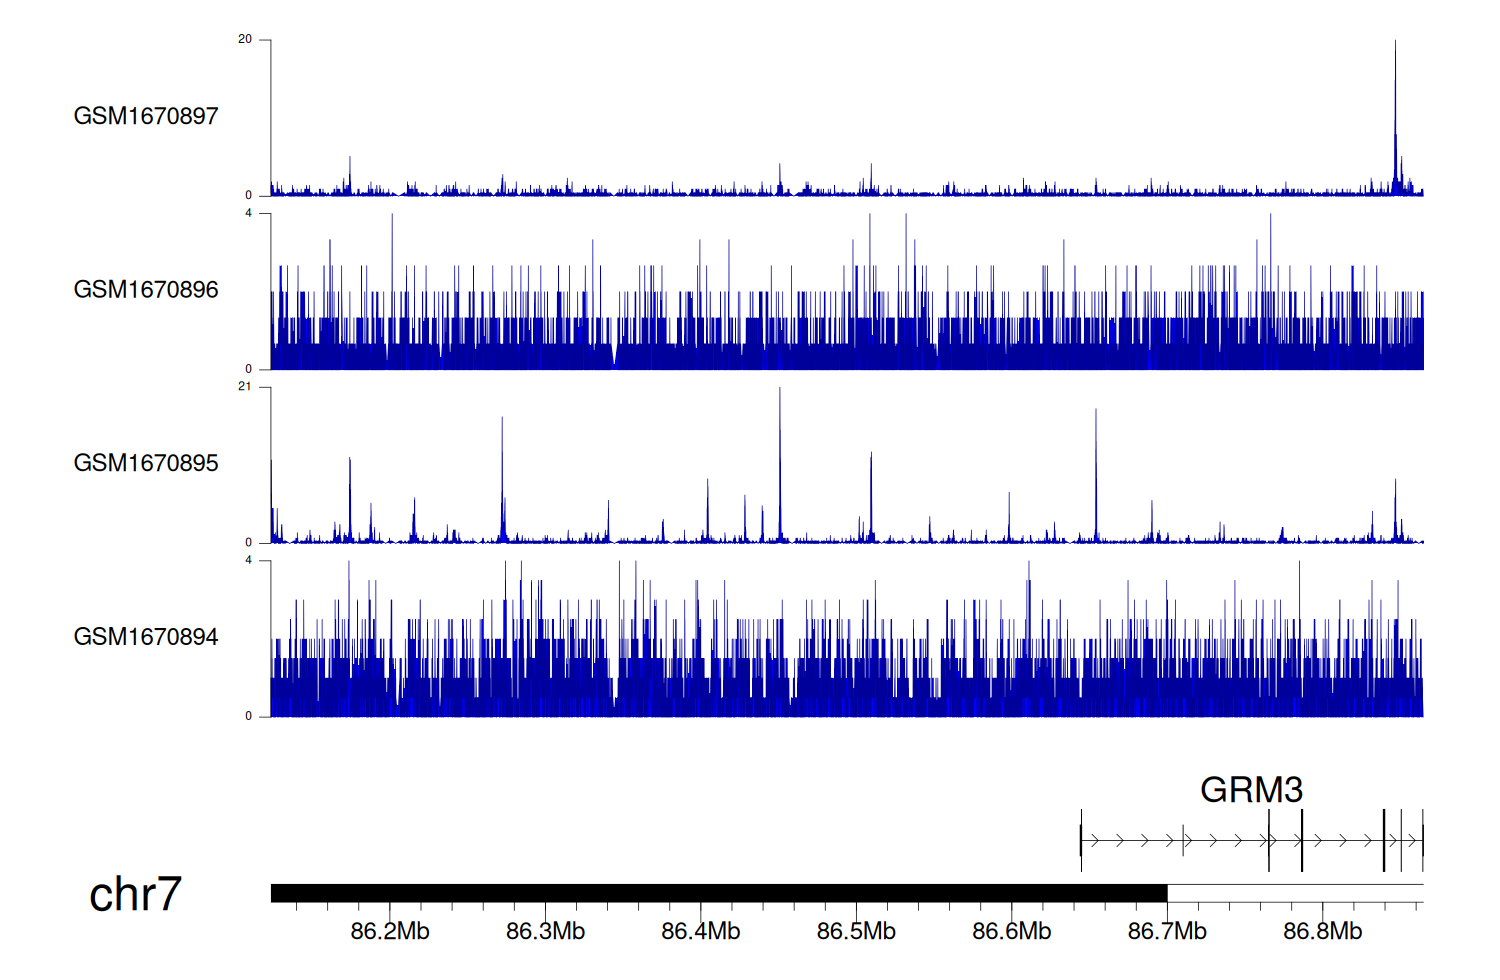
When the gene can detect a peak in the dataset, a peak plot will be displayed.
> Dataset: GSE68402 - GRM3 peak across samples
|
Peak Plot
|
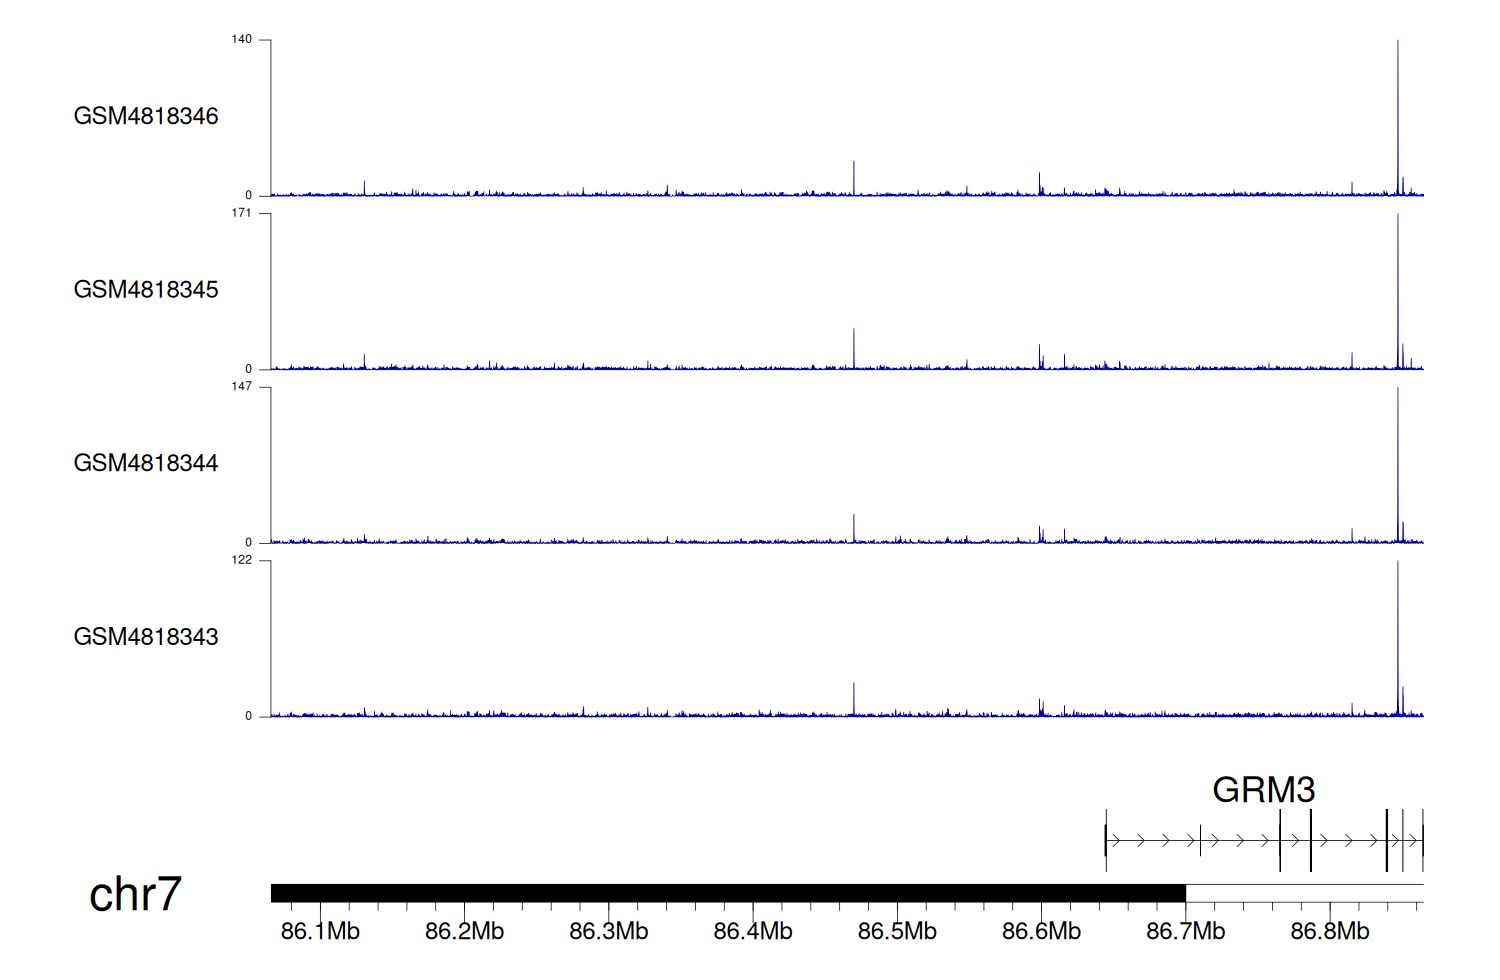
> Dataset: GSE100400 - GRM3 peak across samples
|
Peak Plot
|
> Dataset: GSE131257 - GRM3 peak across samples
|
Peak Plot
|
|
|
