Gene Information
|
Gene Name
|
IL10 |
|
Gene ID
|
3586
|
|
Gene Full Name
|
interleukin 10 |
|
Gene Alias
|
CSIF|GVHDS|IL-10|IL10A|TGIF |
|
Transcripts
|
ENSG00000136634
|
|
Virus
|
HBV |
|
Gene Type
|
protein-coding |
|
HPA Location Info
|
Secreted to blood; 
|
|
Membrane Info
|
Cancer-related genes, Candidate cardiovascular disease genes, Human disease related genes, Plasma proteins, Predicted intracellular proteins, Predicted secreted proteins |
|
Uniport_ID
|
P22301
|
|
HGNC ID
|
HGNC:5962
|
|
OMIM ID
|
124092 |
|
Summary
|
The protein encoded by this gene is a cytokine produced primarily by monocytes and to a lesser extent by lymphocytes. This cytokine has pleiotropic effects in immunoregulation and inflammation. It down-regulates the expression of Th1 cytokines, MHC class II Ags, and costimulatory molecules on macrophages. It also enhances B cell survival, proliferation, and antibody production. This cytokine can block NF-kappa B activity, and is involved in the regulation of the JAK-STAT signaling pathway. Knockout studies in mice suggested the function of this cytokine as an essential immunoregulator in the intestinal tract. Mutations in this gene are associated with an increased susceptibility to HIV-1 infection and rheumatoid arthritis. [provided by RefSeq, May 2020] |
Target gene [IL10] related to virus gene/protein/region 
Mutation Table: if previous studies reported that target gene was related to virus gene/region/protein, the information in this literature was listed in this section
Target gene [IL10] related to Omics data
| Data ID |
Experiment type |
Sample number |
Platform |
|
GSE236281
|
RNA-seq |
12 |
Illumina MiSeq (Homo sapiens) |
|
C GSE68402
|
Chip-seq |
26 |
Illumina MiSeq (Homo sapiens);Illumina HiSeq 2500 (Homo sapiens) |
|
TCGA_LIHC_HBV
|
DNA methylation sequencing;RNA-seq |
97 |
TCGA |
|
GSE224901
|
RNA-seq |
21 |
Illumina NovaSeq 6000 (Homo sapiens) |
|
C GSE100400
|
Chip-seq;RNA-seq;4C_cccDNA |
31 |
Illumina NextSeq 500 (Homo sapiens);Illumina NextSeq 500 (Mus musculus) |
|
GSE173897
|
RNA-seq |
95 |
Illumina HiSeq 4000 (Homo sapiens) |
|
GSE262515
|
RNA-seq |
21 |
Illumina HiSeq 2500 (Homo sapiens);Illumina HiSeq 2500 (Mus musculus) |
|
GSE110345
|
RNA-seq |
4 |
Illumina HiSeq 2500 (Homo sapiens) |
|
C GSE131257
|
ATAC-seq;RNA-seq |
19 |
Illumina HiSeq 2500 (Homo sapiens) |
|
GSE94660
|
RNA-seq |
42 |
Illumina HiSeq 2500 (Homo sapiens) |
When the gene can detect a peak in the dataset, a peak plot will be displayed.
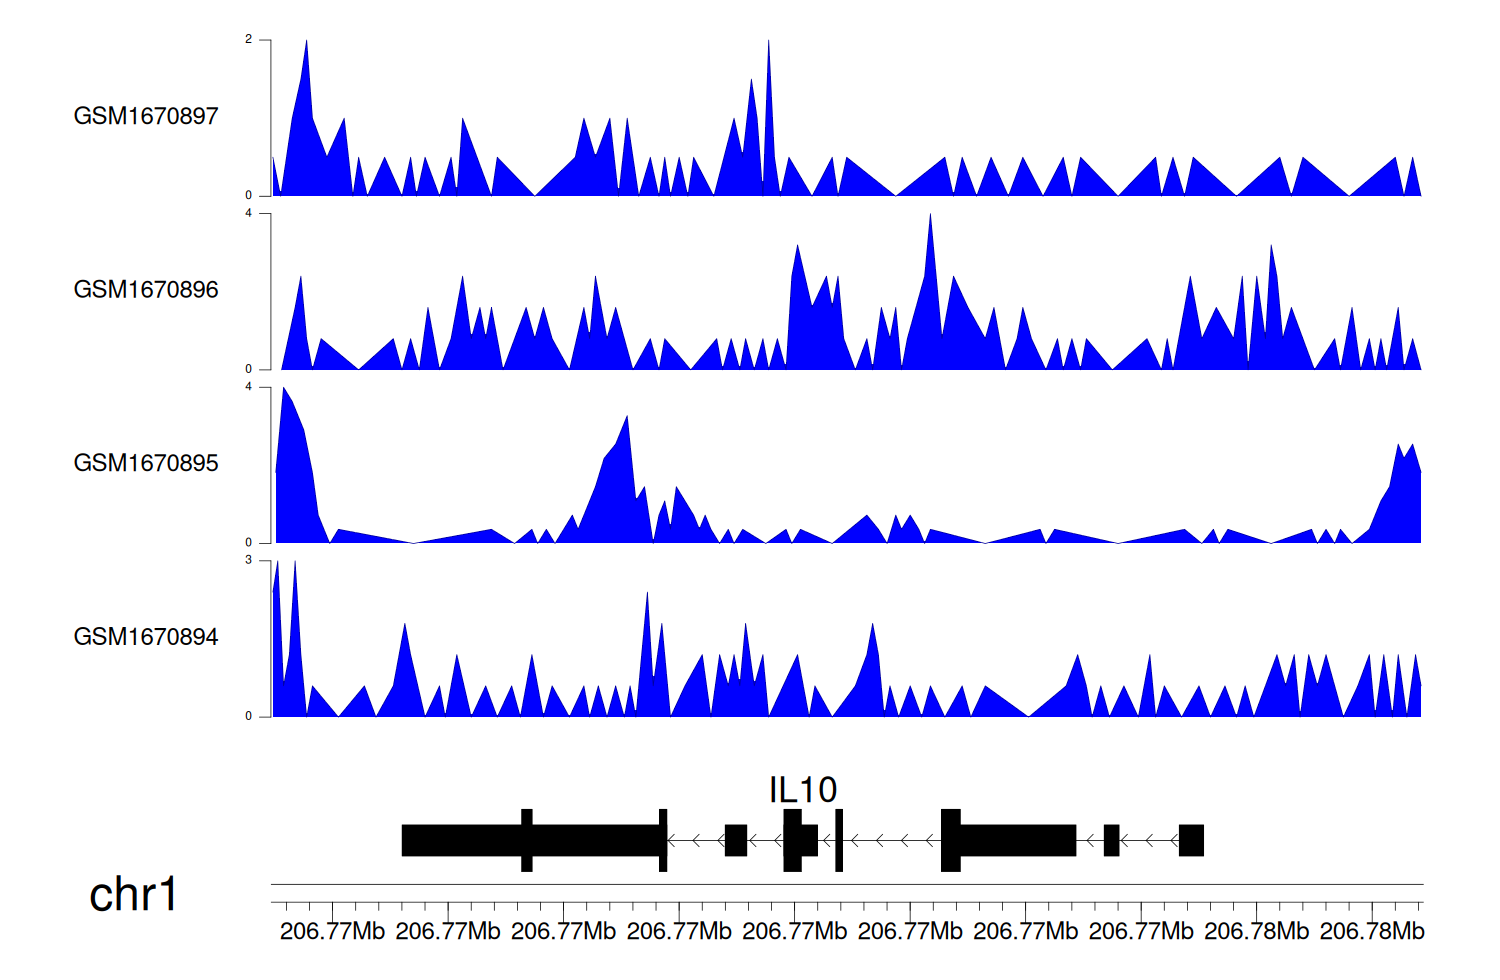
> Dataset: GSE68402 - IL10 peak across samples
|
Peak Plot
|
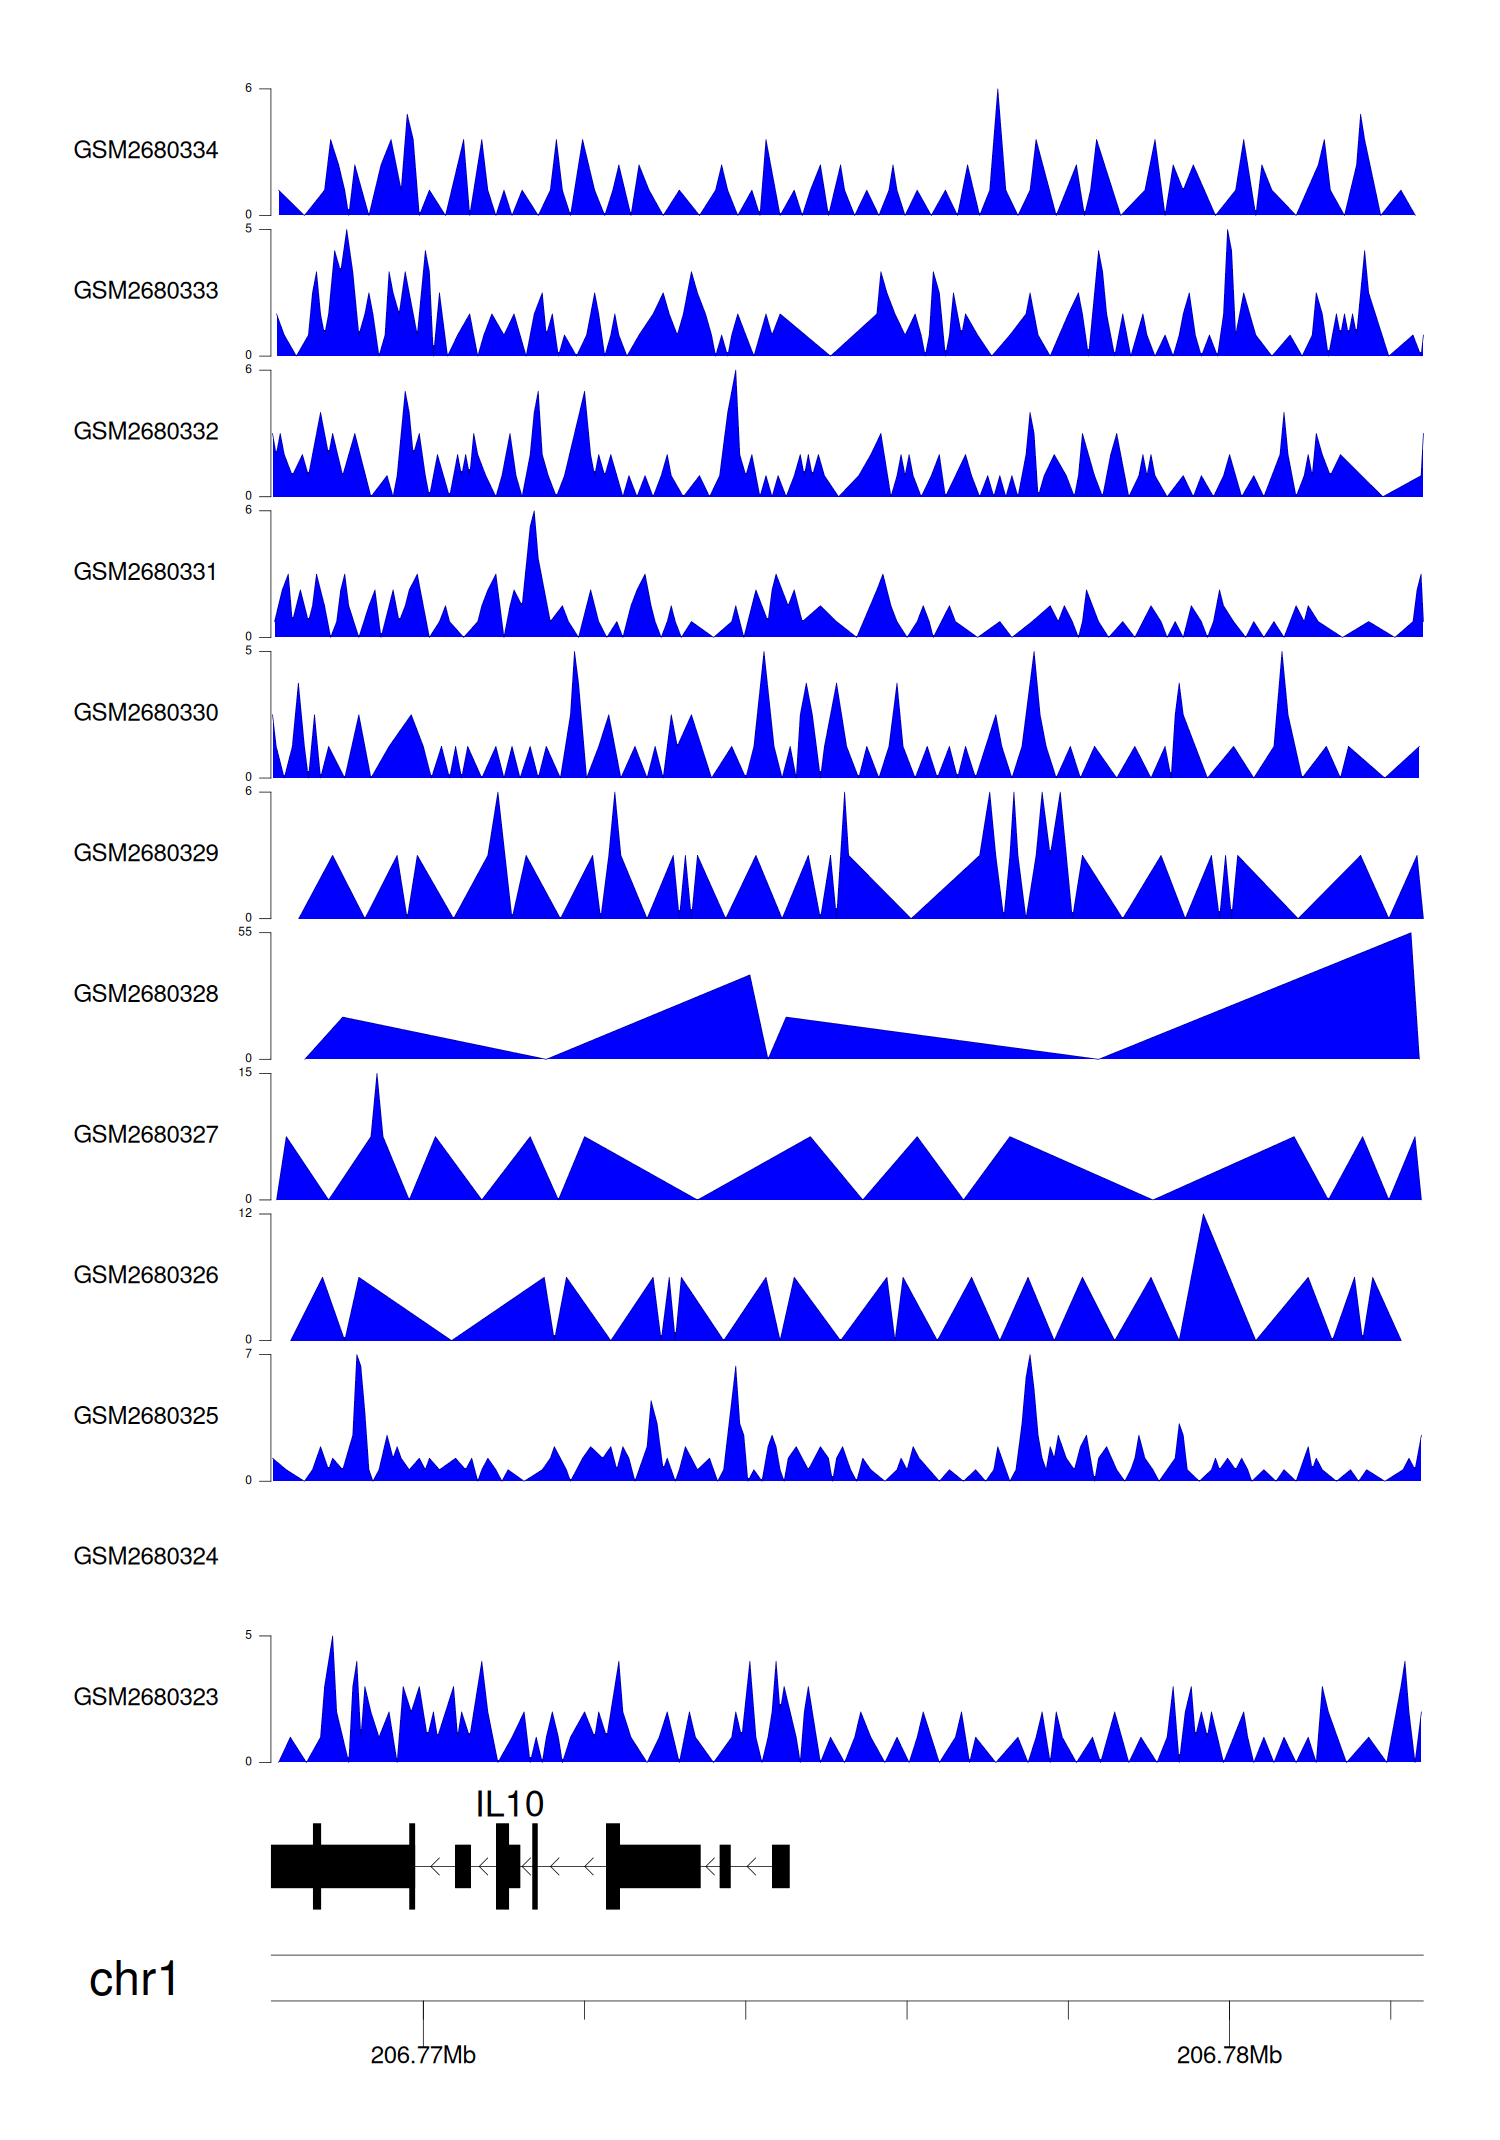
> Dataset: GSE100400 - IL10 peak across samples
|
Peak Plot
|
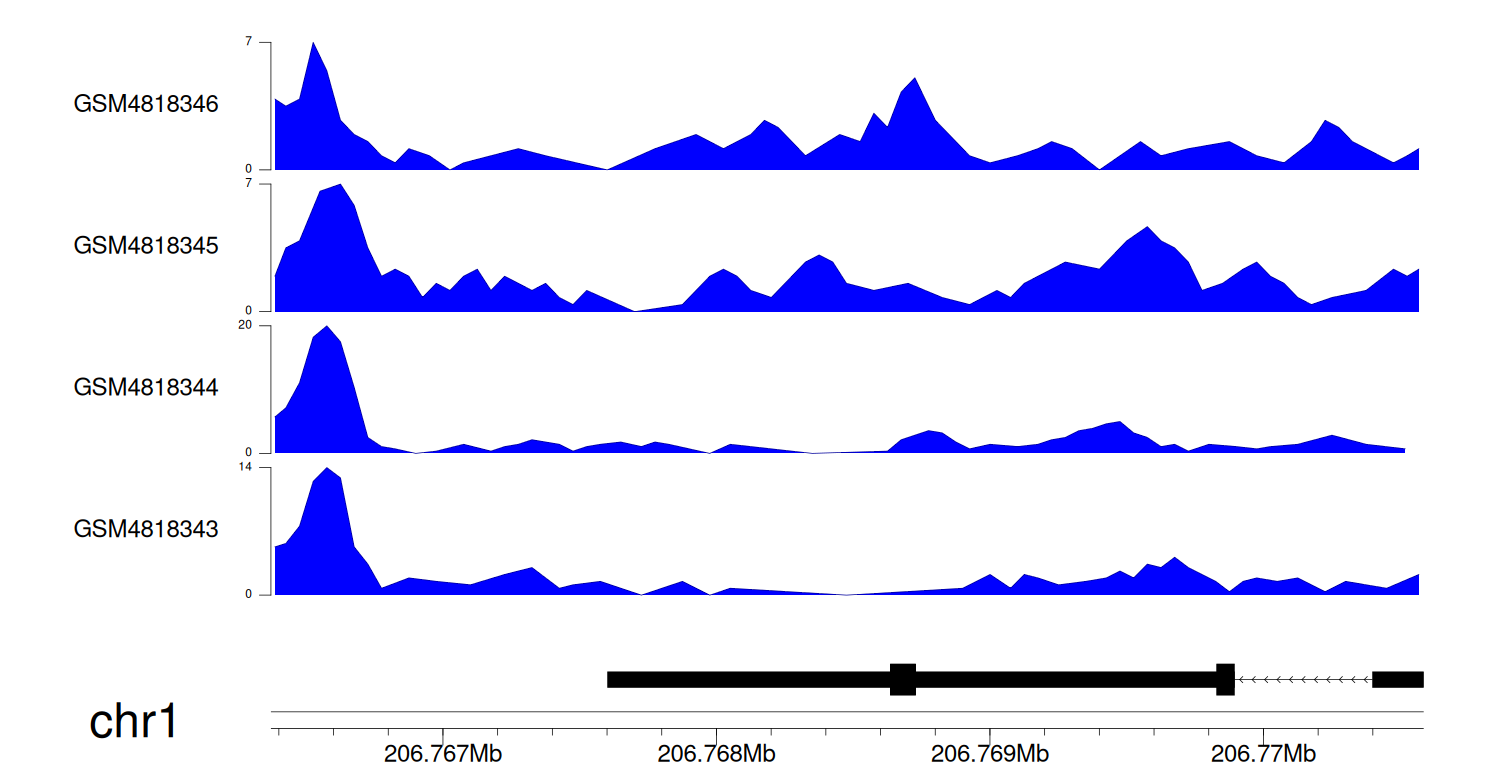
> Dataset: GSE131257 - IL10 peak across samples
|
Peak Plot
|
|
|
