Gene Information
|
Gene Name
|
PCDHGB3 |
|
Gene ID
|
56102
|
|
Gene Full Name
|
protocadherin gamma subfamily B, 3 |
|
Gene Alias
|
PCDH-GAMMA-B3 |
|
Transcripts
|
ENSG00000262209
|
|
Virus
|
HBV |
|
Gene Type
|
protein-coding |
|
HPA Location Info
|
Plasma membrane;Nucleoplasm, Vesicles, Cytosol; 
|
|
Membrane Info
|
Plasma proteins, Predicted membrane proteins |
|
Uniport_ID
|
Q9Y5G1
|
|
HGNC ID
|
HGNC:8710
|
|
OMIM ID
|
606301 |
|
Summary
|
This gene is a member of the protocadherin gamma gene cluster, one of three related clusters tandemly linked on chromosome five. These gene clusters have an immunoglobulin-like organization, suggesting that a novel mechanism may be involved in their regulation and expression. The gamma gene cluster includes 22 genes divided into 3 subfamilies. Subfamily A contains 12 genes, subfamily B contains 7 genes and 2 pseudogenes, and the more distantly related subfamily C contains 3 genes. The tandem array of 22 large, variable region exons are followed by a constant region, containing 3 exons shared by all genes in the cluster. Each variable region exon encodes the extracellular region, which includes 6 cadherin ectodomains and a transmembrane region. The constant region exons encode the common cytoplasmic region. These neural cadherin-like cell adhesion proteins most likely play a critical role in the establishment and function of specific cell-cell connections in the brain. Alternative splicing has been described for the gamma cluster genes. [provided by RefSeq, Jul 2008] |
Target gene [PCDHGB3] related to VISs 
Integration Table: if previous studies reported that target gene was altered by virus integration events, the overlap between VISs in this literature and Cistrome factors was listed in this section
| DVID |
Chromosome |
HM |
TFBS |
CA |
Sum of Overlapped Records |
Detail |
| 1004834 |
chr5 |
67 |
0 |
0 |
67 |
View |
| 1024406 |
chr5 |
97 |
477 |
333 |
907 |
View |
Target gene [PCDHGB3] related to Omics data
| Data ID |
Experiment type |
Sample number |
Platform |
|
GSE236281
|
RNA-seq |
12 |
Illumina MiSeq (Homo sapiens) |
|
C GSE35465
|
Chip-seq;RNA-seq |
6 |
Illumina HiSeq 2000 (Homo sapiens) |
|
TCGA_LIHC_HBV
|
DNA methylation sequencing;RNA-seq |
97 |
TCGA |
|
GSE224901
|
RNA-seq |
21 |
Illumina NovaSeq 6000 (Homo sapiens) |
|
E C GSE100400
|
Chip-seq;RNA-seq;4C_cccDNA |
31 |
Illumina NextSeq 500 (Homo sapiens);Illumina NextSeq 500 (Mus musculus) |
|
GSE173897
|
RNA-seq |
95 |
Illumina HiSeq 4000 (Homo sapiens) |
|
GSE262515
|
RNA-seq |
21 |
Illumina HiSeq 2500 (Homo sapiens);Illumina HiSeq 2500 (Mus musculus) |
|
GSE110345
|
RNA-seq |
4 |
Illumina HiSeq 2500 (Homo sapiens) |
|
GSE131257
|
ATAC-seq;RNA-seq |
19 |
Illumina HiSeq 2500 (Homo sapiens) |
|
GSE94660
|
RNA-seq |
42 |
Illumina HiSeq 2500 (Homo sapiens) |
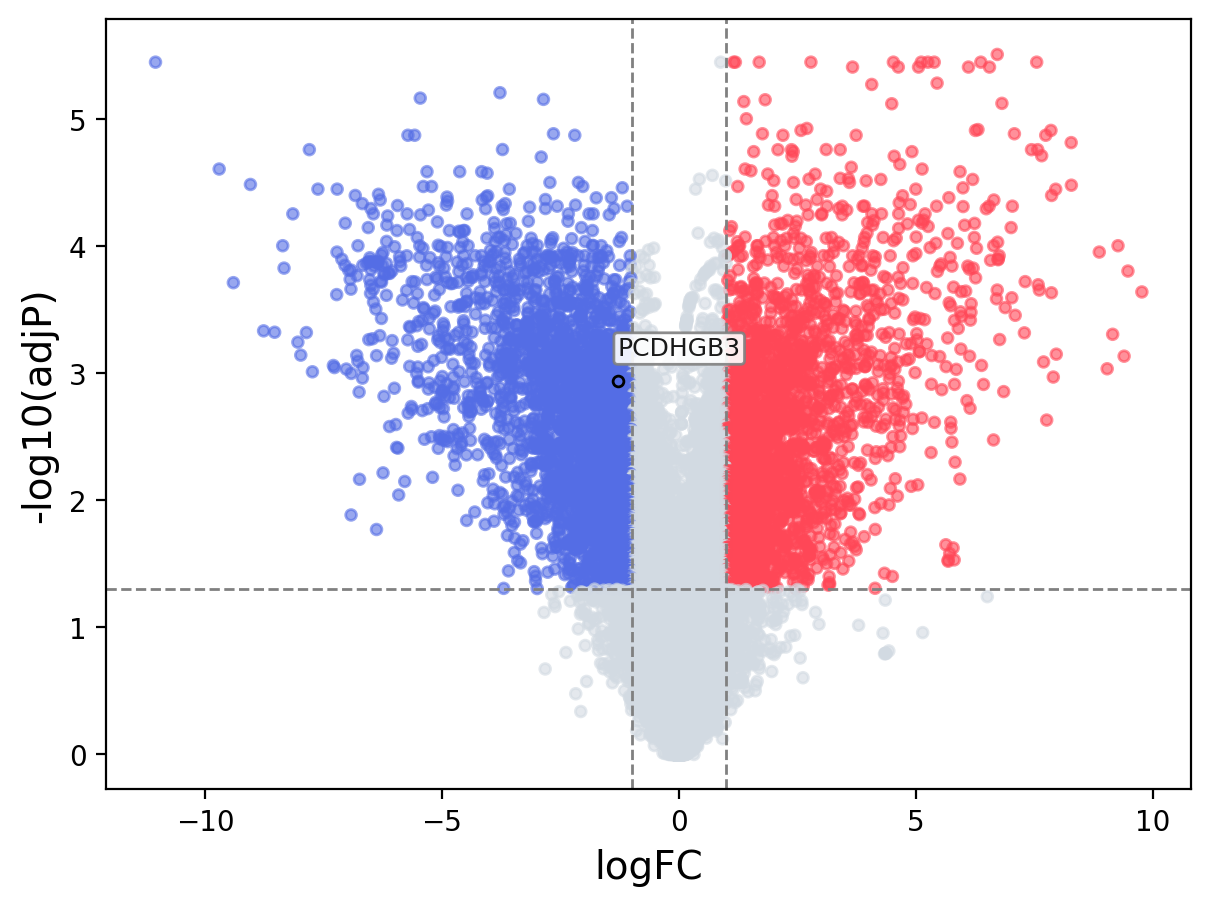
When the query gene is differentially changed in the dataset, a volcano/bar plot will be displayed.
> Dataset: GSE100400 - PCDHGB3 expression across samples
|
Volcano Plot
|
Bar Plot
|
|
|
