Gene Information
|
Gene Name
|
SCN7A |
|
Gene ID
|
6332
|
|
Gene Full Name
|
sodium voltage-gated channel alpha subunit 7 |
|
Gene Alias
|
NaG|Nav2.1|Nav2.2|SCN6A |
|
Transcripts
|
ENSG00000136546
|
|
Virus
|
HBV |
|
Gene Type
|
protein-coding |
|
HPA Location Info
|
Plasma membrane; 
|
|
Membrane Info
|
FDA approved drug targets, Plasma proteins, Predicted intracellular proteins, Predicted membrane proteins |
|
Uniport_ID
|
Q01118
|
|
HGNC ID
|
HGNC:10594
|
|
OMIM ID
|
182392 |
|
Summary
|
This gene encodes one of the many voltage-gated sodium channel proteins. For proper functioning of neurons and muscles during action potentials, voltage-gated sodium channels direct sodium ion diffusion for membrane depolarization. This sodium channel protein has some atypical characteristics; the similarity between the human and mouse proteins is lower compared to other orthologous sodium channel pairs. Also, the S4 segments, which sense voltage changes, have fewer positive charged residues that in other sodium channels; domain 4 has fewer arginine and lysine residues compared to other sodium channel proteins. Several alternatively spliced transcript variants exist, but the full-length natures of all of them remain unknown. [provided by RefSeq, Dec 2011] |
Target gene [SCN7A] related to VISs 
Integration Table: if previous studies reported that target gene was altered by virus integration events, the overlap between VISs in this literature and Cistrome factors was listed in this section
| DVID |
Chromosome |
HM |
TFBS |
CA |
Sum of Overlapped Records |
Detail |
| 1012926 |
chr2 |
3 |
3 |
0 |
6 |
View |
Target gene [SCN7A] related to Omics data
| Data ID |
Experiment type |
Sample number |
Platform |
|
GSE236281
|
RNA-seq |
12 |
Illumina MiSeq (Homo sapiens) |
|
C GSE68402
|
Chip-seq |
26 |
Illumina MiSeq (Homo sapiens);Illumina HiSeq 2500 (Homo sapiens) |
|
TCGA_LIHC_HBV
|
DNA methylation sequencing;RNA-seq |
97 |
TCGA |
|
GSE224901
|
RNA-seq |
21 |
Illumina NovaSeq 6000 (Homo sapiens) |
|
C GSE100400
|
Chip-seq;RNA-seq;4C_cccDNA |
31 |
Illumina NextSeq 500 (Homo sapiens);Illumina NextSeq 500 (Mus musculus) |
|
GSE173897
|
RNA-seq |
95 |
Illumina HiSeq 4000 (Homo sapiens) |
|
GSE262515
|
RNA-seq |
21 |
Illumina HiSeq 2500 (Homo sapiens);Illumina HiSeq 2500 (Mus musculus) |
|
GSE110345
|
RNA-seq |
4 |
Illumina HiSeq 2500 (Homo sapiens) |
|
C GSE131257
|
ATAC-seq;RNA-seq |
19 |
Illumina HiSeq 2500 (Homo sapiens) |
|
GSE94660
|
RNA-seq |
42 |
Illumina HiSeq 2500 (Homo sapiens) |
When the gene can detect a peak in the dataset, a peak plot will be displayed.
> Dataset: GSE68402 - SCN7A peak across samples
|
Peak Plot
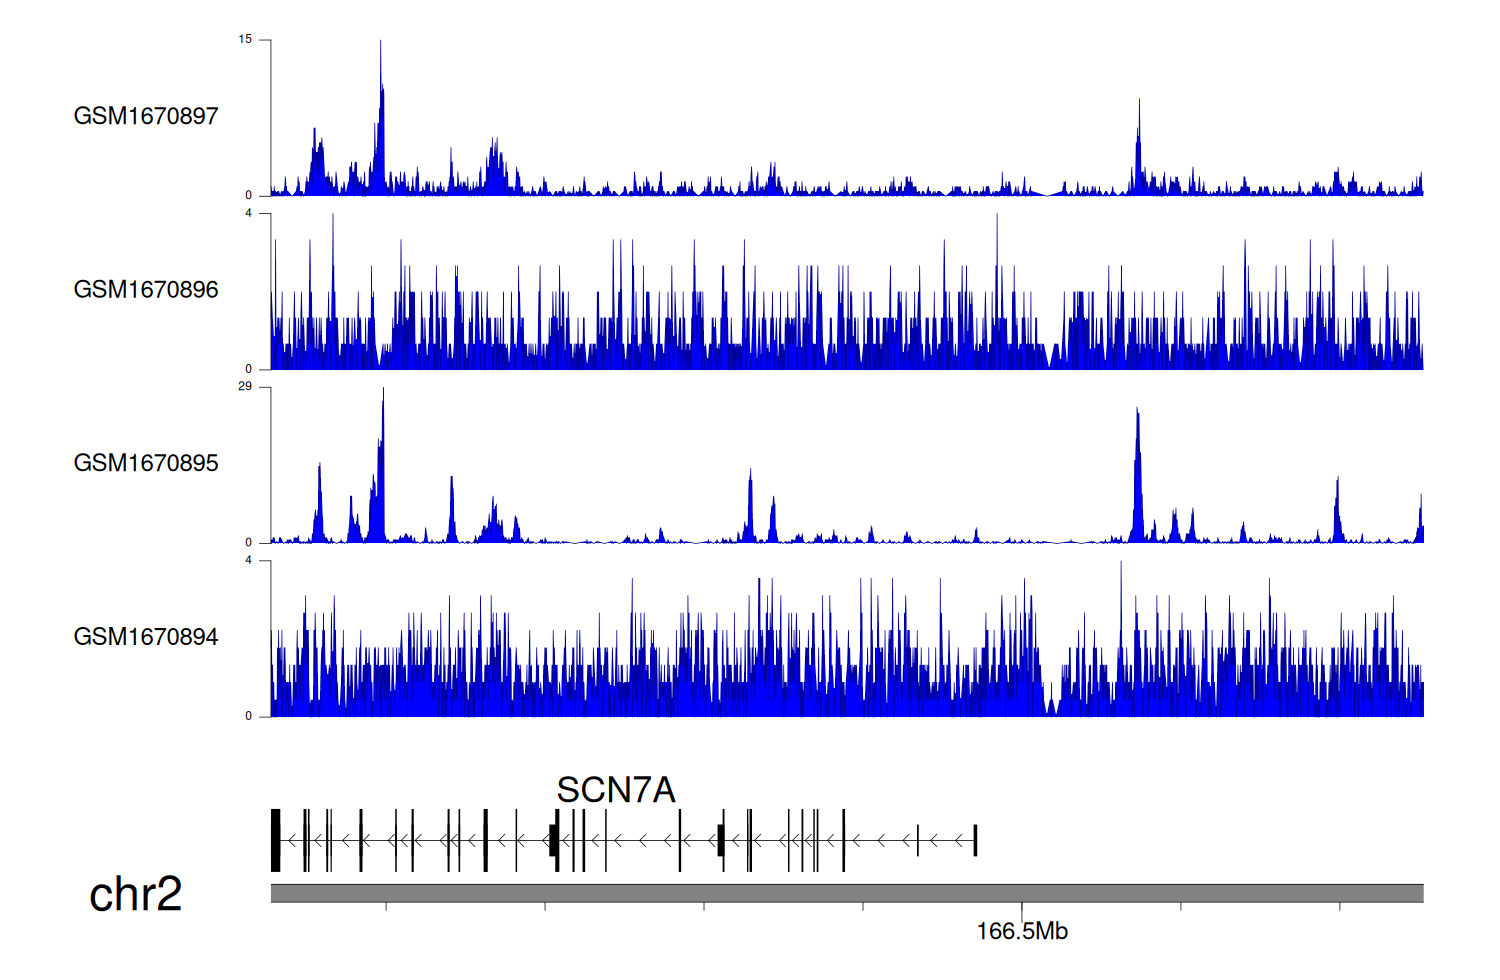
|
> Dataset: GSE100400 - SCN7A peak across samples
|
Peak Plot
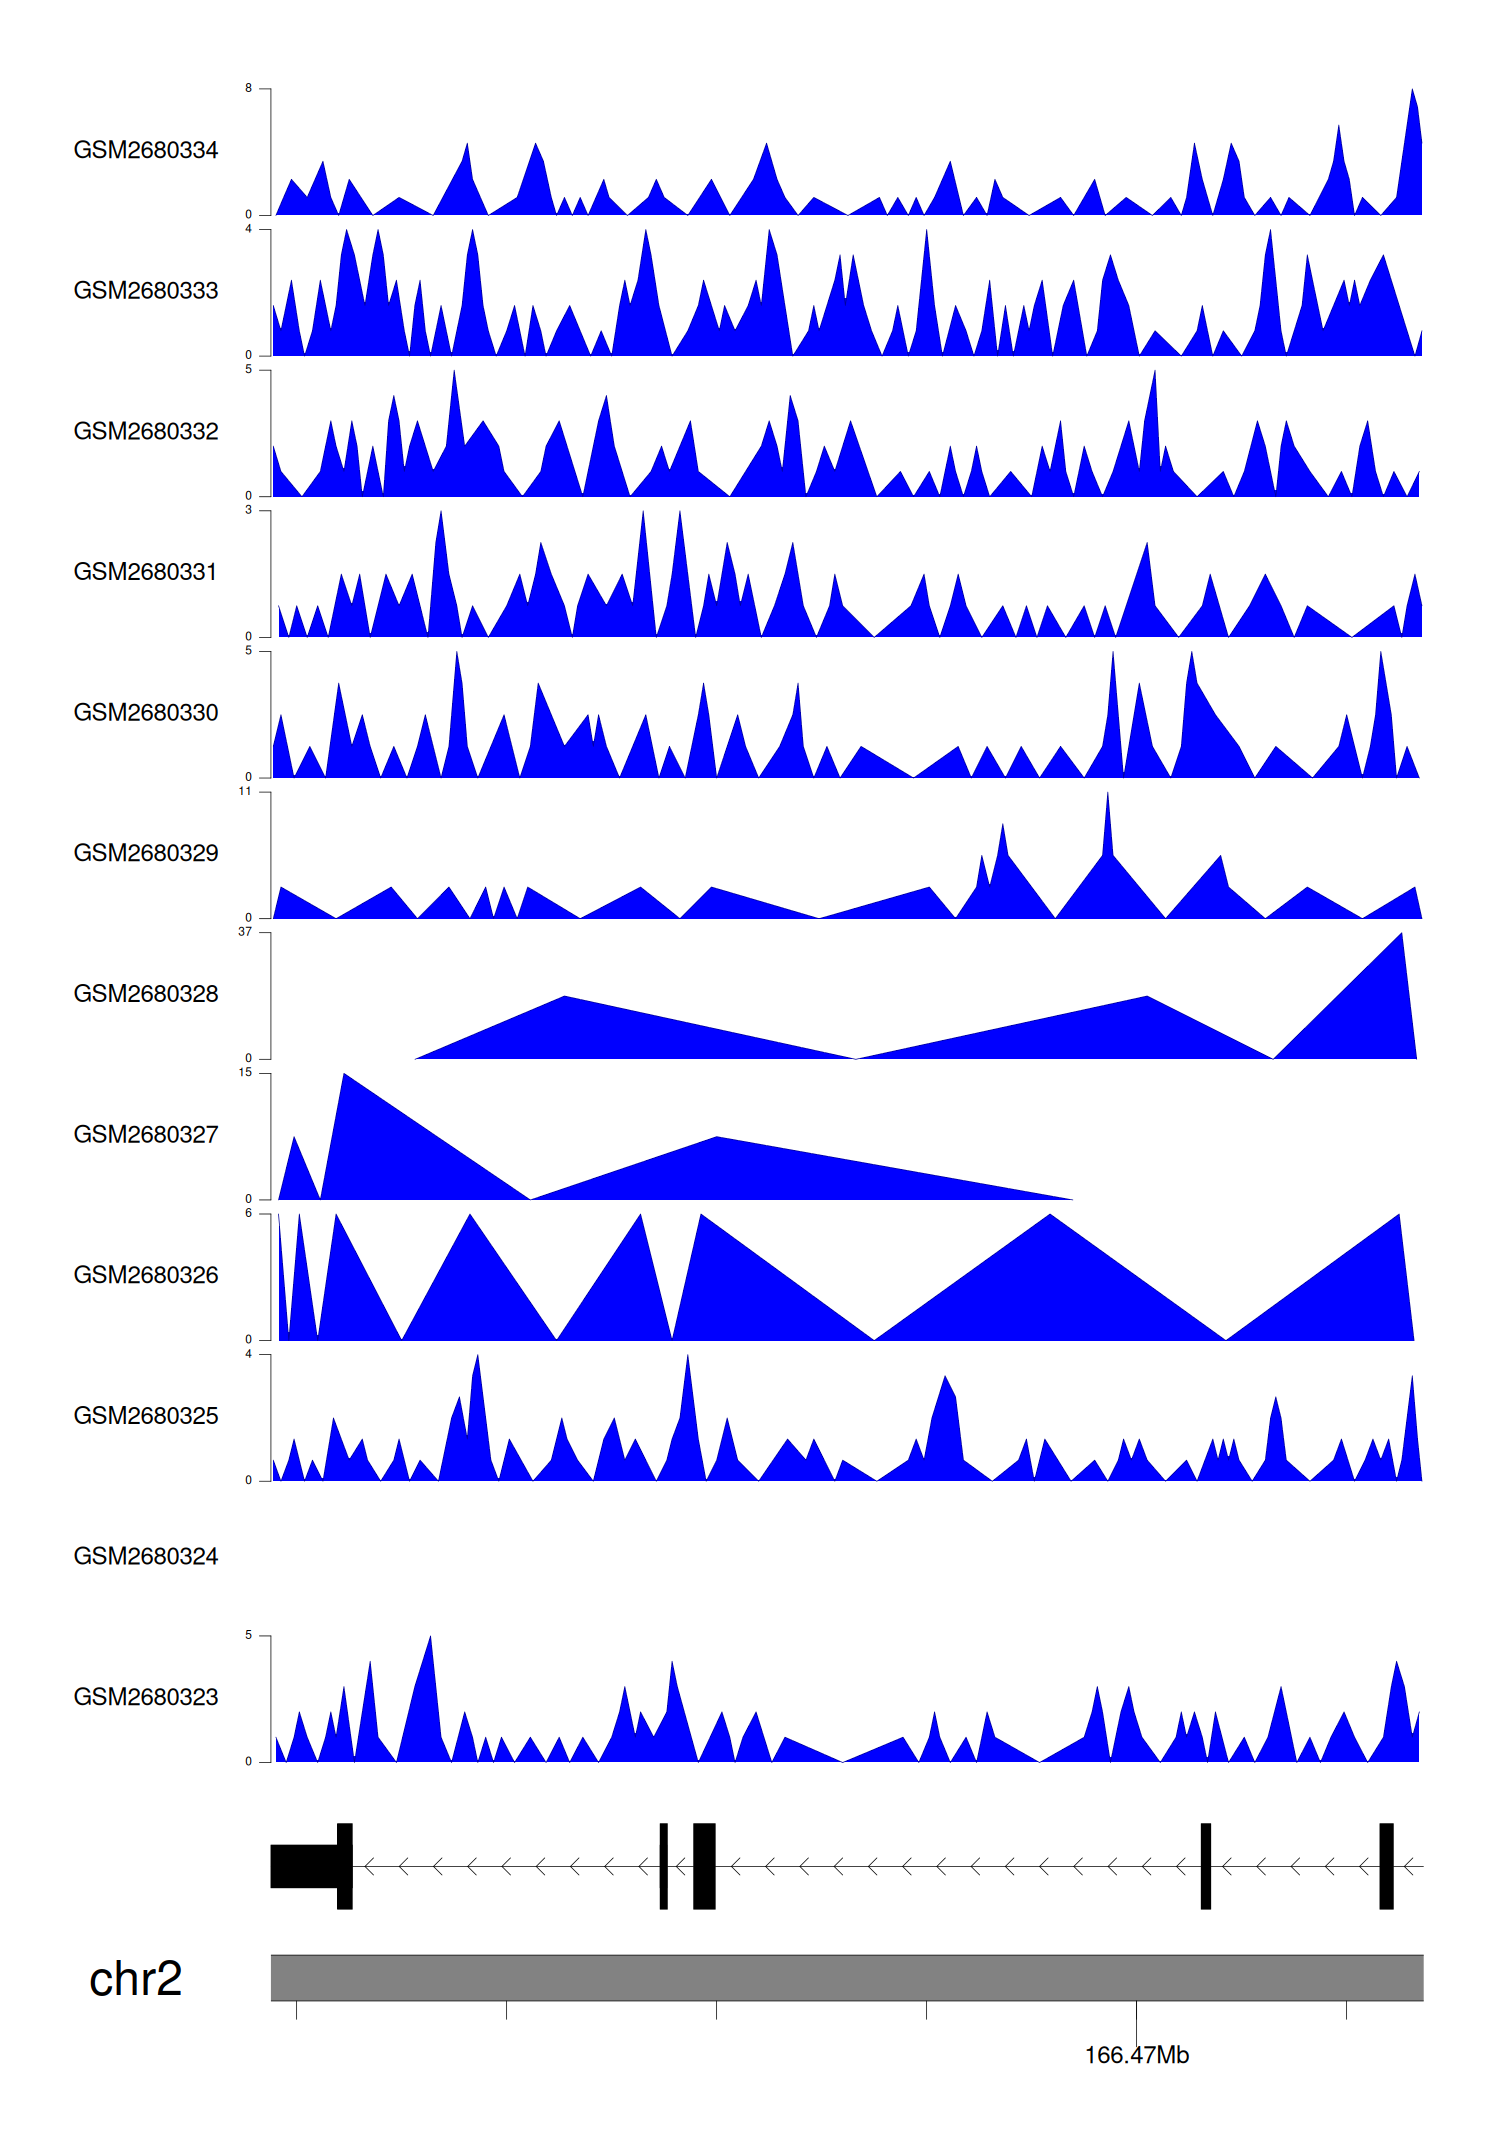
|
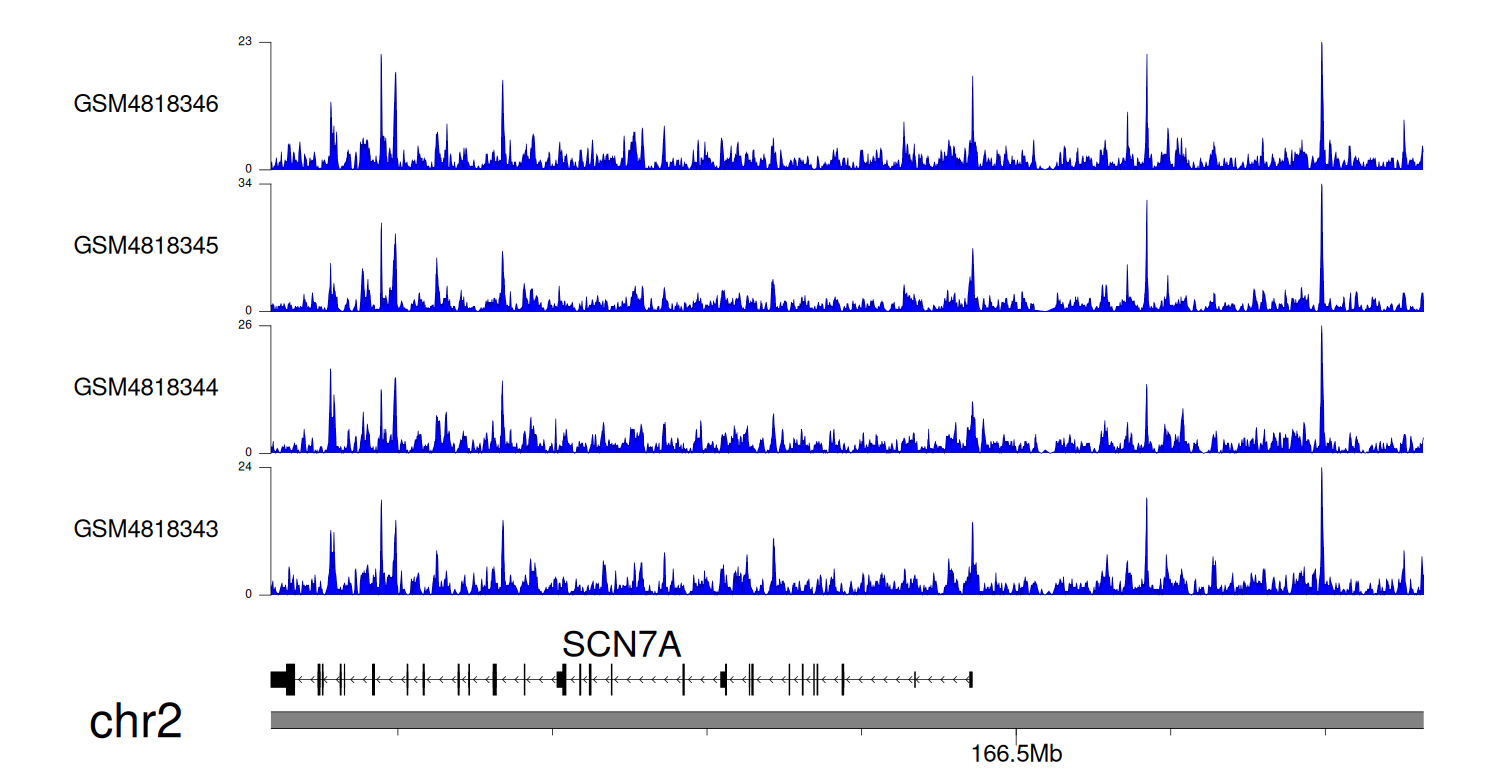
> Dataset: GSE131257 - SCN7A peak across samples
|
Peak Plot
|
|
|
