Gene Information
|
Gene Name
|
ABCC2 |
|
Gene ID
|
1244
|
|
Gene Full Name
|
ATP binding cassette subfamily C member 2 |
|
Gene Alias
|
ABC30|CMOAT|DJS|MRP2|cMRP |
|
Transcripts
|
ENSG00000023839
|
|
Virus
|
HBV |
|
Gene Type
|
protein-coding |
|
HPA Location Info
|

|
|
Membrane Info
|
Cancer-related genes, Disease related genes, Enzymes, FDA approved drug targets, Human disease related genes, Metabolic proteins, Plasma proteins, Predicted membrane proteins, Transporters |
|
Uniport_ID
|
Q92887
|
|
HGNC ID
|
HGNC:53
|
|
OMIM ID
|
601107 |
|
Summary
|
The protein encoded by this gene is a member of the superfamily of ATP-binding cassette (ABC) transporters. ABC proteins transport various molecules across extra- and intra-cellular membranes. ABC genes are divided into seven distinct subfamilies (ABC1, MDR/TAP, MRP, ALD, OABP, GCN20, White). This protein is a member of the MRP subfamily which is involved in multi-drug resistance. This protein is expressed in the canalicular (apical) part of the hepatocyte and functions in biliary transport. Substrates include anticancer drugs such as vinblastine; therefore, this protein appears to contribute to drug resistance in mammalian cells. Several different mutations in this gene have been observed in patients with Dubin-Johnson syndrome (DJS), an autosomal recessive disorder characterized by conjugated hyperbilirubinemia. [provided by RefSeq, Jul 2008] |
Target gene [ABCC2] related to VISs 
Integration Table: if previous studies reported that target gene was altered by virus integration events, the overlap between VISs in this literature and Cistrome factors was listed in this section
| DVID |
Chromosome |
HM |
TFBS |
CA |
Sum of Overlapped Records |
Detail |
| 1002550 |
chr10 |
25 |
113 |
110 |
248 |
View |
| 1015122 |
chr10 |
2 |
1 |
0 |
3 |
View |
Target gene [ABCC2] related to Omics data
| Data ID |
Experiment type |
Sample number |
Platform |
|
GSE236281
|
RNA-seq |
12 |
Illumina MiSeq (Homo sapiens) |
|
C GSE35465
|
Chip-seq;RNA-seq |
6 |
Illumina HiSeq 2000 (Homo sapiens) |
|
GSE199850
|
scRNA-seq |
1 |
HiSeq X Ten (Homo sapiens) |
|
C GSE68402
|
Chip-seq |
26 |
Illumina MiSeq (Homo sapiens);Illumina HiSeq 2500 (Homo sapiens) |
|
TCGA_LIHC_HBV
|
DNA methylation sequencing;RNA-seq |
97 |
TCGA |
|
C GSE270130
|
Chip-seq |
27 |
Illumina NovaSeq 6000 (Homo sapiens) |
|
GSE224901
|
RNA-seq |
21 |
Illumina NovaSeq 6000 (Homo sapiens) |
|
C GSE100400
|
Chip-seq;RNA-seq;4C_cccDNA |
31 |
Illumina NextSeq 500 (Homo sapiens);Illumina NextSeq 500 (Mus musculus) |
|
GSE173897
|
RNA-seq |
95 |
Illumina HiSeq 4000 (Homo sapiens) |
|
GSE262515
|
RNA-seq |
21 |
Illumina HiSeq 2500 (Homo sapiens);Illumina HiSeq 2500 (Mus musculus) |
|
GSE110345
|
RNA-seq |
4 |
Illumina HiSeq 2500 (Homo sapiens) |
|
C GSE131257
|
ATAC-seq;RNA-seq |
19 |
Illumina HiSeq 2500 (Homo sapiens) |
|
GSE94660
|
RNA-seq |
42 |
Illumina HiSeq 2500 (Homo sapiens) |
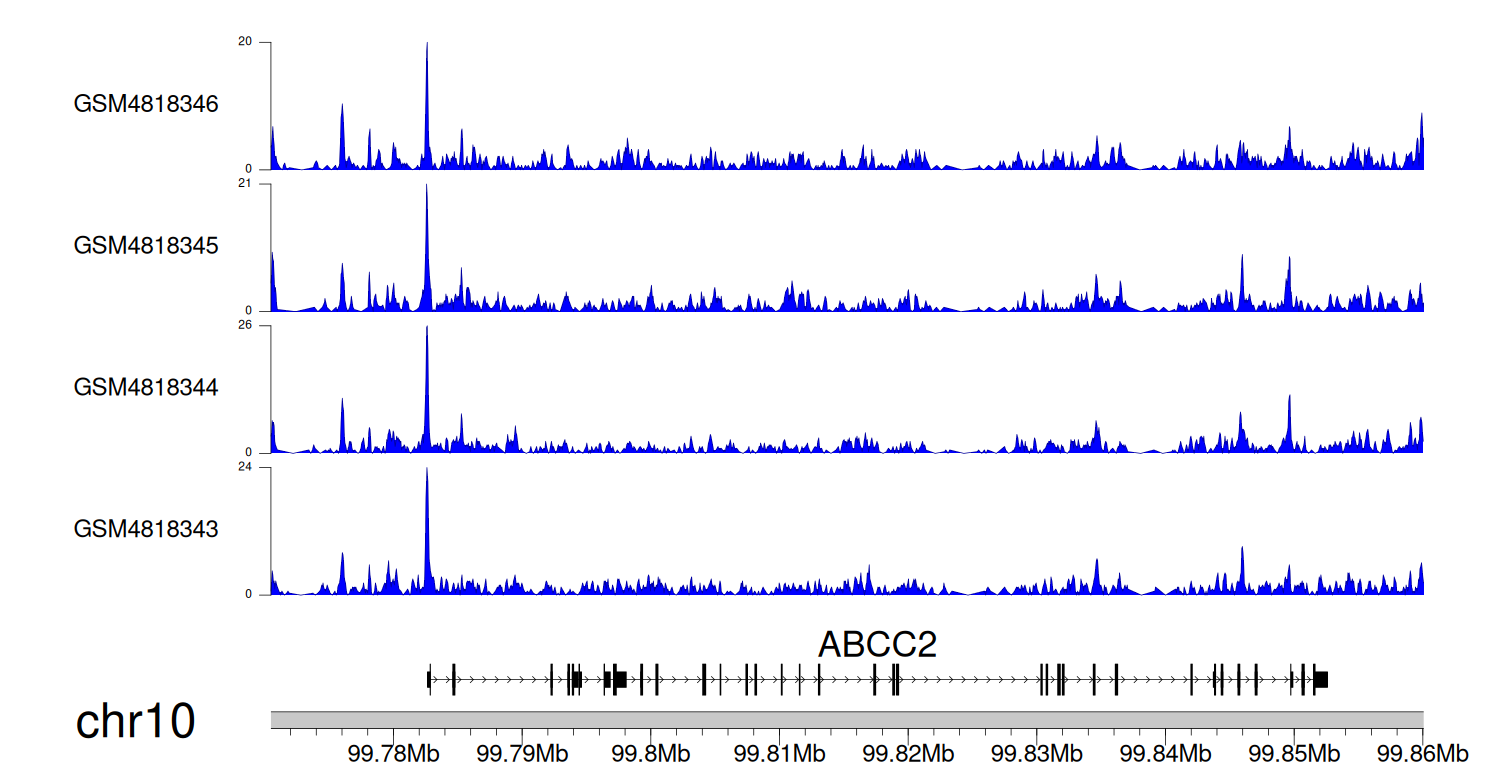
When the gene can detect a peak in the dataset, a peak plot will be displayed.
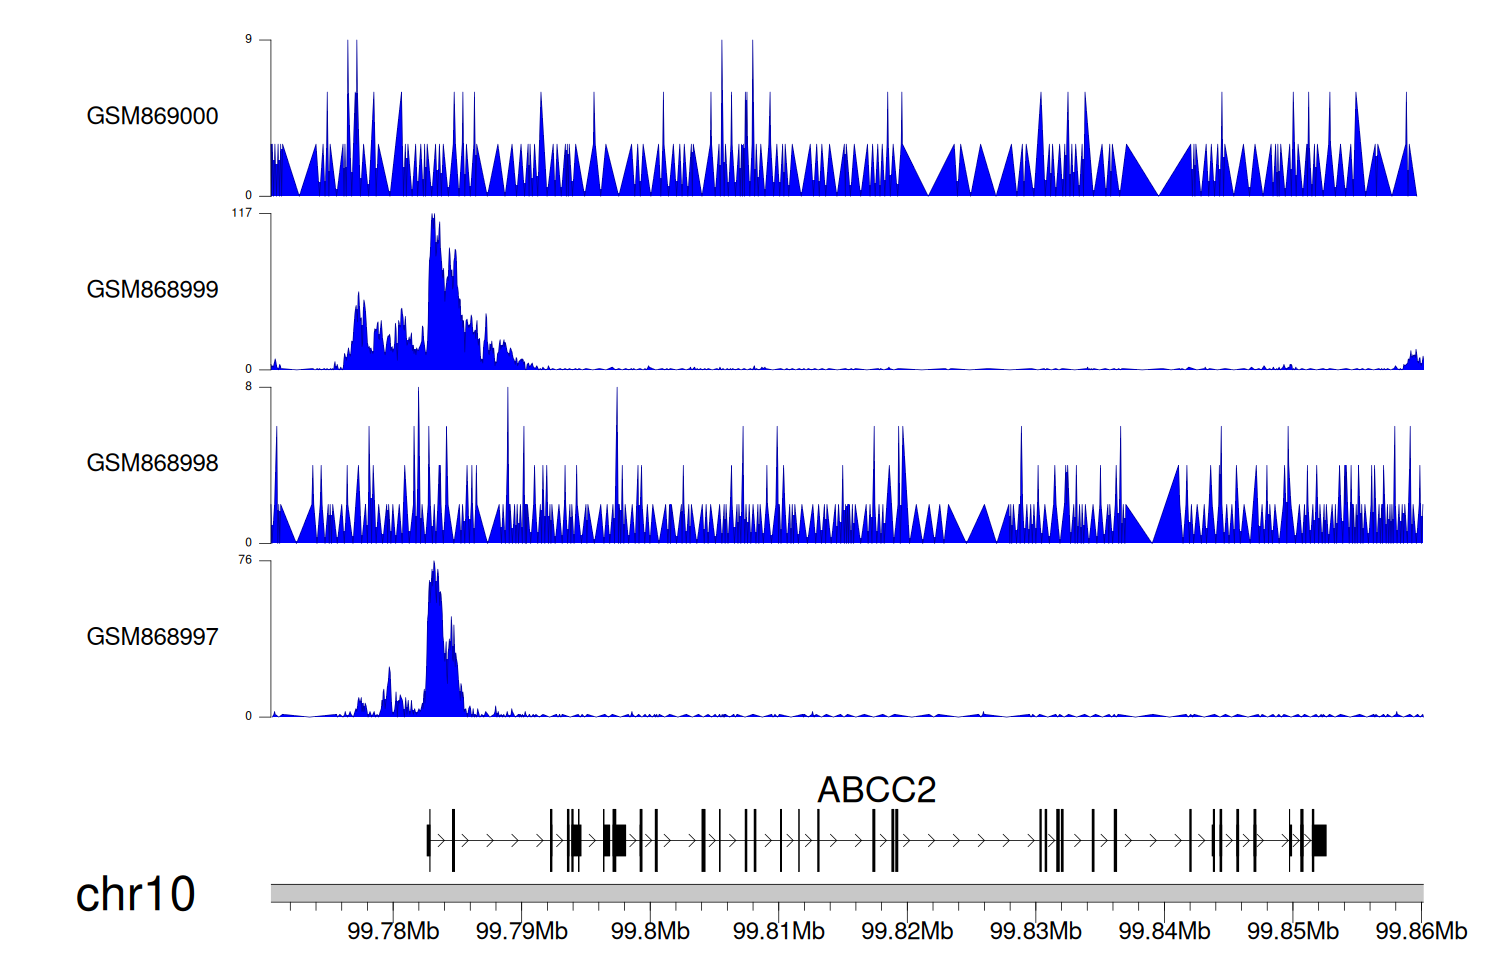
> Dataset: GSE35465 - ABCC2 peak across samples
|
Peak Plot
|
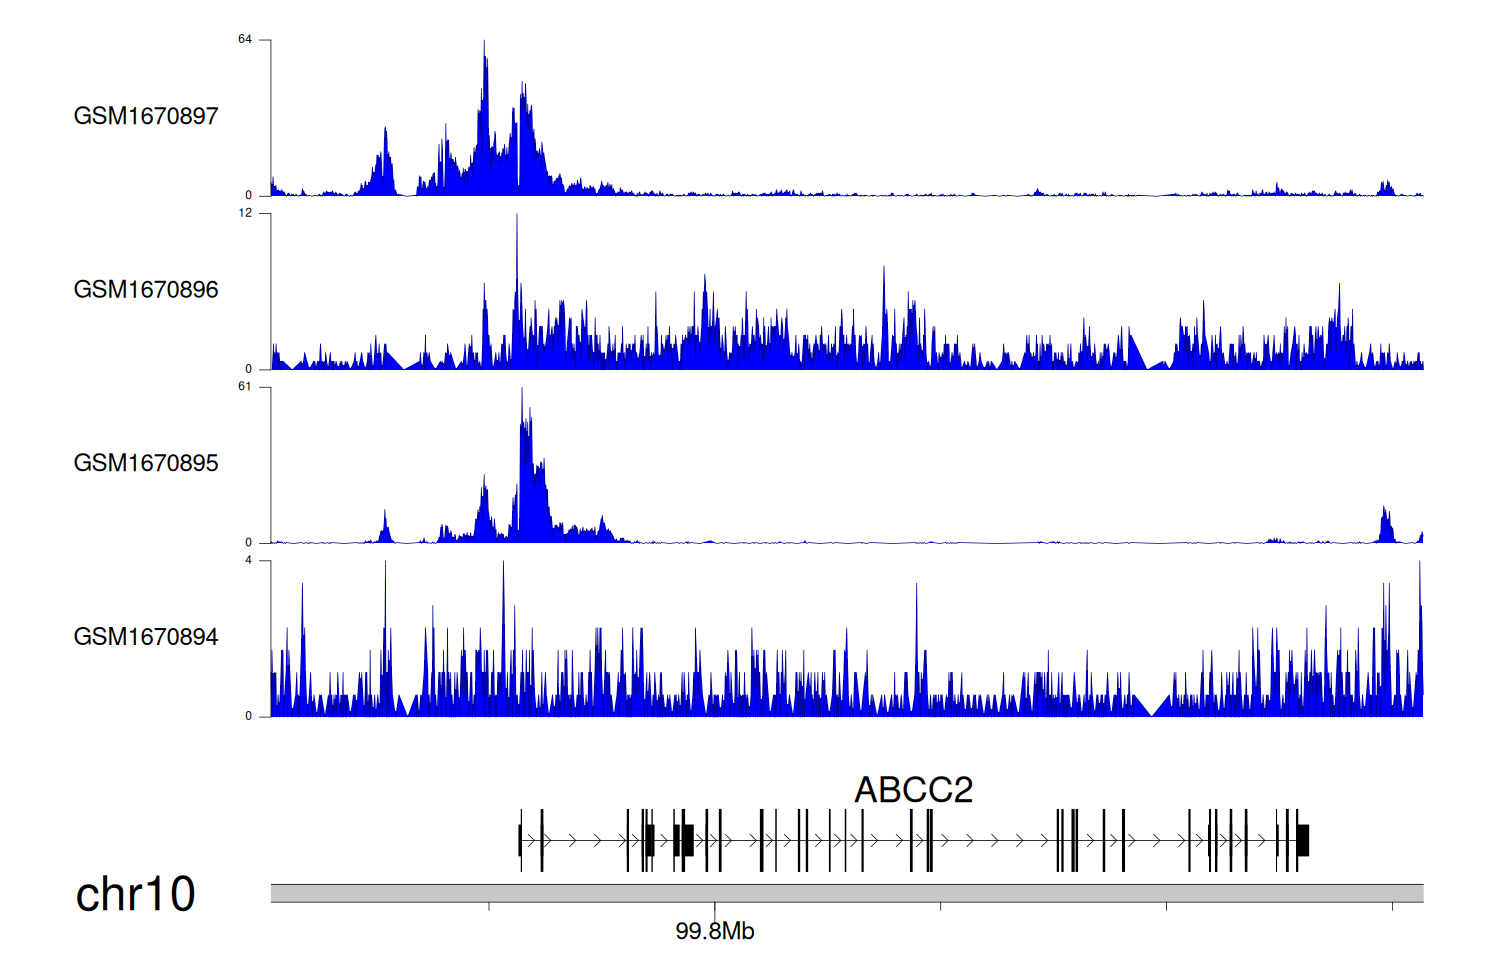
> Dataset: GSE68402 - ABCC2 peak across samples
|
Peak Plot
|
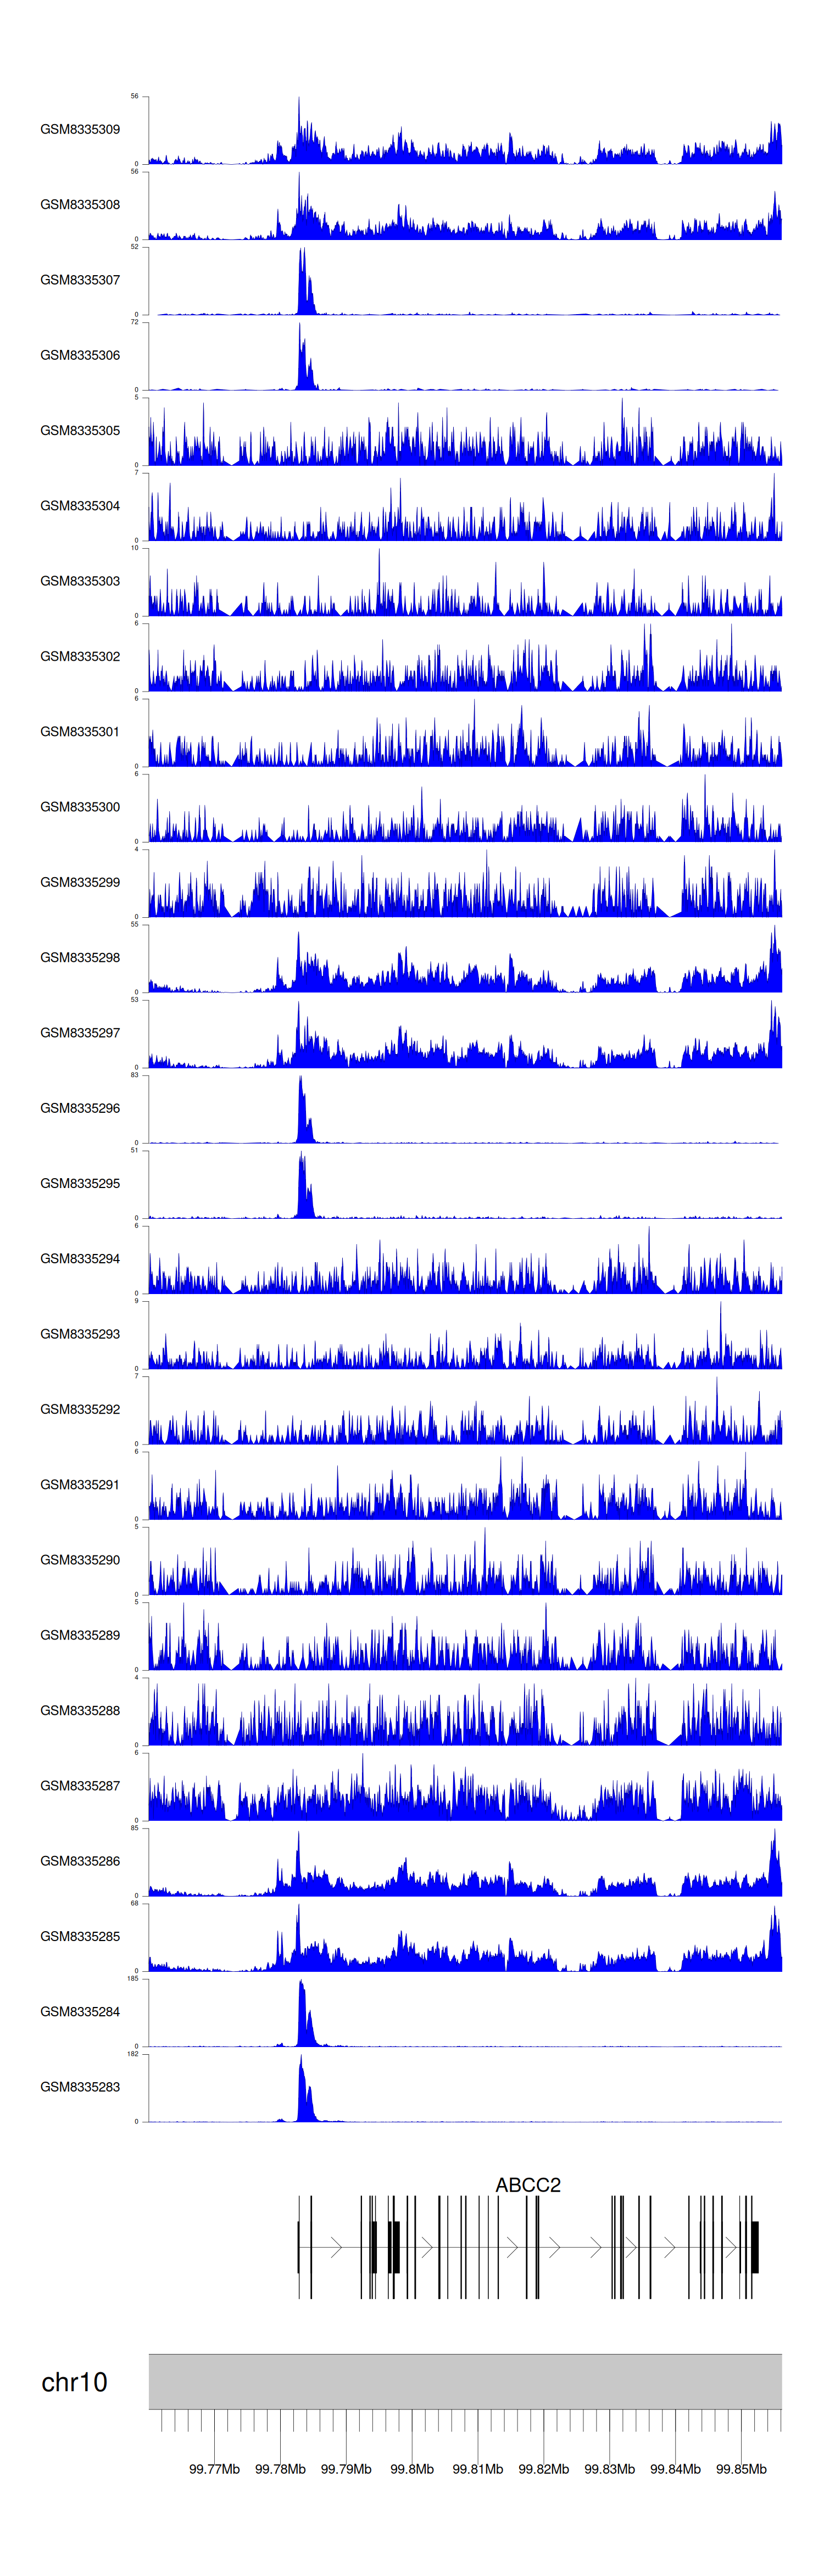
> Dataset: GSE270130 - ABCC2 peak across samples
|
Peak Plot
|
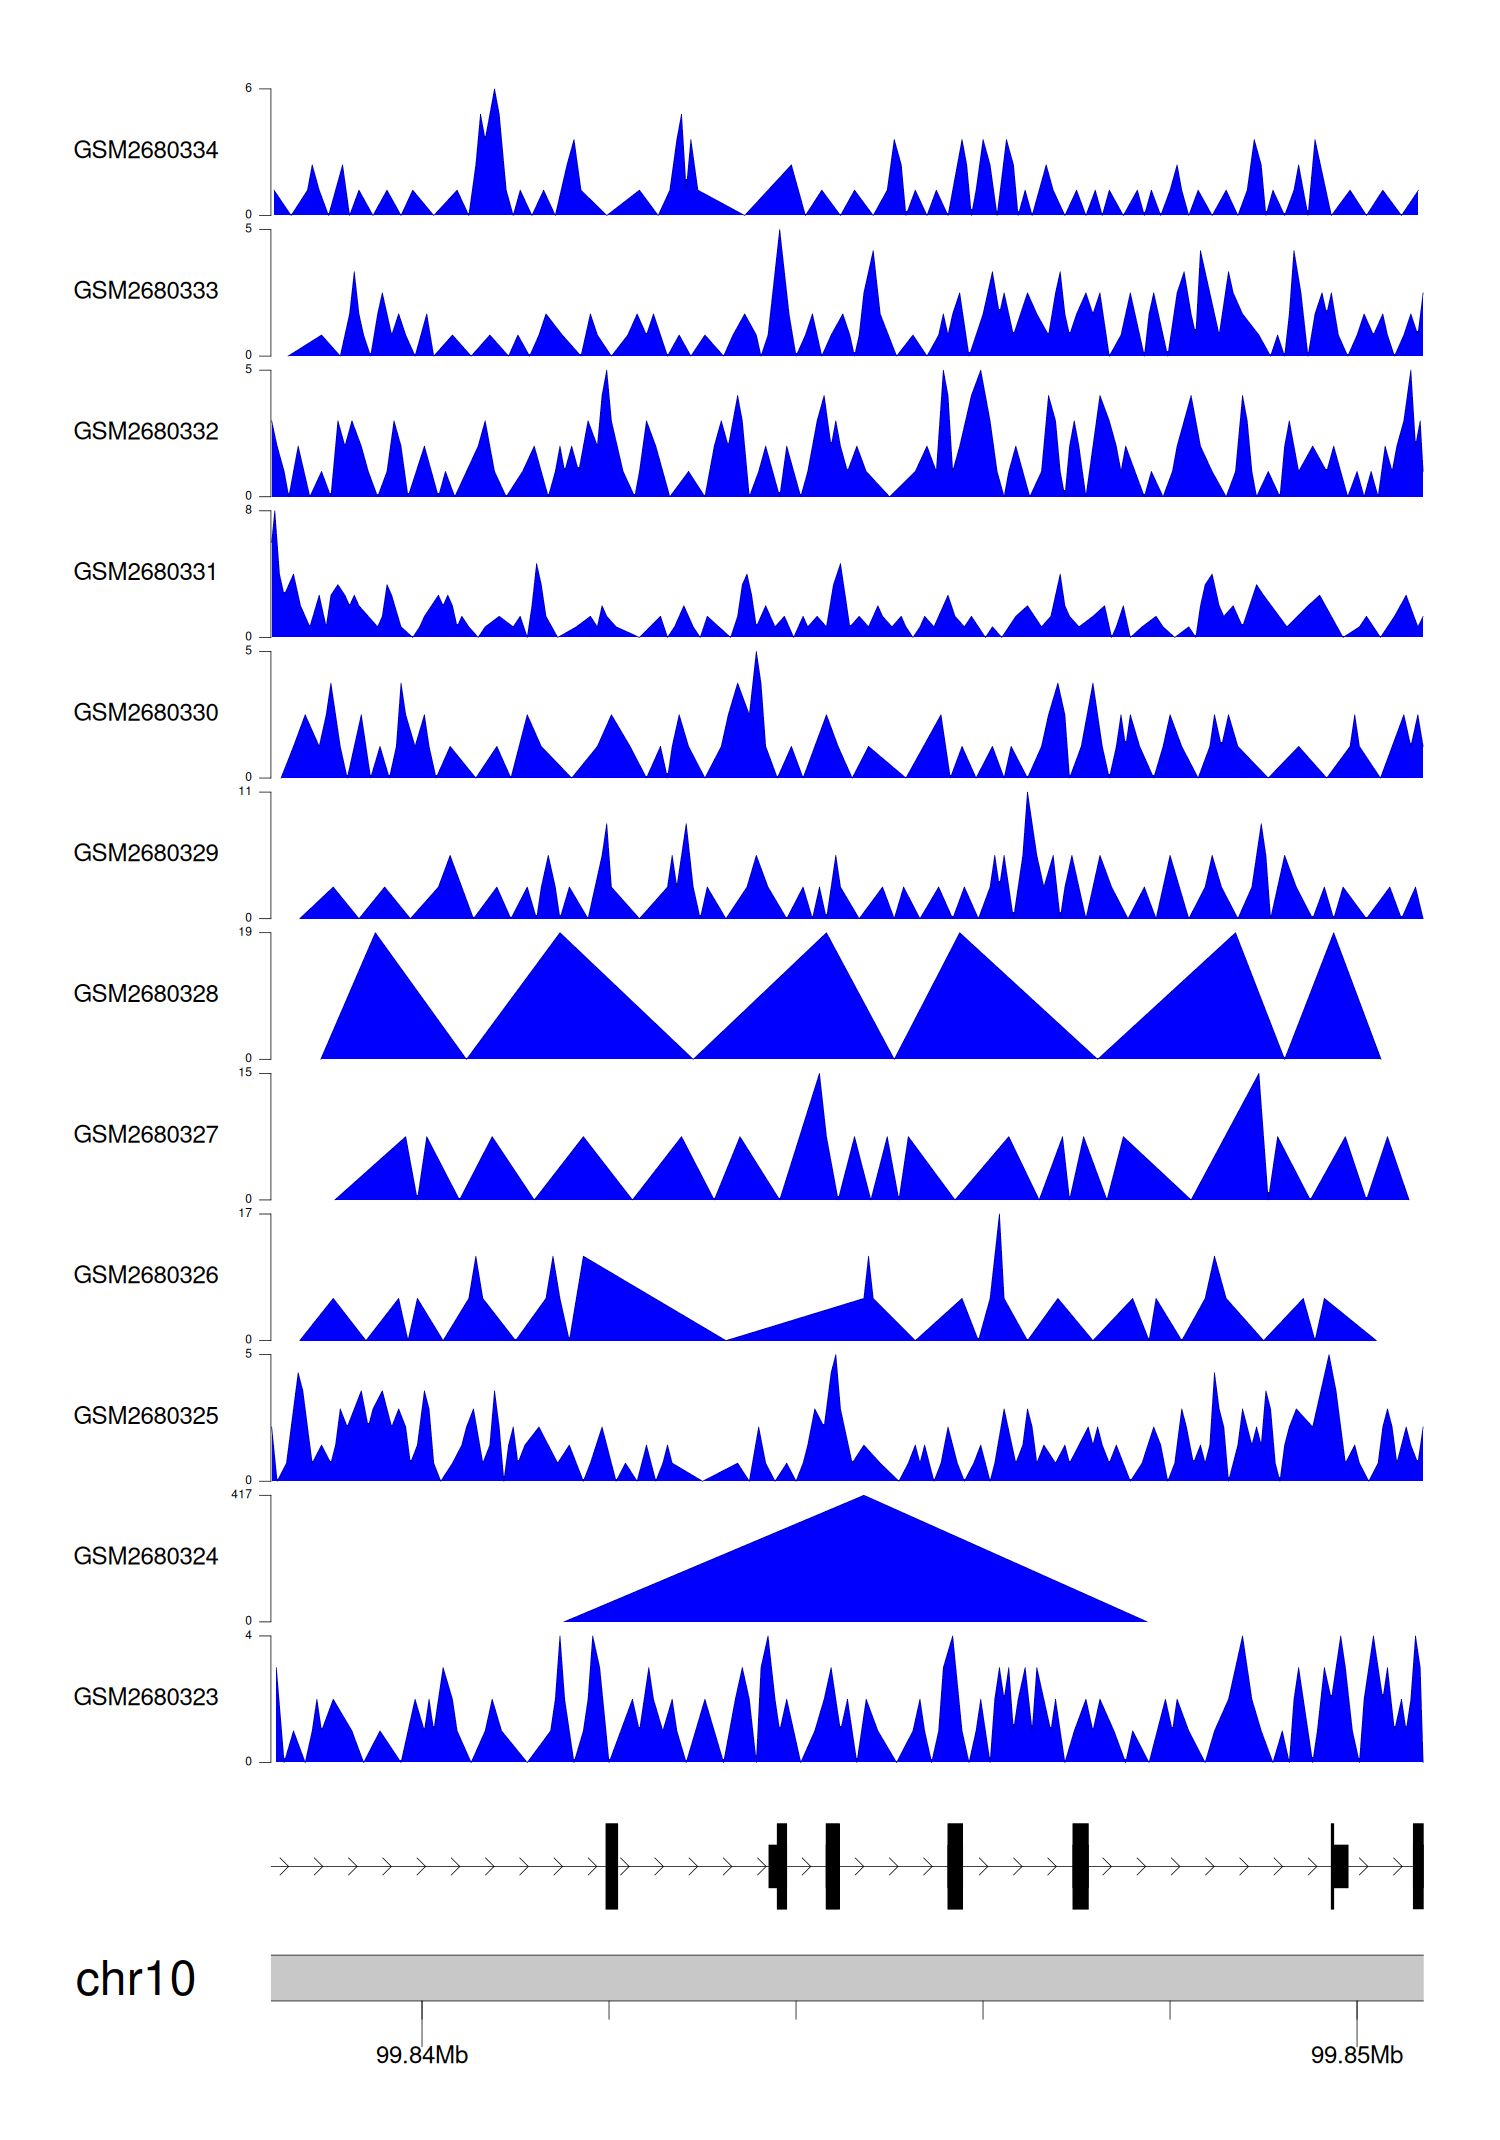
> Dataset: GSE100400 - ABCC2 peak across samples
|
Peak Plot
|
> Dataset: GSE131257 - ABCC2 peak across samples
|
Peak Plot
|
|
|
