Gene Information
|
Gene Name
|
ABCD3 |
|
Gene ID
|
5825
|
|
Gene Full Name
|
ATP binding cassette subfamily D member 3 |
|
Gene Alias
|
ABC43|CBAS5|PMP70|PXMP1|ZWS2 |
|
Transcripts
|
ENSG00000117528
|
|
Virus
|
HBV |
|
Gene Type
|
protein-coding |
|
HPA Location Info
|
Peroxisomes; 
|
|
Membrane Info
|
Disease related genes, Human disease related genes, Metabolic proteins, Potential drug targets, Predicted membrane proteins, Transporters |
|
Uniport_ID
|
P28288
|
|
HGNC ID
|
HGNC:67
|
|
OMIM ID
|
170995 |
|
Summary
|
The protein encoded by this gene is a member of the superfamily of ATP-binding cassette (ABC) transporters. ABC proteins transport various molecules across extra- and intra-cellular membranes. ABC genes are divided into seven distinct subfamilies (ABC1, MDR/TAP, MRP, ALD, OABP, GCN20, White). This protein is a member of the ALD subfamily, which is involved in peroxisomal import of fatty acids and/or fatty acyl-CoAs in the organelle. All known peroxisomal ABC transporters are half transporters which require a partner half transporter molecule to form a functional homodimeric or heterodimeric transporter. This peroxisomal membrane protein likely plays an important role in peroxisome biogenesis. Mutations have been associated with some forms of Zellweger syndrome, a heterogeneous group of peroxisome assembly disorders. Alternative splicing results in multiple transcript variants encoding distinct isoforms. [provided by RefSeq, Jul 2008] |
Target gene [ABCD3] related to VISs 
Integration Table: if previous studies reported that target gene was altered by virus integration events, the overlap between VISs in this literature and Cistrome factors was listed in this section
| DVID |
Chromosome |
HM |
TFBS |
CA |
Sum of Overlapped Records |
Detail |
| 1007940 |
chr1 |
12 |
11 |
0 |
23 |
View |
| 1007941 |
chr1 |
12 |
11 |
0 |
23 |
View |
Target gene [ABCD3] related to Omics data
| Data ID |
Experiment type |
Sample number |
Platform |
|
GSE236281
|
RNA-seq |
12 |
Illumina MiSeq (Homo sapiens) |
|
C GSE35465
|
Chip-seq;RNA-seq |
6 |
Illumina HiSeq 2000 (Homo sapiens) |
|
GSE199850
|
scRNA-seq |
1 |
HiSeq X Ten (Homo sapiens) |
|
C GSE68402
|
Chip-seq |
26 |
Illumina MiSeq (Homo sapiens);Illumina HiSeq 2500 (Homo sapiens) |
|
TCGA_LIHC_HBV
|
DNA methylation sequencing;RNA-seq |
97 |
TCGA |
|
C GSE270130
|
Chip-seq |
27 |
Illumina NovaSeq 6000 (Homo sapiens) |
|
GSE224901
|
RNA-seq |
21 |
Illumina NovaSeq 6000 (Homo sapiens) |
|
GSE100400
|
Chip-seq;RNA-seq;4C_cccDNA |
31 |
Illumina NextSeq 500 (Homo sapiens);Illumina NextSeq 500 (Mus musculus) |
|
GSE173897
|
RNA-seq |
95 |
Illumina HiSeq 4000 (Homo sapiens) |
|
GSE262515
|
RNA-seq |
21 |
Illumina HiSeq 2500 (Homo sapiens);Illumina HiSeq 2500 (Mus musculus) |
|
GSE110345
|
RNA-seq |
4 |
Illumina HiSeq 2500 (Homo sapiens) |
|
C GSE131257
|
ATAC-seq;RNA-seq |
19 |
Illumina HiSeq 2500 (Homo sapiens) |
|
GSE94660
|
RNA-seq |
42 |
Illumina HiSeq 2500 (Homo sapiens) |
When the gene can detect a peak in the dataset, a peak plot will be displayed.
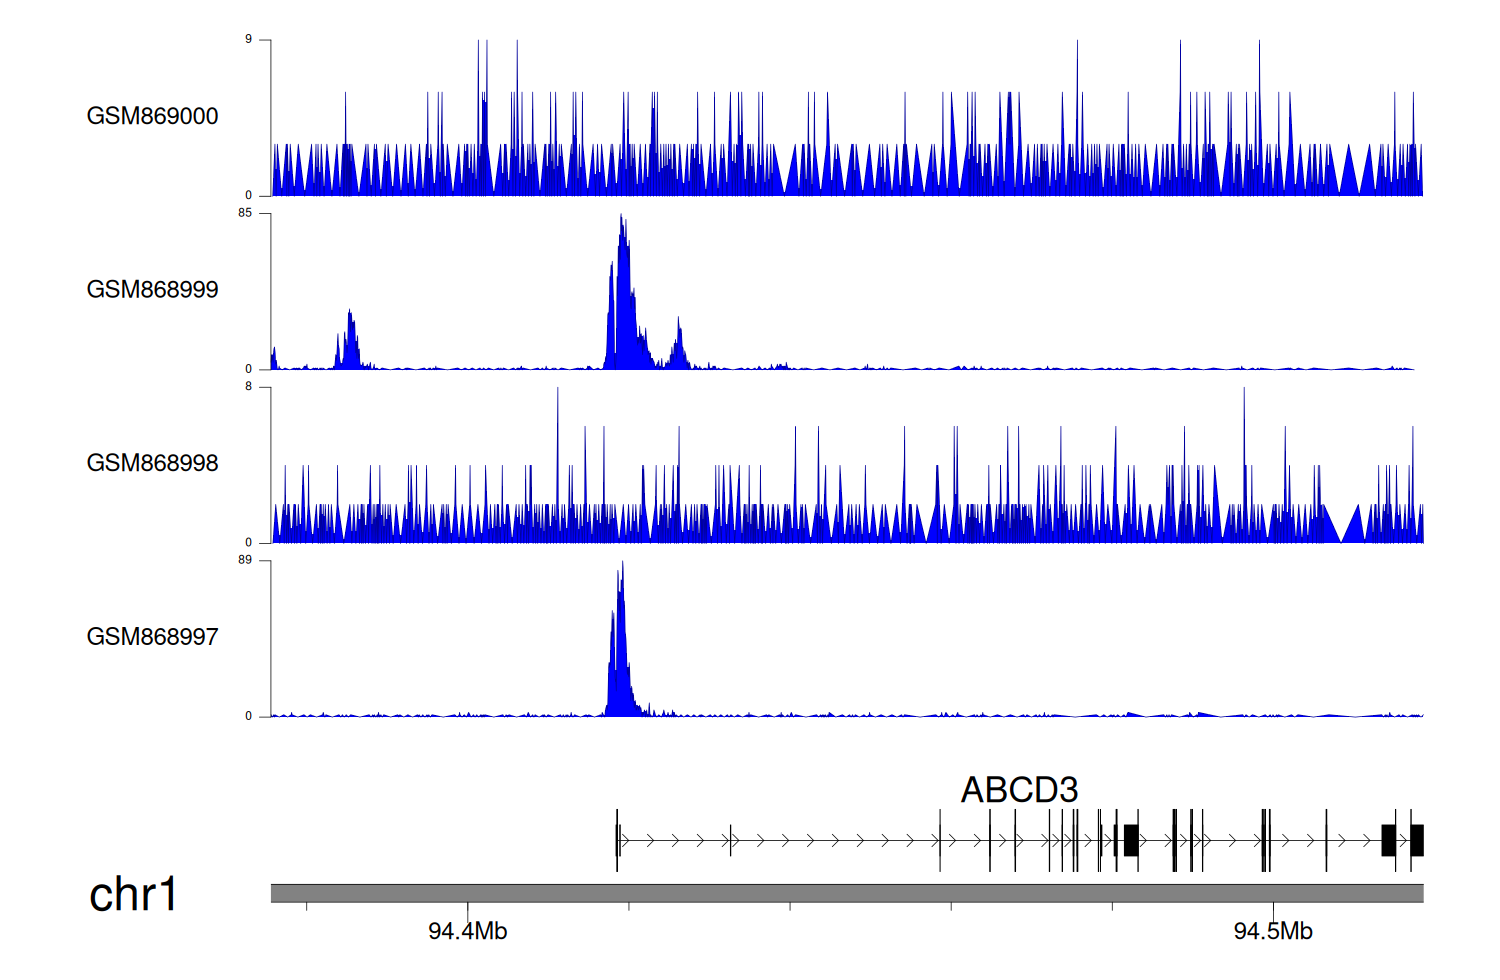
> Dataset: GSE35465 - ABCD3 peak across samples
|
Peak Plot
|
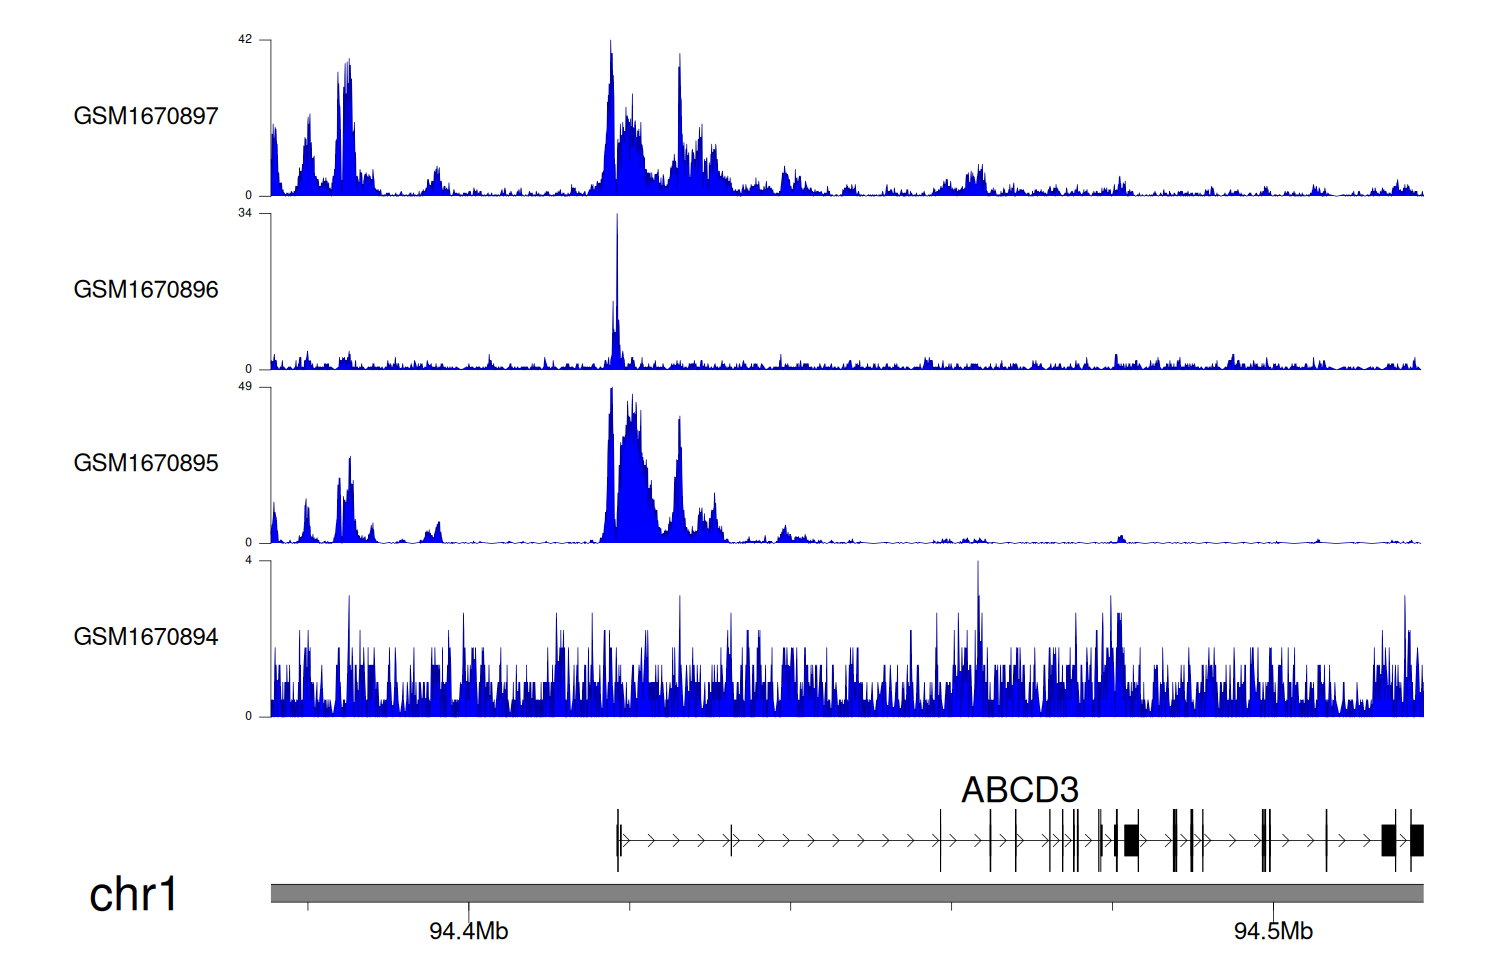
> Dataset: GSE68402 - ABCD3 peak across samples
|
Peak Plot
|
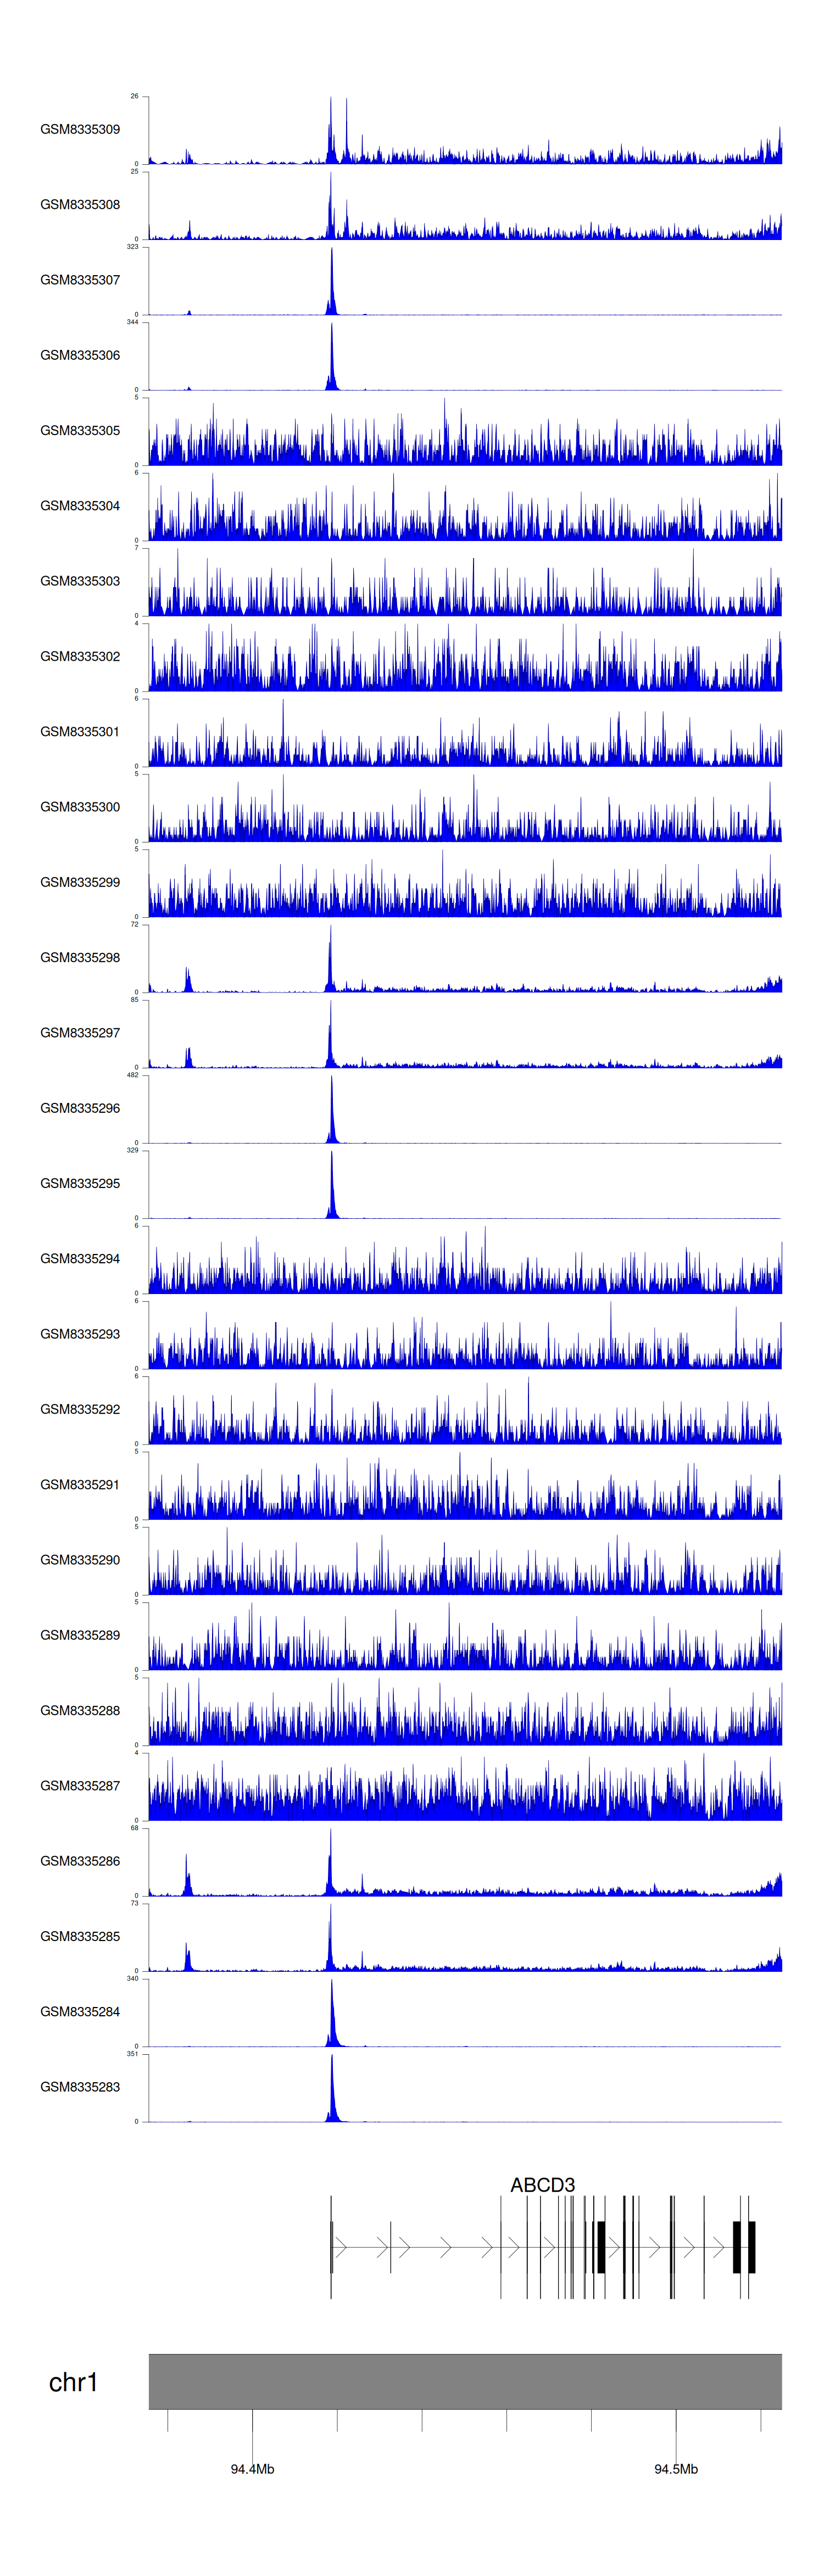
> Dataset: GSE270130 - ABCD3 peak across samples
|
Peak Plot
|
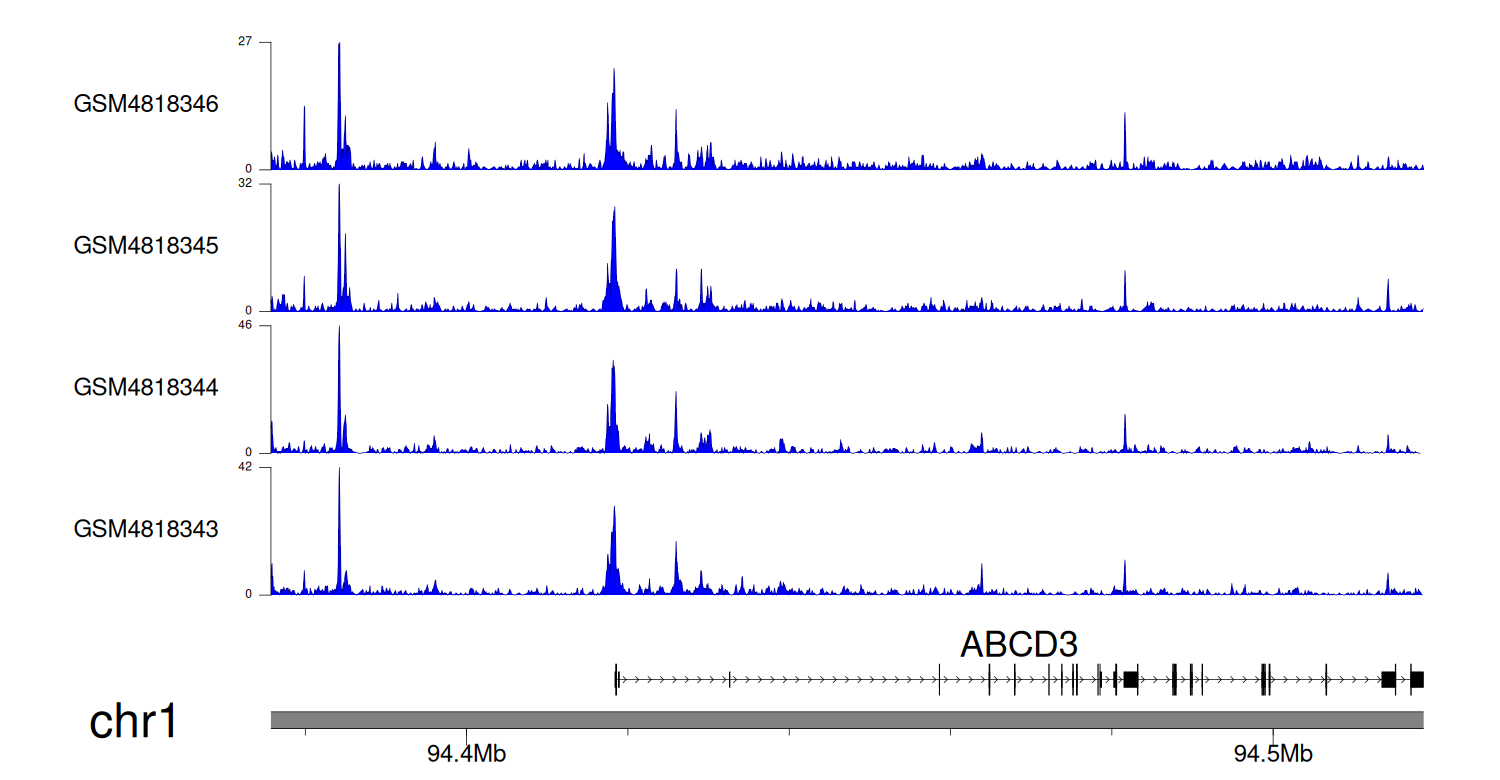
> Dataset: GSE131257 - ABCD3 peak across samples
|
Peak Plot
|
|
|
