Gene Information
|
Gene Name
|
ANK1 |
|
Gene ID
|
286
|
|
Gene Full Name
|
ankyrin 1 |
|
Gene Alias
|
ANK|SPH1|SPH2|ankyrin-1 |
|
Transcripts
|
ENSG00000029534
|
|
Virus
|
HBV |
|
Gene Type
|
protein-coding |
|
HPA Location Info
|

|
|
Membrane Info
|
Disease related genes, Human disease related genes, Plasma proteins, Potential drug targets, Predicted intracellular proteins, Transporters |
|
Uniport_ID
|
P16157
|
|
HGNC ID
|
HGNC:492
|
|
OMIM ID
|
612641 |
|
Summary
|
Ankyrins are a family of proteins that link the integral membrane proteins to the underlying spectrin-actin cytoskeleton and play key roles in activities such as cell motility, activation, proliferation, contact and the maintenance of specialized membrane domains. Multiple isoforms of ankyrin with different affinities for various target proteins are expressed in a tissue-specific, developmentally regulated manner. Most ankyrins are typically composed of three structural domains: an amino-terminal domain containing multiple ankyrin repeats; a central region with a highly conserved spectrin binding domain; and a carboxy-terminal regulatory domain which is the least conserved and subject to variation. Ankyrin 1, the prototype of this family, was first discovered in the erythrocytes, but since has also been found in brain and muscles. Mutations in erythrocytic ankyrin 1 have been associated in approximately half of all patients with hereditary spherocytosis. Complex patterns of alternative splicing in the regulatory domain, giving rise to different isoforms of ankyrin 1 have been described. Truncated muscle-specific isoforms of ankyrin 1 resulting from usage of an alternate promoter have also been identified. [provided by RefSeq, Dec 2008] |
Target gene [ANK1] related to VISs 
Integration Table: if previous studies reported that target gene was altered by virus integration events, the overlap between VISs in this literature and Cistrome factors was listed in this section
| DVID |
Chromosome |
HM |
TFBS |
CA |
Sum of Overlapped Records |
Detail |
| 1007640 |
chr8 |
20 |
4 |
0 |
24 |
View |
| 1011059 |
chr8 |
9 |
1 |
0 |
10 |
View |
Target gene [ANK1] related to Omics data
| Data ID |
Experiment type |
Sample number |
Platform |
|
GSE236281
|
RNA-seq |
12 |
Illumina MiSeq (Homo sapiens) |
|
C GSE35465
|
Chip-seq;RNA-seq |
6 |
Illumina HiSeq 2000 (Homo sapiens) |
|
C GSE68402
|
Chip-seq |
26 |
Illumina MiSeq (Homo sapiens);Illumina HiSeq 2500 (Homo sapiens) |
|
TCGA_LIHC_HBV
|
DNA methylation sequencing;RNA-seq |
97 |
TCGA |
|
C GSE270130
|
Chip-seq |
27 |
Illumina NovaSeq 6000 (Homo sapiens) |
|
GSE224901
|
RNA-seq |
21 |
Illumina NovaSeq 6000 (Homo sapiens) |
|
GSE100400
|
Chip-seq;RNA-seq;4C_cccDNA |
31 |
Illumina NextSeq 500 (Homo sapiens);Illumina NextSeq 500 (Mus musculus) |
|
GSE173897
|
RNA-seq |
95 |
Illumina HiSeq 4000 (Homo sapiens) |
|
GSE262515
|
RNA-seq |
21 |
Illumina HiSeq 2500 (Homo sapiens);Illumina HiSeq 2500 (Mus musculus) |
|
GSE110345
|
RNA-seq |
4 |
Illumina HiSeq 2500 (Homo sapiens) |
|
C GSE131257
|
ATAC-seq;RNA-seq |
19 |
Illumina HiSeq 2500 (Homo sapiens) |
|
GSE94660
|
RNA-seq |
42 |
Illumina HiSeq 2500 (Homo sapiens) |
When the gene can detect a peak in the dataset, a peak plot will be displayed.
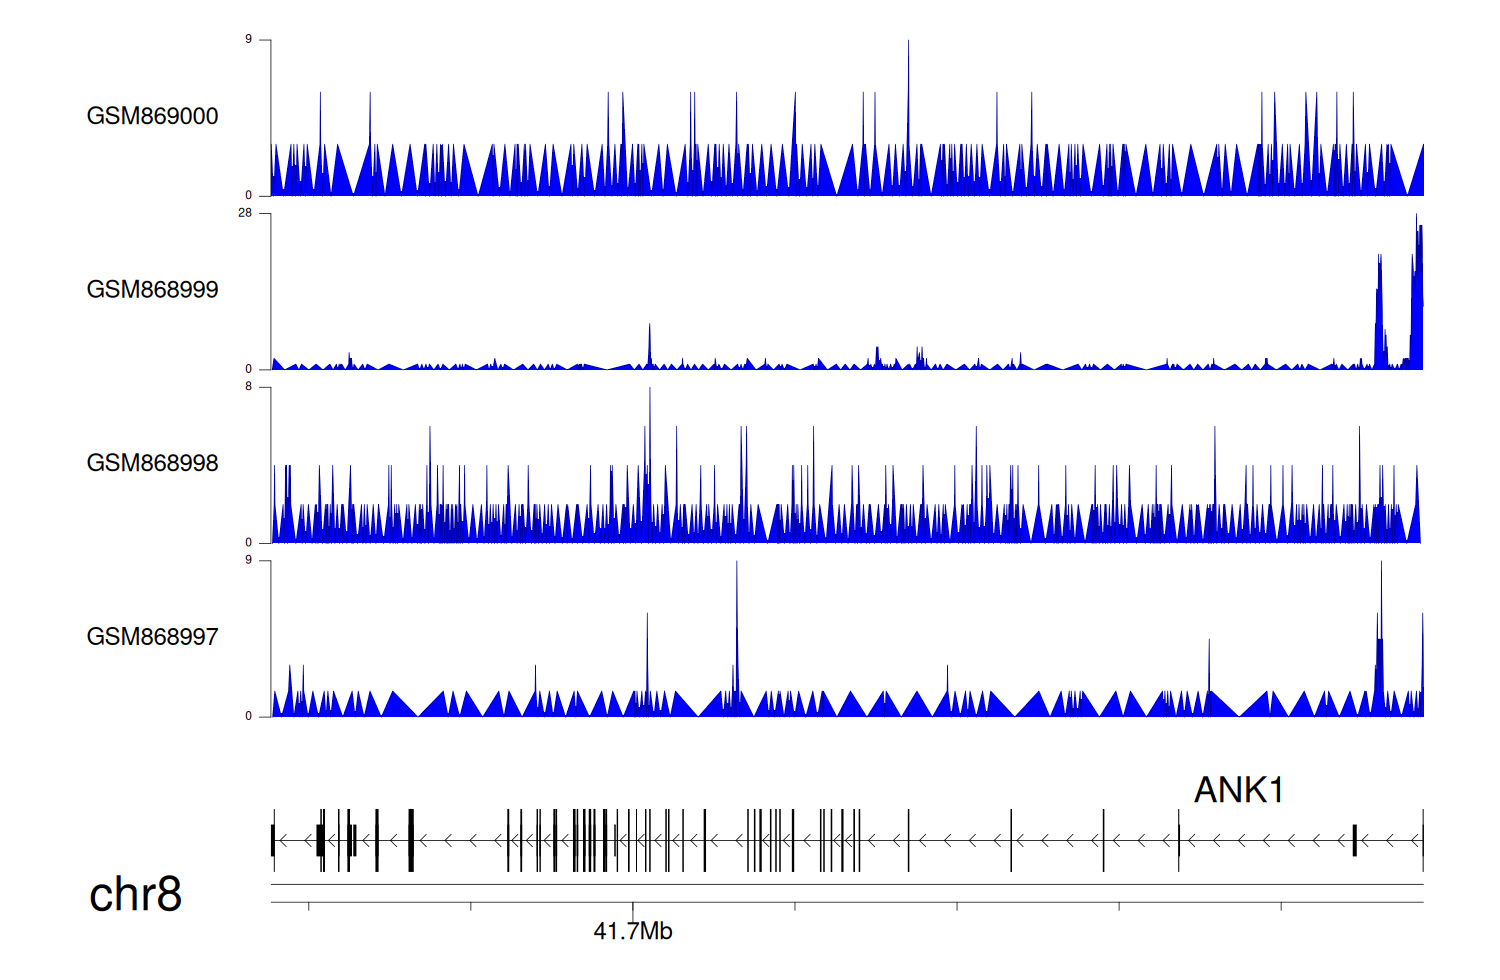
> Dataset: GSE35465 - ANK1 peak across samples
|
Peak Plot
|
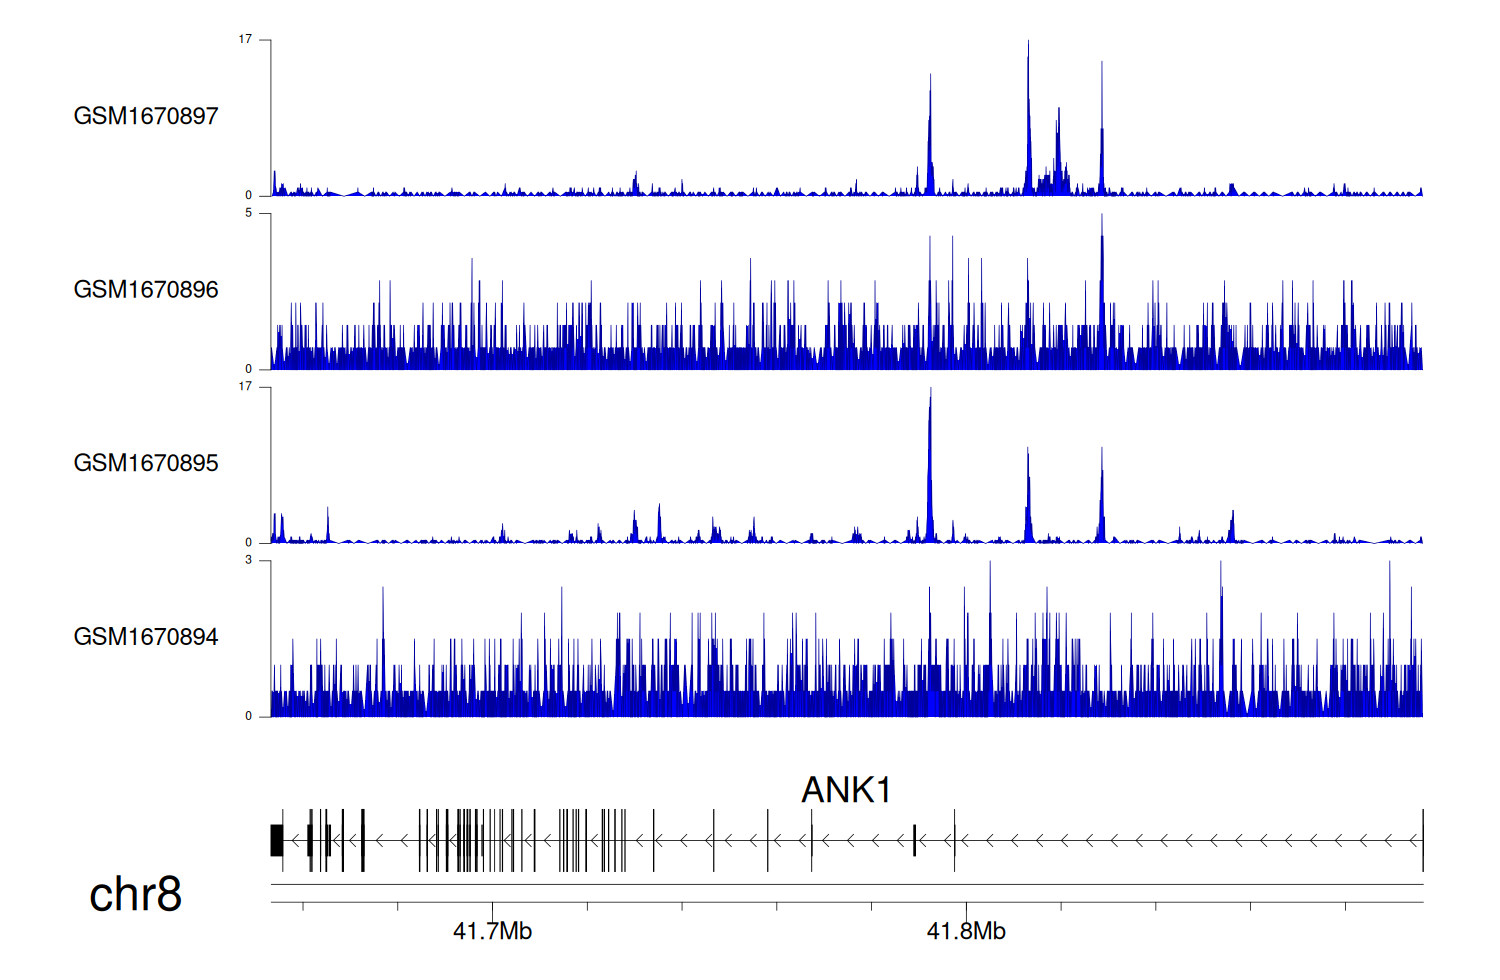
> Dataset: GSE68402 - ANK1 peak across samples
|
Peak Plot
|
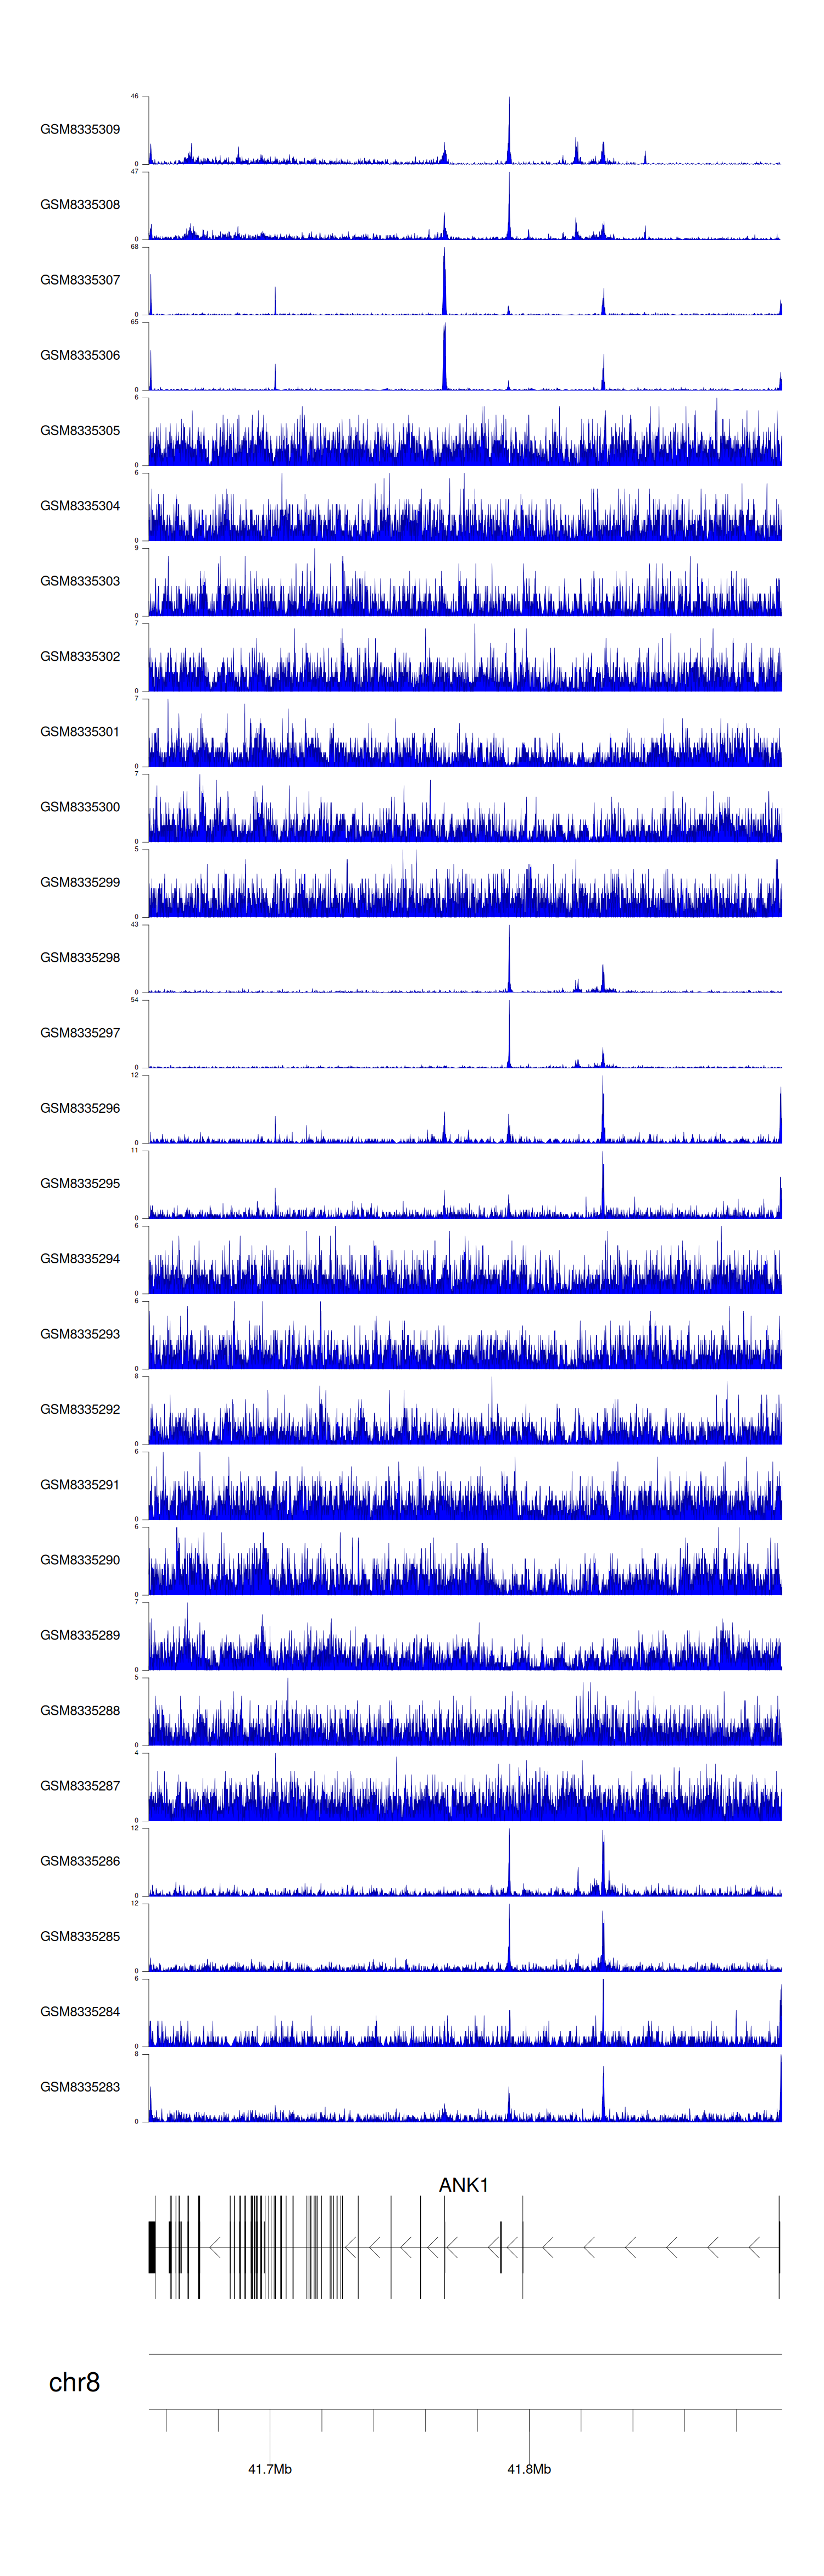
> Dataset: GSE270130 - ANK1 peak across samples
|
Peak Plot
|
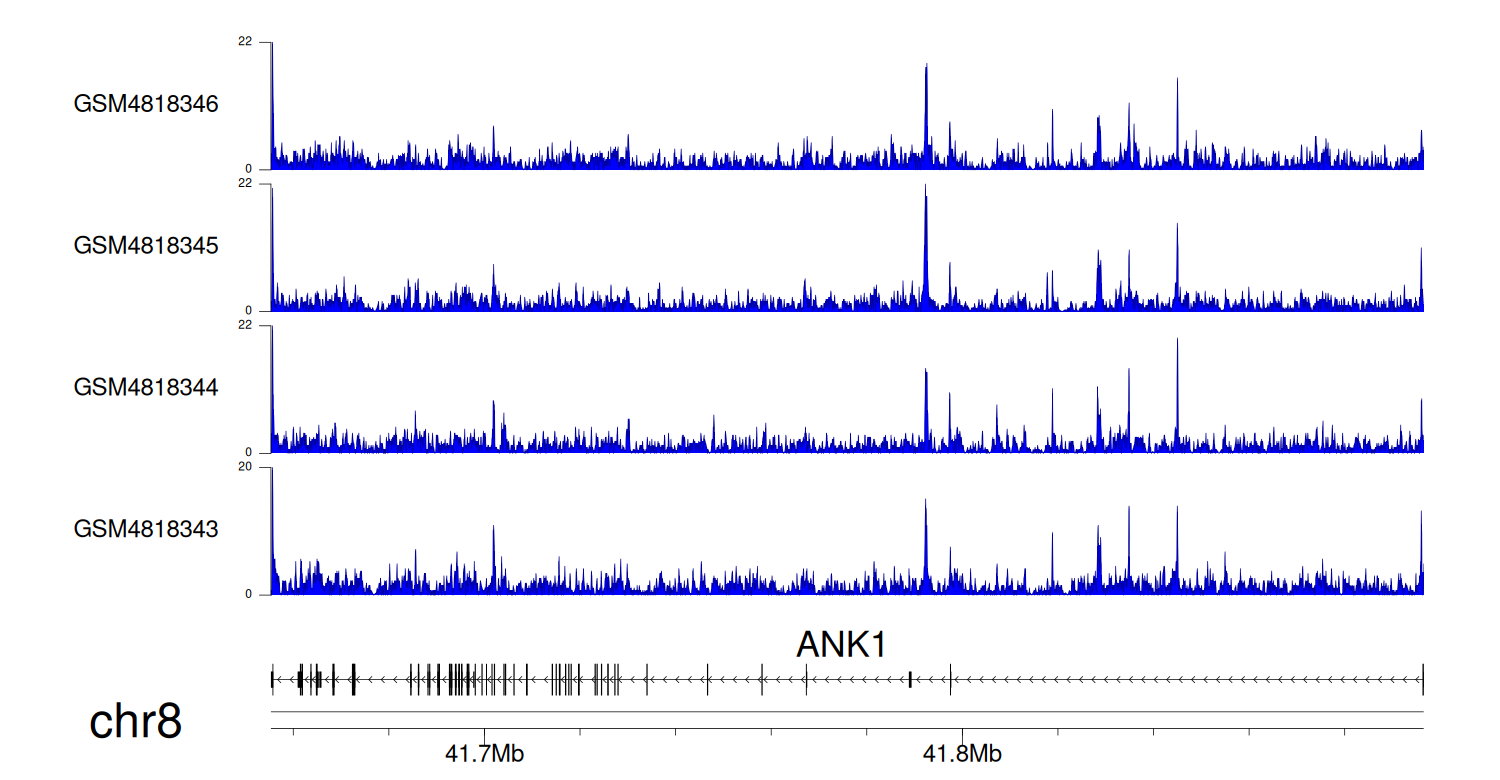
> Dataset: GSE131257 - ANK1 peak across samples
|
Peak Plot
|
|
|
