Gene Information
|
Gene Name
|
ANO3 |
|
Gene ID
|
63982
|
|
Gene Full Name
|
anoctamin 3 |
|
Gene Alias
|
C11orf25|DYT23|DYT24|GENX-3947|TMEM16C |
|
Transcripts
|
ENSG00000134343
|
|
Virus
|
HBV |
|
Gene Type
|
protein-coding |
|
HPA Location Info
|
Microtubules, Primary cilium; 
|
|
Membrane Info
|
Disease related genes, Human disease related genes, Potential drug targets, Predicted intracellular proteins, Predicted membrane proteins, Transporters |
|
Uniport_ID
|
Q9BYT9
|
|
HGNC ID
|
HGNC:14004
|
|
OMIM ID
|
610110 |
|
Summary
|
The protein encoded by this gene belongs to the TMEM16 family of predicted membrane proteins, that are also known as anoctamins. While little is known about the function of this gene, mutations in this gene have been associated with some cases of autosomal dominant craniocervical dystonia. Cells from individuals with a mutation in this gene exhibited abnormalities in endoplasmic reticulum-dependent calcium signaling. Studies in rat show that the rat ortholog of this protein interacts with, and modulates the activity of a sodium-activated potassium channel. Deletion of this gene caused increased pain sensitivity in the rat model system. Alternative splicing results in multiple transcript variants encoding different isoforms. [provided by RefSeq, Aug 2015] |
Target gene [ANO3] related to VISs 
Integration Table: if previous studies reported that target gene was altered by virus integration events, the overlap between VISs in this literature and Cistrome factors was listed in this section
| DVID |
Chromosome |
HM |
TFBS |
CA |
Sum of Overlapped Records |
Detail |
| 1014810 |
chr11 |
2 |
1 |
0 |
3 |
View |
| 1017146 |
chr11 |
0 |
1 |
0 |
1 |
View |
Target gene [ANO3] related to Omics data
| Data ID |
Experiment type |
Sample number |
Platform |
|
GSE236281
|
RNA-seq |
12 |
Illumina MiSeq (Homo sapiens) |
|
C GSE35465
|
Chip-seq;RNA-seq |
6 |
Illumina HiSeq 2000 (Homo sapiens) |
|
C GSE68402
|
Chip-seq |
26 |
Illumina MiSeq (Homo sapiens);Illumina HiSeq 2500 (Homo sapiens) |
|
TCGA_LIHC_HBV
|
DNA methylation sequencing;RNA-seq |
97 |
TCGA |
|
C GSE270130
|
Chip-seq |
27 |
Illumina NovaSeq 6000 (Homo sapiens) |
|
GSE224901
|
RNA-seq |
21 |
Illumina NovaSeq 6000 (Homo sapiens) |
|
C GSE100400
|
Chip-seq;RNA-seq;4C_cccDNA |
31 |
Illumina NextSeq 500 (Homo sapiens);Illumina NextSeq 500 (Mus musculus) |
|
GSE173897
|
RNA-seq |
95 |
Illumina HiSeq 4000 (Homo sapiens) |
|
GSE262515
|
RNA-seq |
21 |
Illumina HiSeq 2500 (Homo sapiens);Illumina HiSeq 2500 (Mus musculus) |
|
GSE110345
|
RNA-seq |
4 |
Illumina HiSeq 2500 (Homo sapiens) |
|
C GSE131257
|
ATAC-seq;RNA-seq |
19 |
Illumina HiSeq 2500 (Homo sapiens) |
|
GSE94660
|
RNA-seq |
42 |
Illumina HiSeq 2500 (Homo sapiens) |
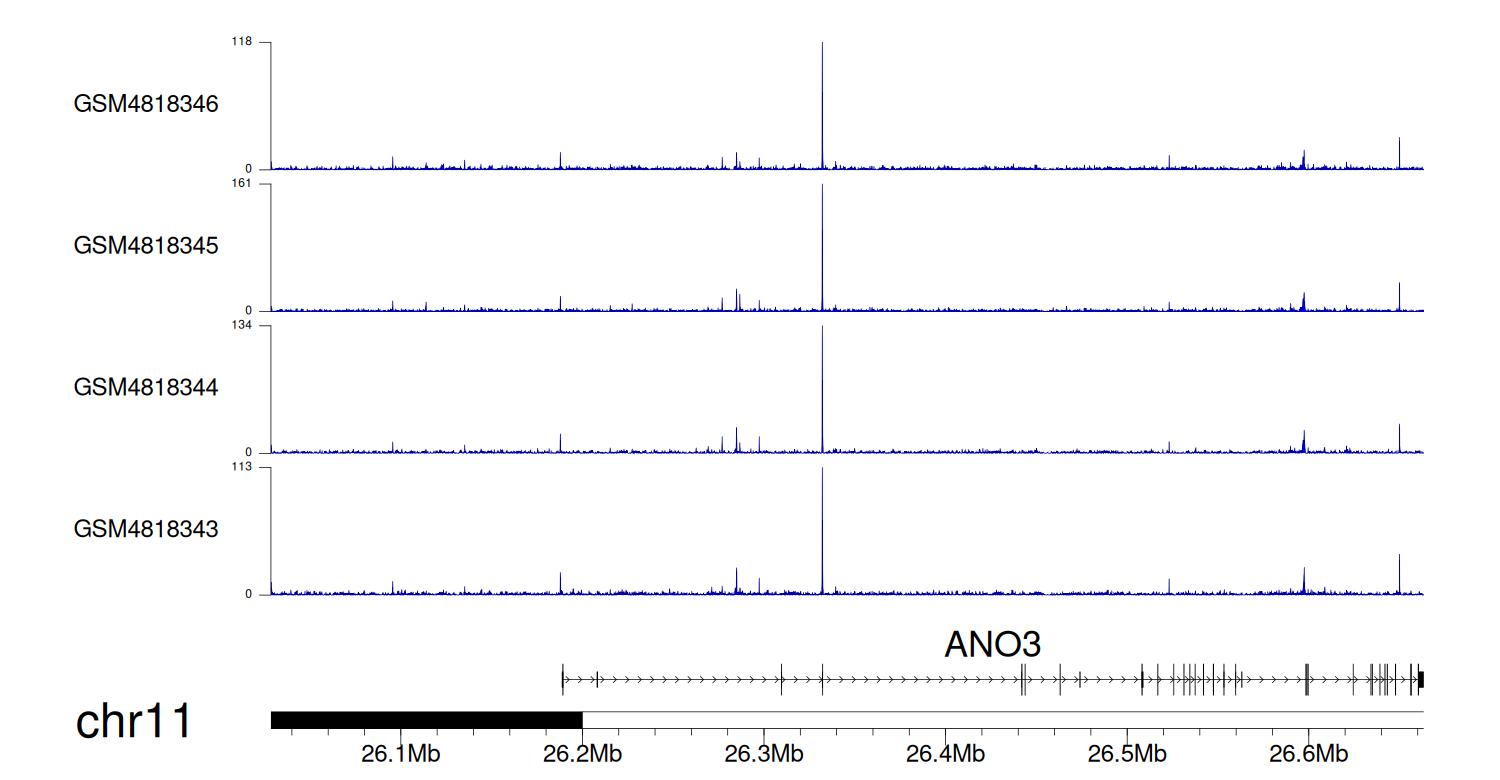
When the gene can detect a peak in the dataset, a peak plot will be displayed.
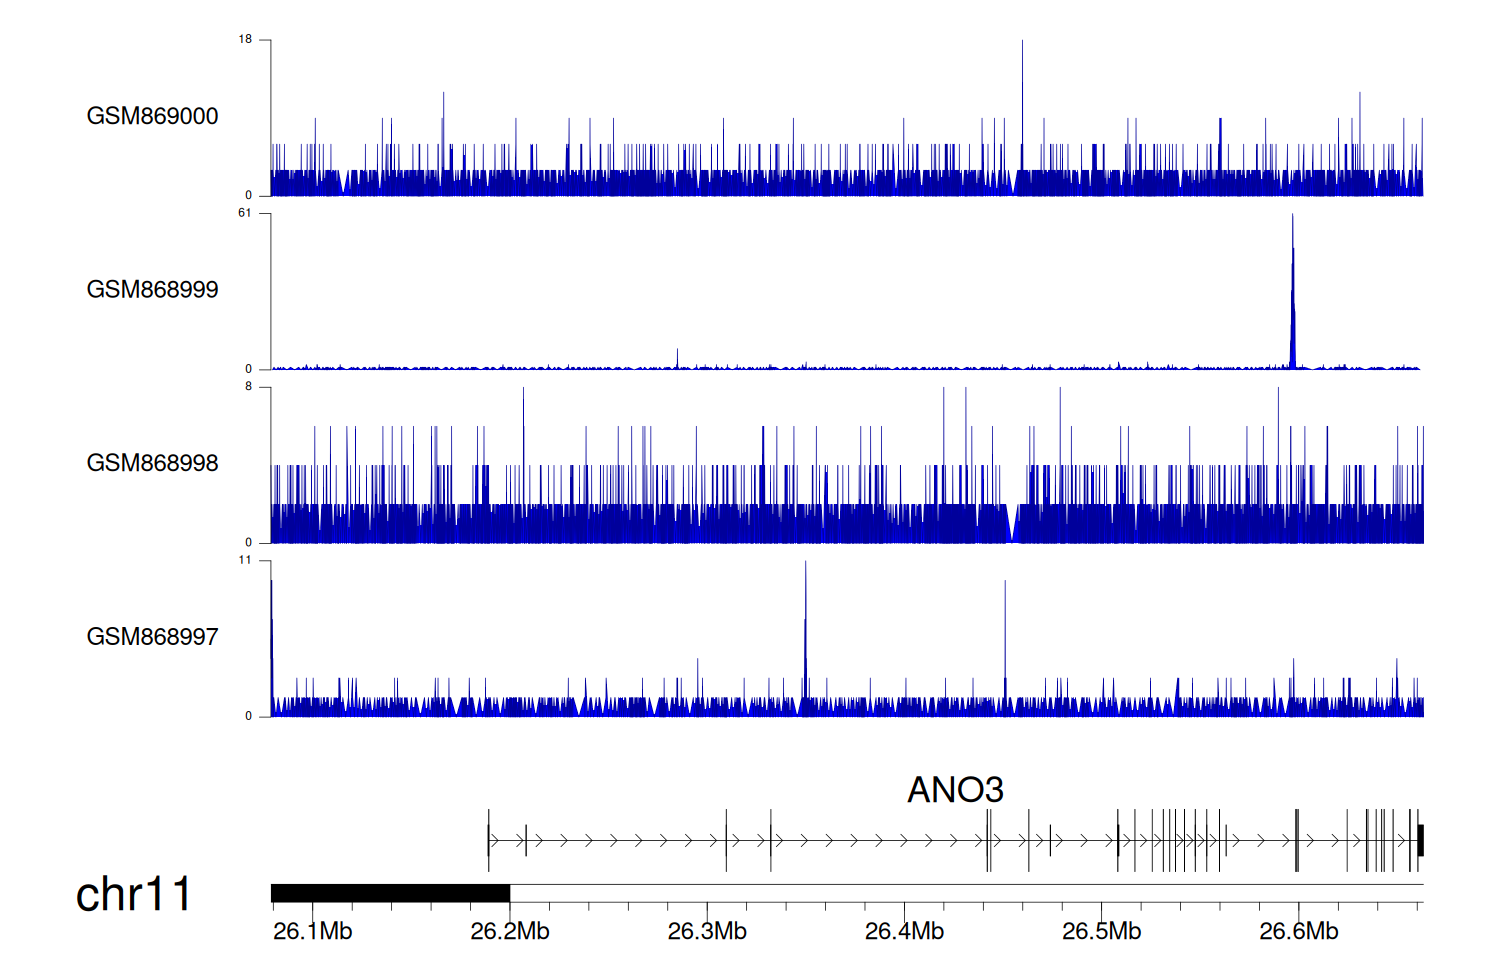
> Dataset: GSE35465 - ANO3 peak across samples
|
Peak Plot
|
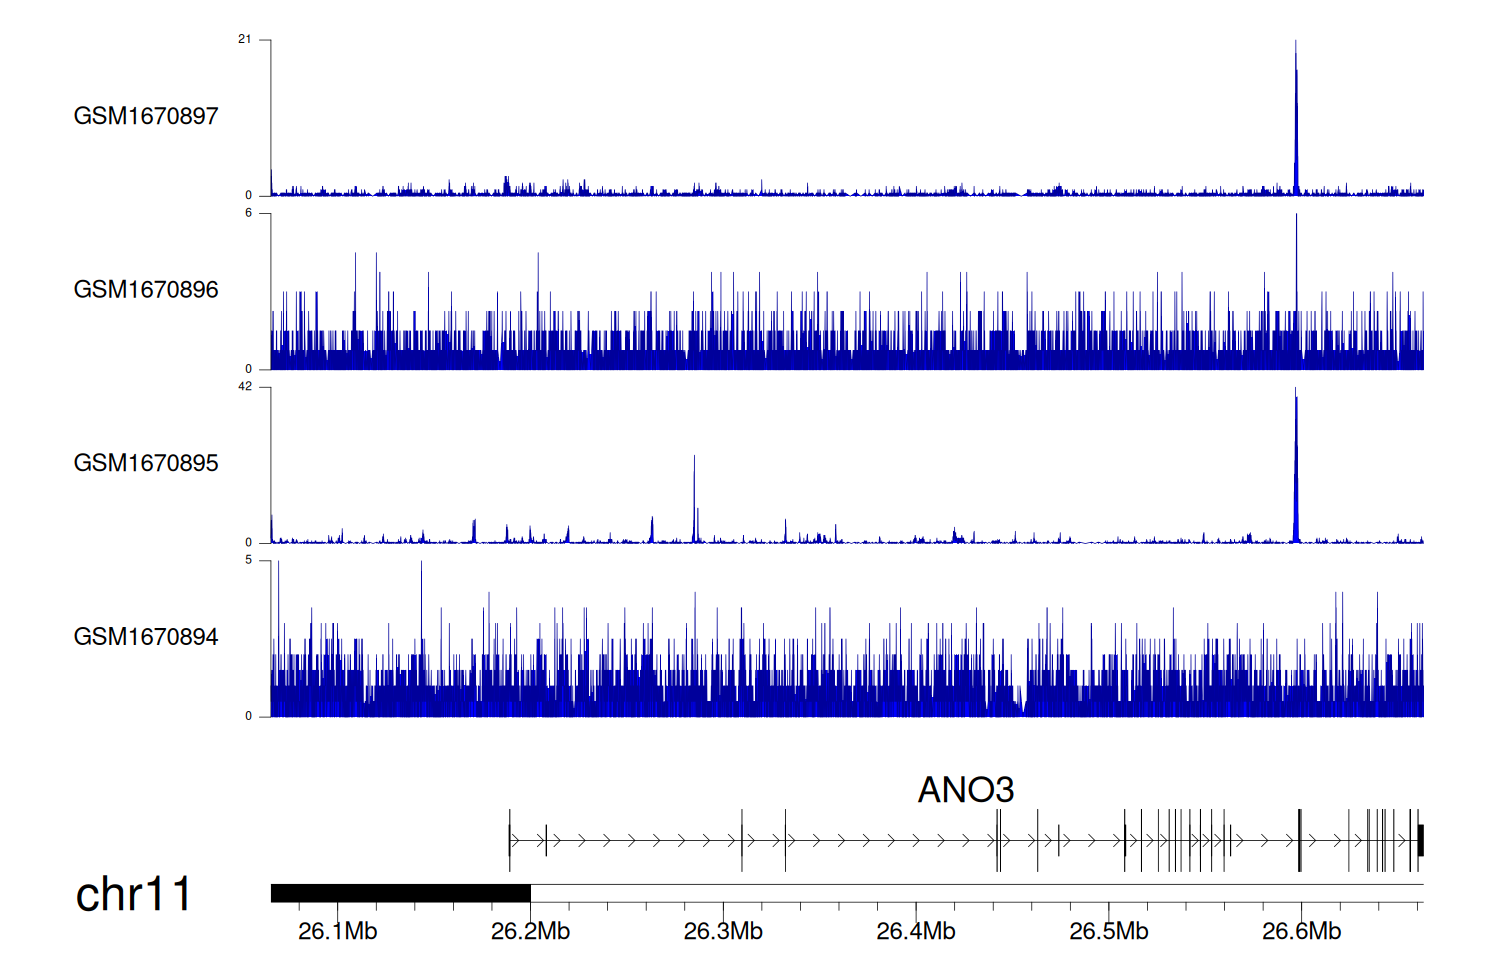
> Dataset: GSE68402 - ANO3 peak across samples
|
Peak Plot
|
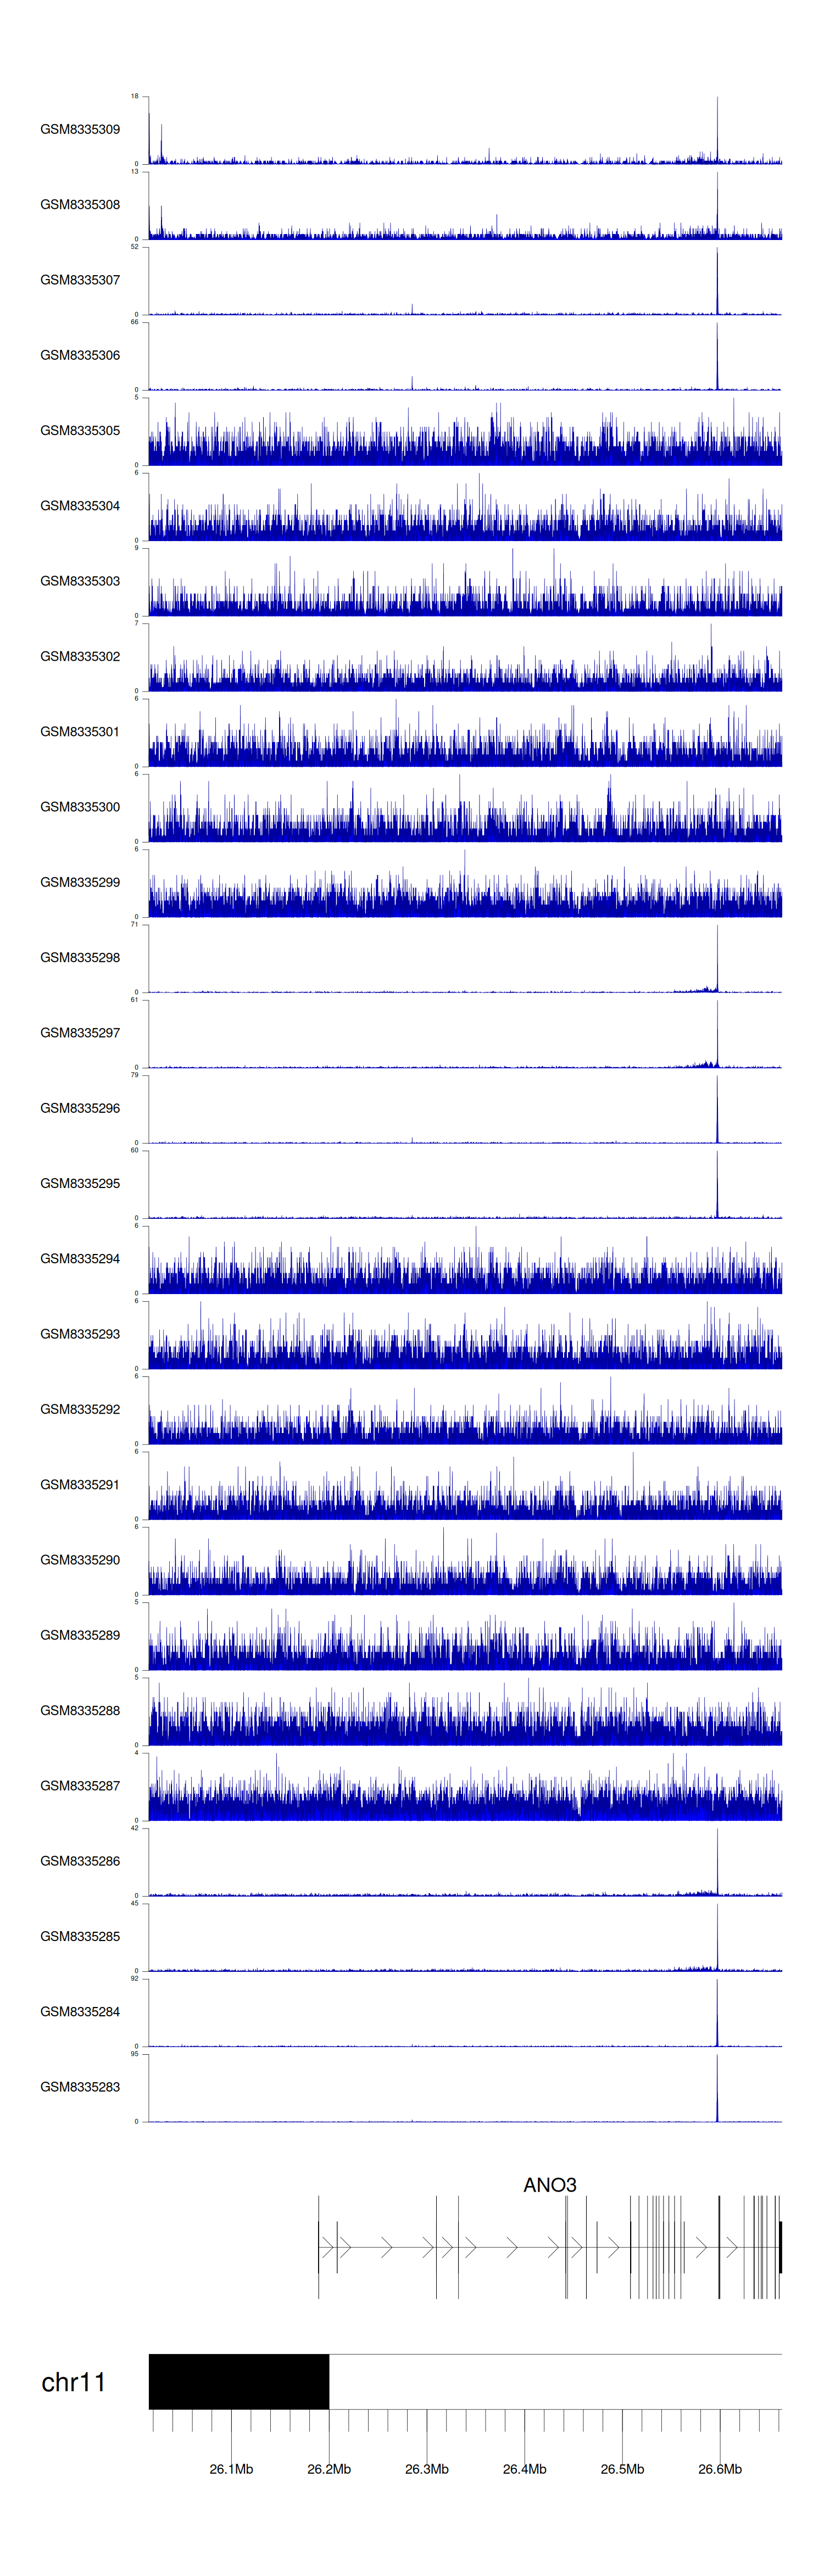
> Dataset: GSE270130 - ANO3 peak across samples
|
Peak Plot
|
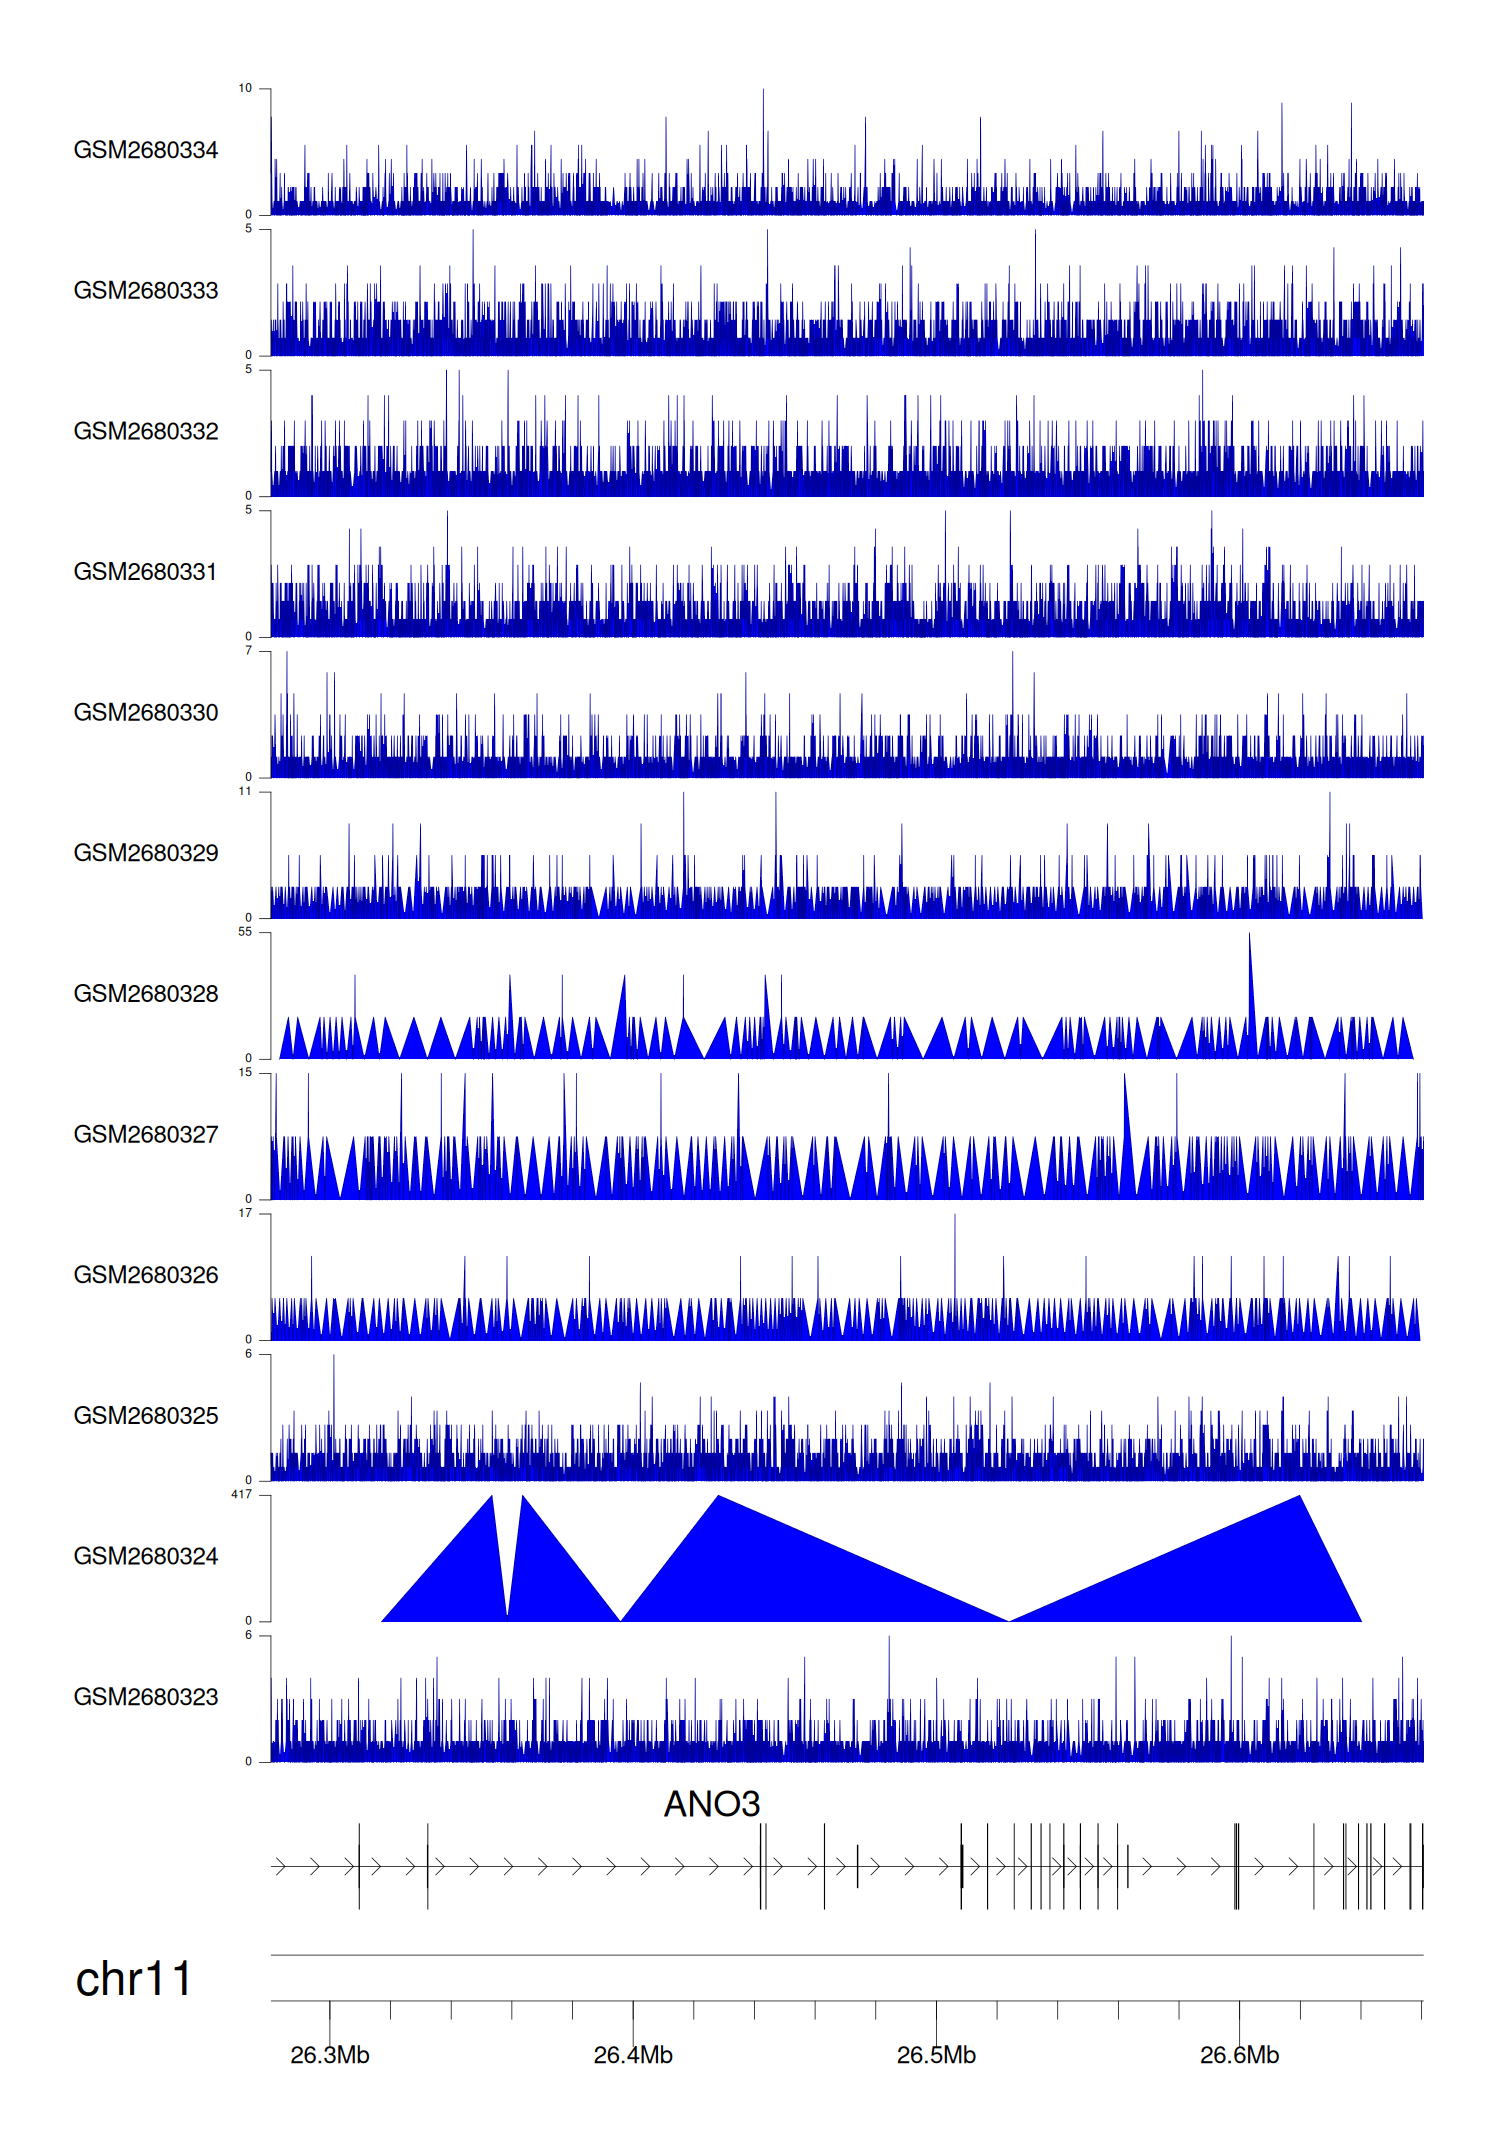
> Dataset: GSE100400 - ANO3 peak across samples
|
Peak Plot
|
> Dataset: GSE131257 - ANO3 peak across samples
|
Peak Plot
|
|
|
