Gene Information
|
Gene Name
|
ASS1 |
|
Gene ID
|
445
|
|
Gene Full Name
|
argininosuccinate synthase 1 |
|
Gene Alias
|
ASS|CTLN1 |
|
Transcripts
|
ENSG00000130707
|
|
Virus
|
HTLV1 |
|
Gene Type
|
protein-coding |
|
HPA Location Info
|
Cytosol;Nucleoplasm; 
|
|
Membrane Info
|
Disease related genes, Enzymes, Human disease related genes, Metabolic proteins, Plasma proteins, Potential drug targets, Predicted intracellular proteins |
|
Uniport_ID
|
P00966
|
|
HGNC ID
|
HGNC:758
|
|
OMIM ID
|
603470 |
|
Summary
|
The protein encoded by this gene catalyzes the penultimate step of the arginine biosynthetic pathway. There are approximately 10 to 14 copies of this gene including the pseudogenes scattered across the human genome, among which the one located on chromosome 9 appears to be the only functional gene for argininosuccinate synthetase. Mutations in the chromosome 9 copy of this gene cause citrullinemia. Two transcript variants encoding the same protein have been found for this gene. [provided by RefSeq, Aug 2012] |
Target gene [ASS1] related to VISs 
Integration Table: if previous studies reported that target gene was altered by virus integration events, the overlap between VISs in this literature and Cistrome factors was listed in this section
| DVID |
Chromosome |
HM |
TFBS |
CA |
Sum of Overlapped Records |
Detail |
| 6011067 |
chr9 |
26 |
2 |
0 |
28 |
View |
Target gene [ASS1] related to Omics data
| Data ID |
Experiment type |
Sample number |
Platform |
|
C GSE94732
|
Chip-seq |
24 |
Illumina NextSeq 500 (Homo sapiens);illumina Genome Analyzer IIx (Homo sapiens) |
|
GSE168557
|
Expression array |
6 |
Agilent-039494 SurePrint G3 Human GE v2 8x60K Microarray 039381 (Feature Number version) |
|
GSE10789
|
Expression array |
6 |
NCI/ATC Hs-OperonV3 |
|
GSE189602
|
Methylation profiling (Array) |
4 |
Infinium MethylationEPIC |
|
GSE136189
|
Methylation profiling (Array) |
40 |
Illumina HumanMethylation450 BeadChip (HumanMethylation450_15017482);Illumina Infinium HumanMethylation850 BeadChip |
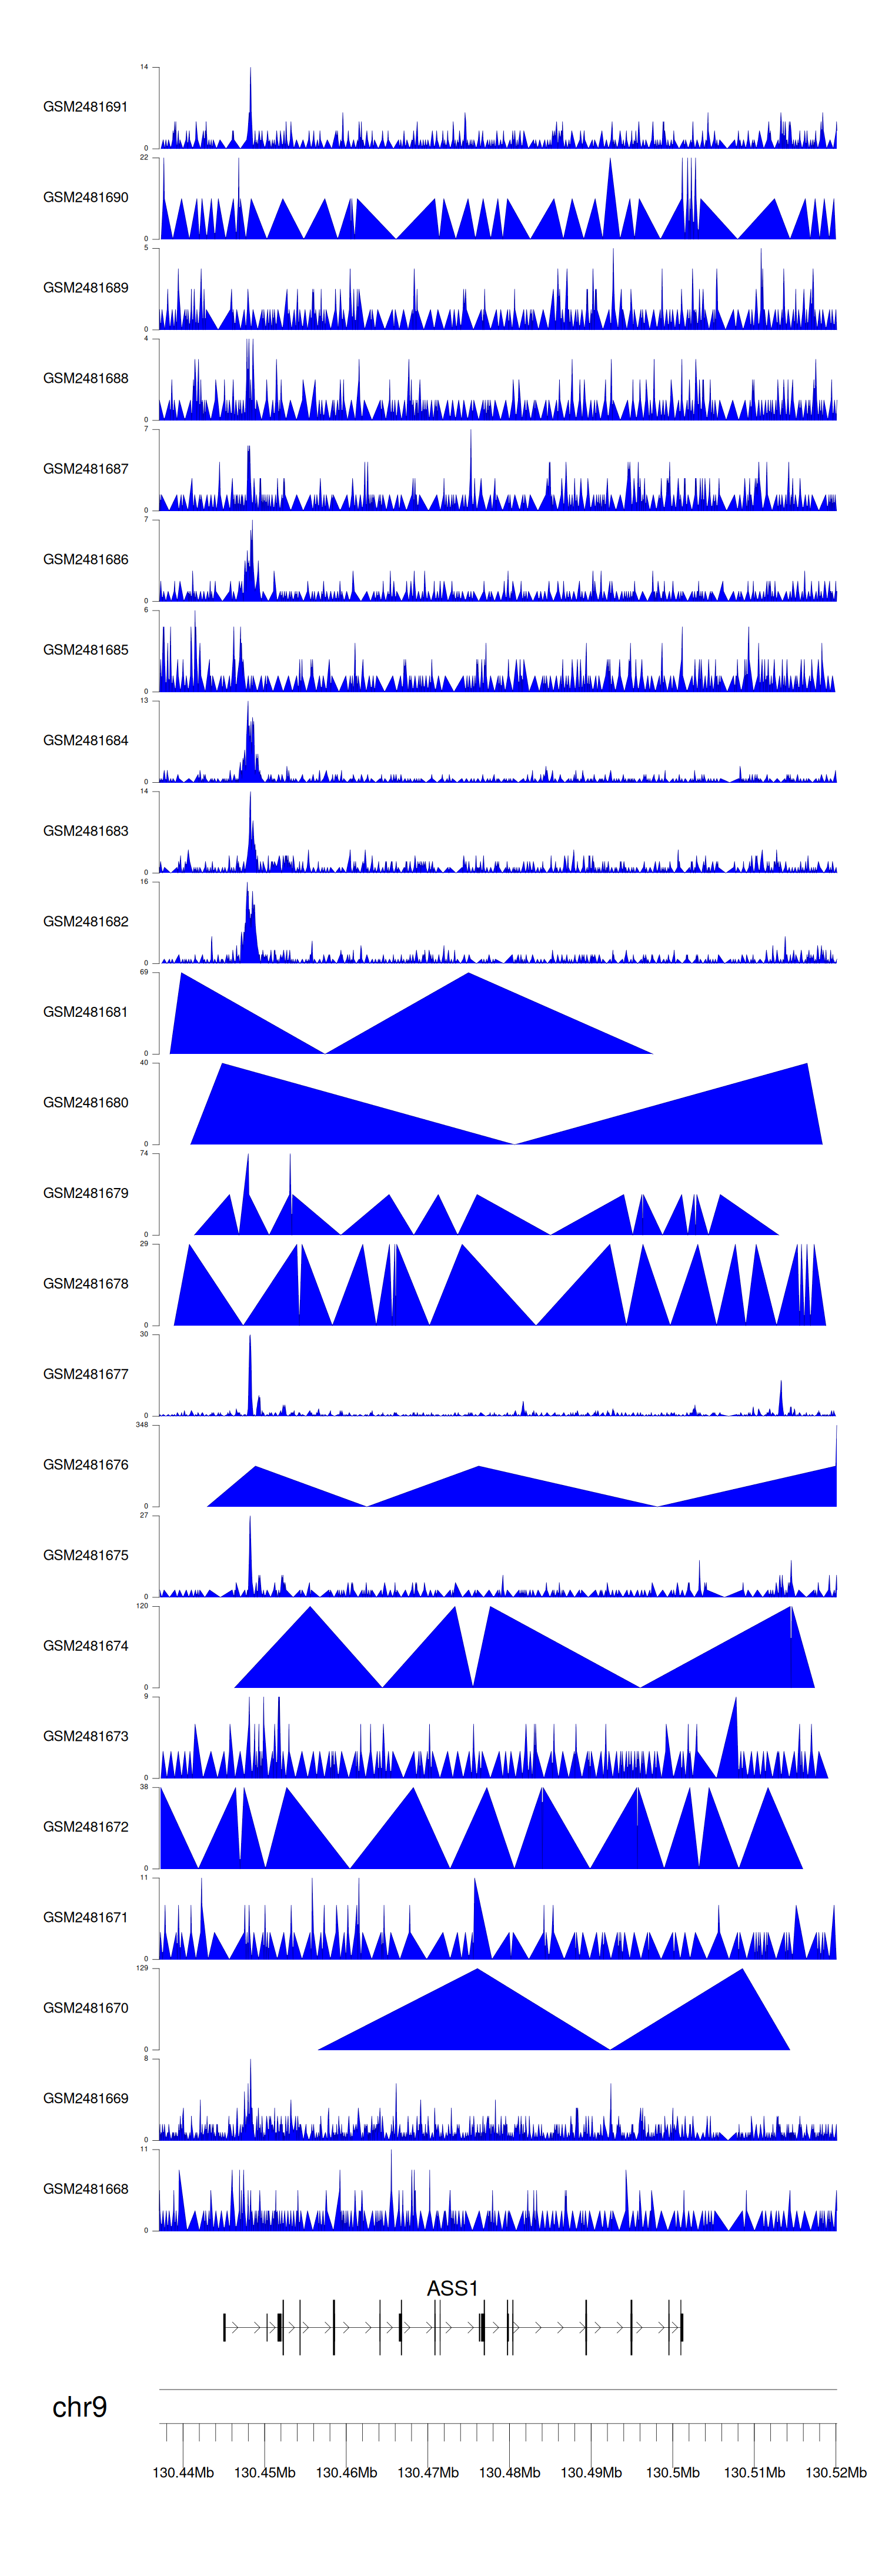
When the gene can detect a peak in the dataset, a peak plot will be displayed.
> Dataset: GSE94732 - ASS1 peak across samples
|
Peak Plot
|
|
|
