Gene Information
|
Gene Name
|
ATP11A |
|
Gene ID
|
23250
|
|
Gene Full Name
|
ATPase phospholipid transporting 11A |
|
Gene Alias
|
ATPIH|ATPIS|AUNA2|DFNA84|HLD24 |
|
Transcripts
|
ENSG00000068650
|
|
Virus
|
HTLV1 |
|
Gene Type
|
protein-coding |
|
HPA Location Info
|
Vesicles;Golgi apparatus; 
|
|
Membrane Info
|
Disease related genes, Enzymes, Human disease related genes, Metabolic proteins, Plasma proteins, Potential drug targets, Predicted intracellular proteins, Predicted membrane proteins, Transporters |
|
Uniport_ID
|
P98196
|
|
HGNC ID
|
HGNC:13552
|
|
OMIM ID
|
605868 |
|
Summary
|
The protein encoded by this gene is an integral membrane ATPase. The encoded protein is probably phosphorylated in its intermediate state and likely drives the transport of ions such as calcium across membranes. [provided by RefSeq, Apr 2022] |
Target gene [ATP11A] related to VISs 
Integration Table: if previous studies reported that target gene was altered by virus integration events, the overlap between VISs in this literature and Cistrome factors was listed in this section
| DVID |
Chromosome |
HM |
TFBS |
CA |
Sum of Overlapped Records |
Detail |
| 6003233 |
chr13 |
144 |
28 |
2 |
174 |
View |
| 6008897 |
chr13 |
29 |
8 |
4 |
41 |
View |
| 6011953 |
chr13 |
18 |
3 |
3 |
24 |
View |
| 6017437 |
chr13 |
6 |
4 |
0 |
10 |
View |
Target gene [ATP11A] related to Omics data
| Data ID |
Experiment type |
Sample number |
Platform |
|
C GSE94732
|
Chip-seq |
24 |
Illumina NextSeq 500 (Homo sapiens);illumina Genome Analyzer IIx (Homo sapiens) |
|
GSE168557
|
Expression array |
6 |
Agilent-039494 SurePrint G3 Human GE v2 8x60K Microarray 039381 (Feature Number version) |
|
GSE10789
|
Expression array |
6 |
NCI/ATC Hs-OperonV3 |
|
GSE224047
|
RNA-seq |
10 |
Illumina NextSeq 500 (Homo sapiens) |
|
GSE189602
|
Methylation profiling (Array) |
4 |
Infinium MethylationEPIC |
|
GSE136189
|
Methylation profiling (Array) |
40 |
Illumina HumanMethylation450 BeadChip (HumanMethylation450_15017482);Illumina Infinium HumanMethylation850 BeadChip |
When the gene can detect a peak in the dataset, a peak plot will be displayed.
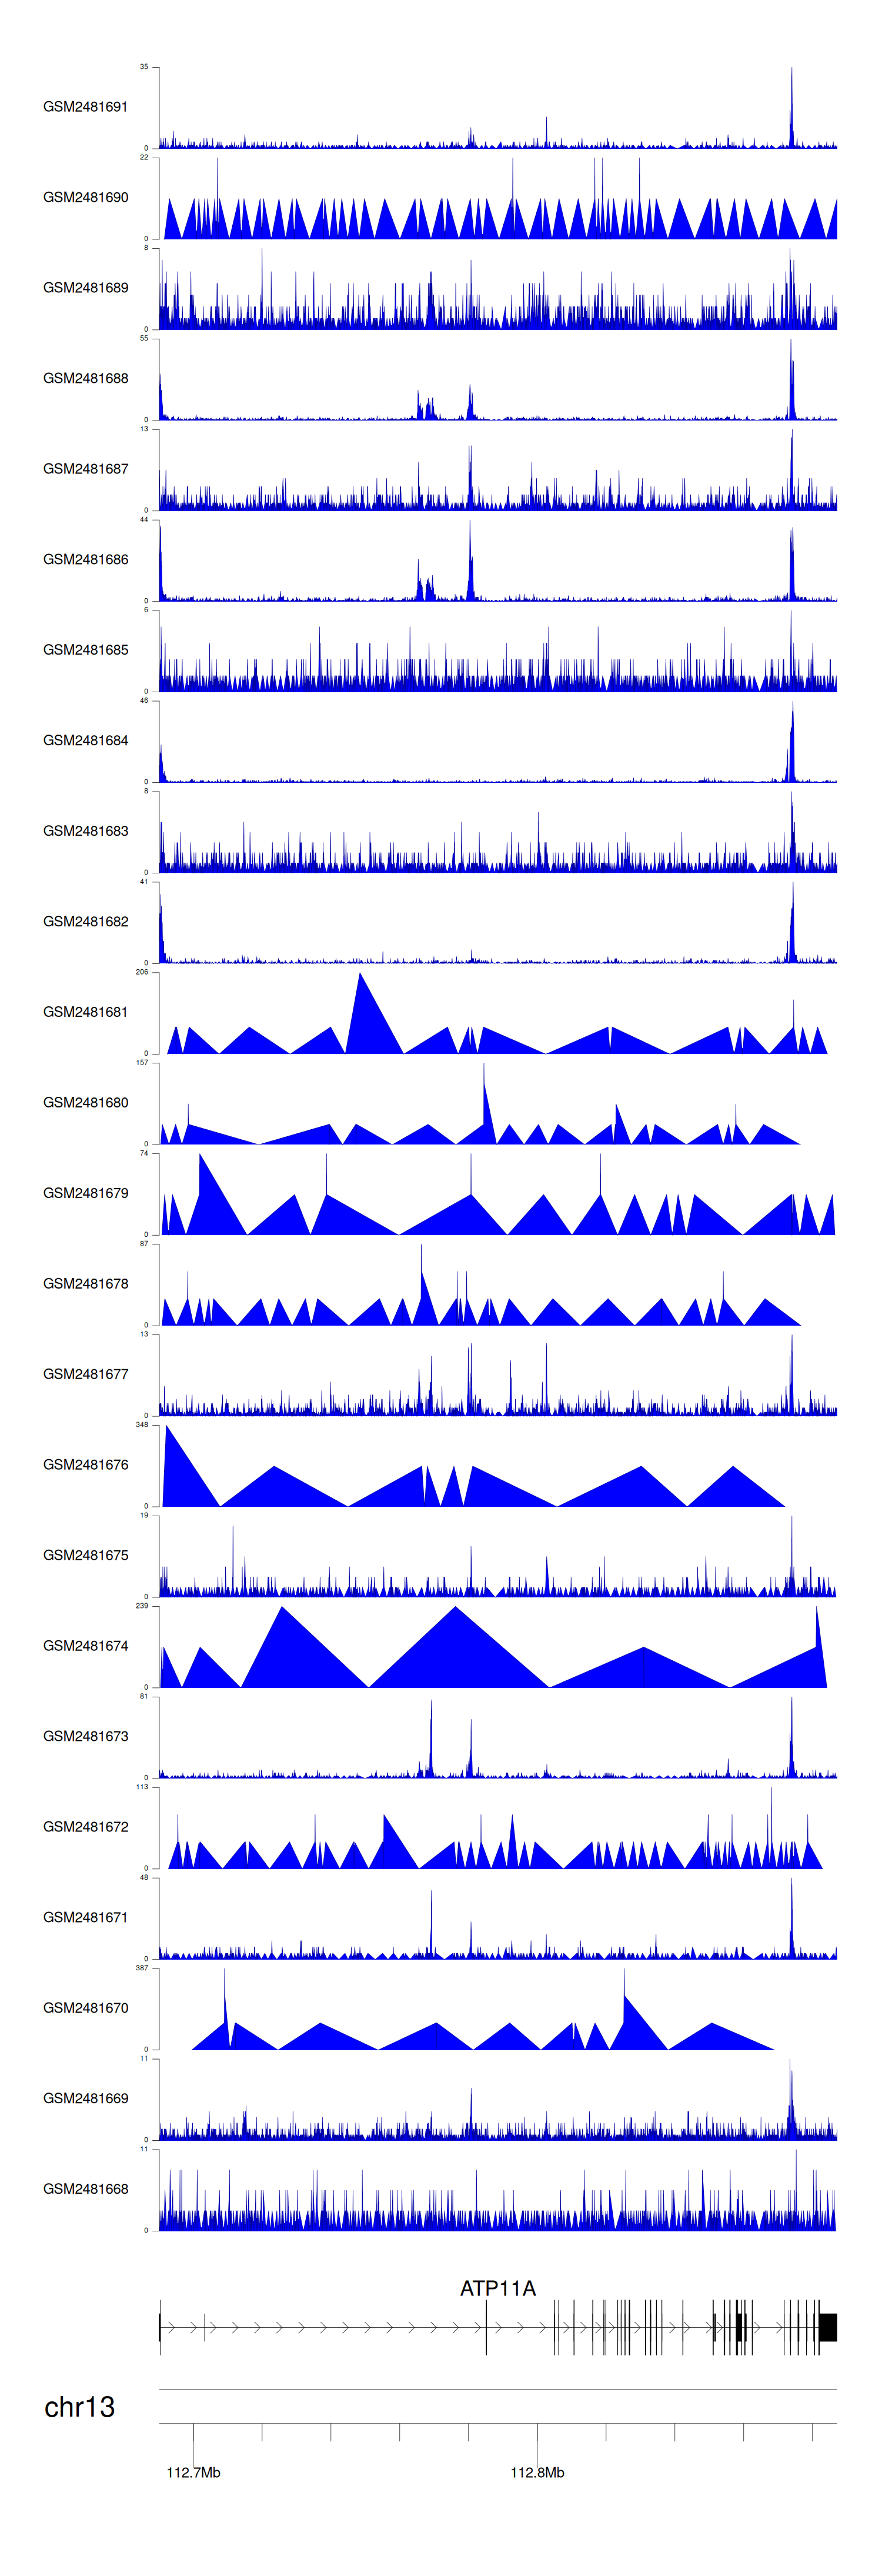
> Dataset: GSE94732 - ATP11A peak across samples
|
Peak Plot
|
|
|
