Gene Information
|
Gene Name
|
ATP2A1 |
|
Gene ID
|
487
|
|
Gene Full Name
|
ATPase sarcoplasmic/endoplasmic reticulum Ca2+ transporting 1 |
|
Gene Alias
|
ATP2A|SERCA1 |
|
Transcripts
|
ENSG00000196296
|
|
Virus
|
HBV |
|
Gene Type
|
protein-coding |
|
HPA Location Info
|
Endoplasmic reticulum; 
|
|
Membrane Info
|
Disease related genes, Enzymes, FDA approved drug targets, Human disease related genes, Metabolic proteins, Plasma proteins, Predicted intracellular proteins, Predicted membrane proteins |
|
Uniport_ID
|
O14983
|
|
HGNC ID
|
HGNC:811
|
|
OMIM ID
|
108730 |
|
Summary
|
This gene encodes one of the SERCA Ca(2+)-ATPases, which are intracellular pumps located in the sarcoplasmic or endoplasmic reticula of muscle cells. This enzyme catalyzes the hydrolysis of ATP coupled with the translocation of calcium from the cytosol to the sarcoplasmic reticulum lumen, and is involved in muscular excitation and contraction. Mutations in this gene cause some autosomal recessive forms of Brody disease, characterized by increasing impairment of muscular relaxation during exercise. Alternative splicing results in three transcript variants encoding different isoforms. [provided by RefSeq, Oct 2013] |
Target gene [ATP2A1] related to VISs 
Integration Table: if previous studies reported that target gene was altered by virus integration events, the overlap between VISs in this literature and Cistrome factors was listed in this section
| DVID |
Chromosome |
HM |
TFBS |
CA |
Sum of Overlapped Records |
Detail |
| 1017588 |
chr16 |
0 |
0 |
0 |
0 |
View |
Target gene [ATP2A1] related to Omics data
| Data ID |
Experiment type |
Sample number |
Platform |
|
GSE236281
|
RNA-seq |
12 |
Illumina MiSeq (Homo sapiens) |
|
C GSE68402
|
Chip-seq |
26 |
Illumina MiSeq (Homo sapiens);Illumina HiSeq 2500 (Homo sapiens) |
|
TCGA_LIHC_HBV
|
DNA methylation sequencing;RNA-seq |
97 |
TCGA |
|
C GSE270130
|
Chip-seq |
27 |
Illumina NovaSeq 6000 (Homo sapiens) |
|
GSE224901
|
RNA-seq |
21 |
Illumina NovaSeq 6000 (Homo sapiens) |
|
GSE100400
|
Chip-seq;RNA-seq;4C_cccDNA |
31 |
Illumina NextSeq 500 (Homo sapiens);Illumina NextSeq 500 (Mus musculus) |
|
GSE173897
|
RNA-seq |
95 |
Illumina HiSeq 4000 (Homo sapiens) |
|
GSE262515
|
RNA-seq |
21 |
Illumina HiSeq 2500 (Homo sapiens);Illumina HiSeq 2500 (Mus musculus) |
|
GSE110345
|
RNA-seq |
4 |
Illumina HiSeq 2500 (Homo sapiens) |
|
C GSE131257
|
ATAC-seq;RNA-seq |
19 |
Illumina HiSeq 2500 (Homo sapiens) |
|
GSE94660
|
RNA-seq |
42 |
Illumina HiSeq 2500 (Homo sapiens) |
When the gene can detect a peak in the dataset, a peak plot will be displayed.
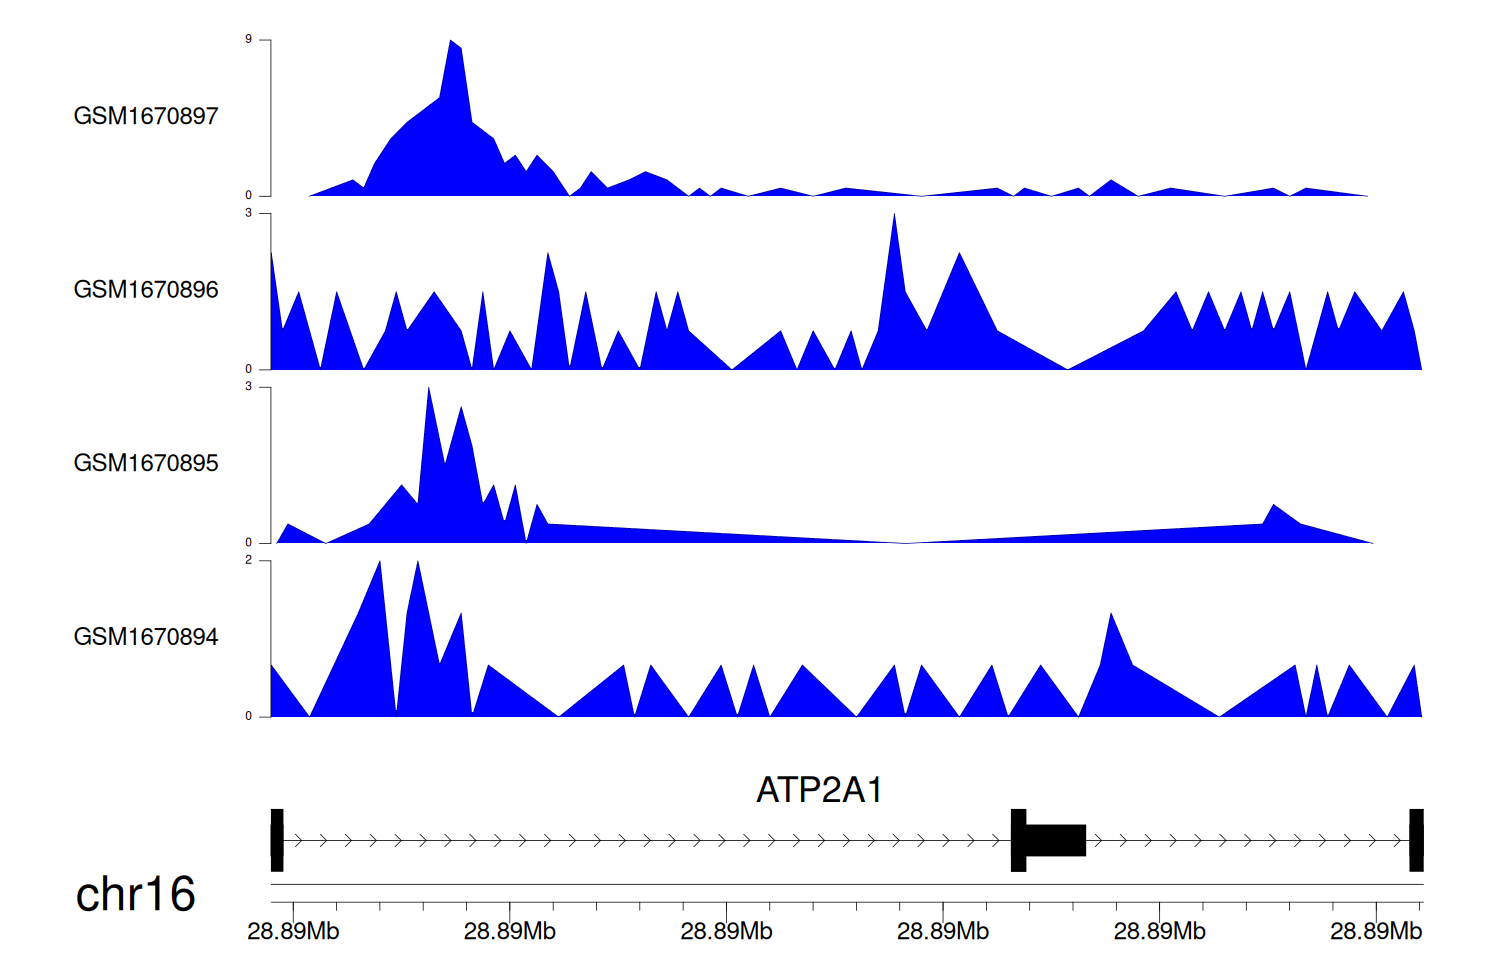
> Dataset: GSE68402 - ATP2A1 peak across samples
|
Peak Plot
|
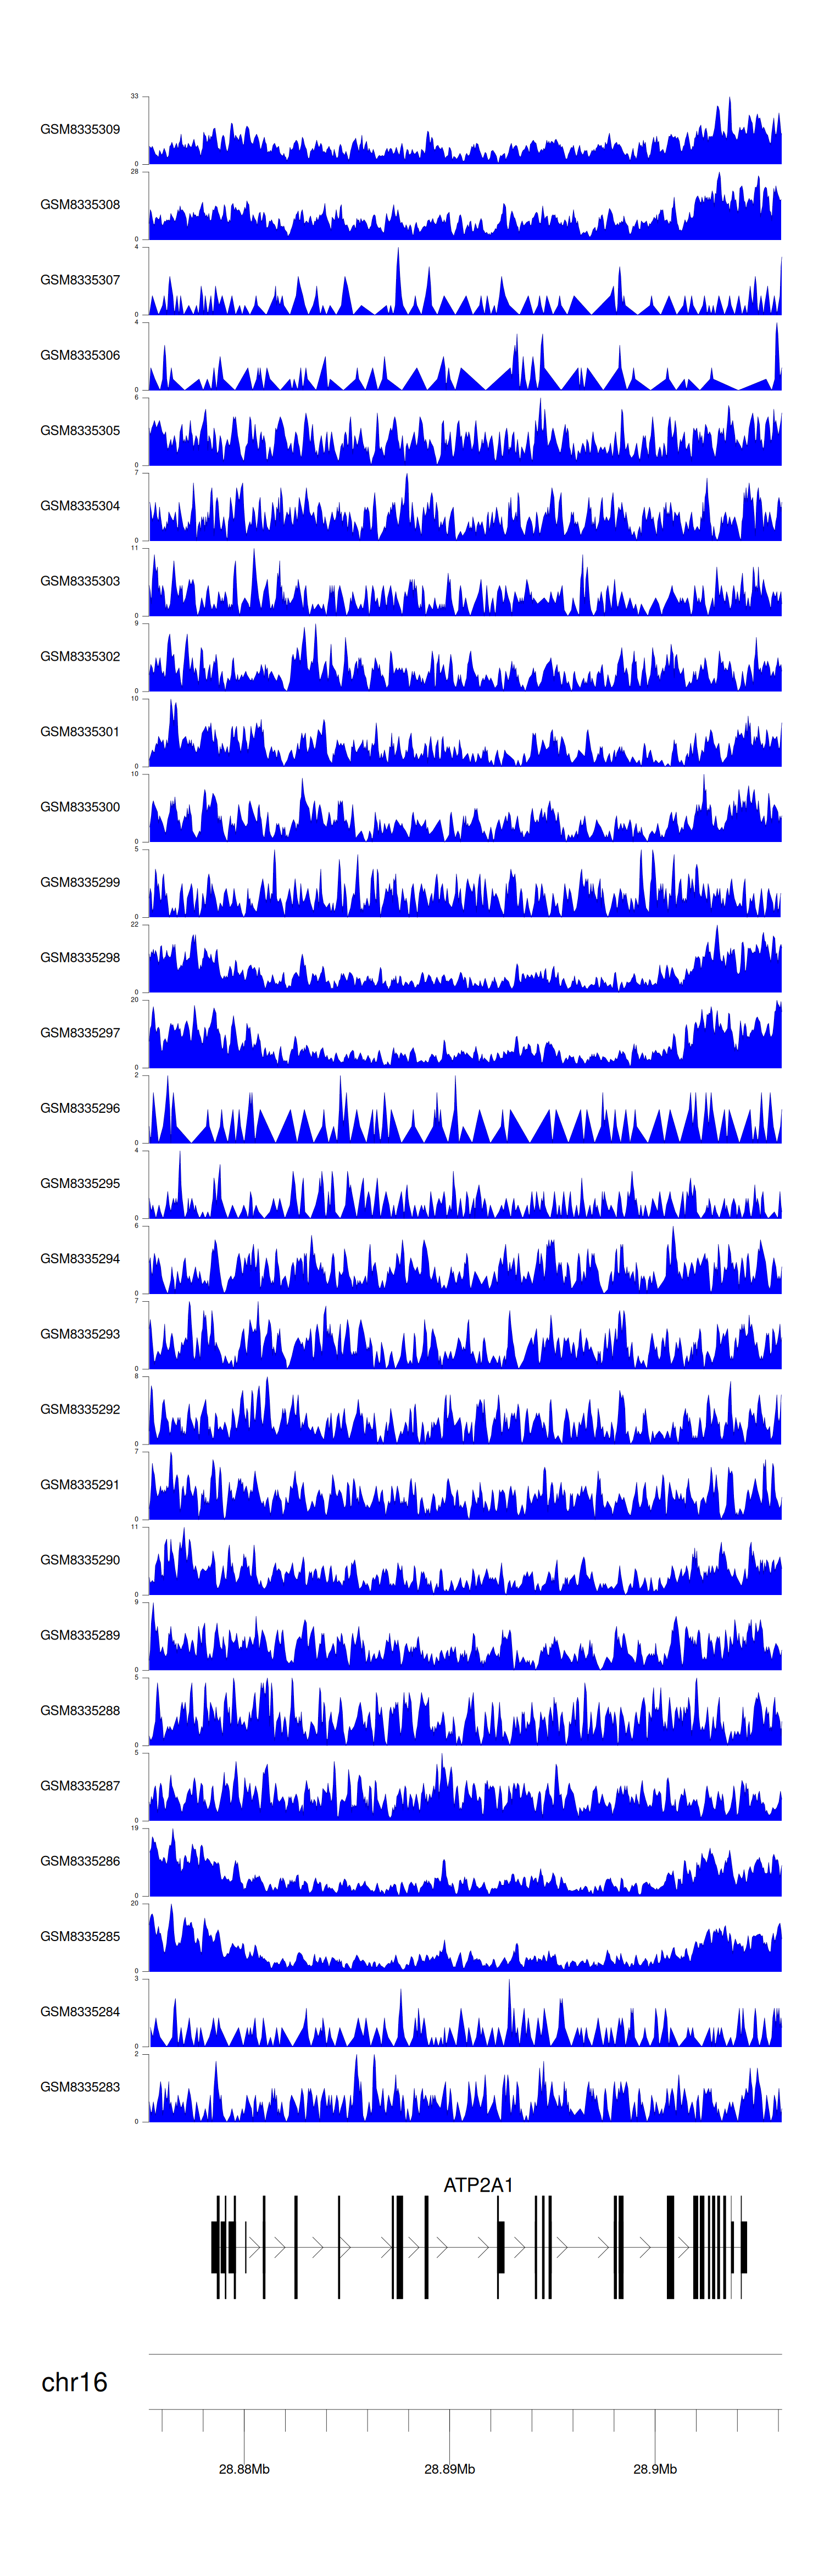
> Dataset: GSE270130 - ATP2A1 peak across samples
|
Peak Plot
|
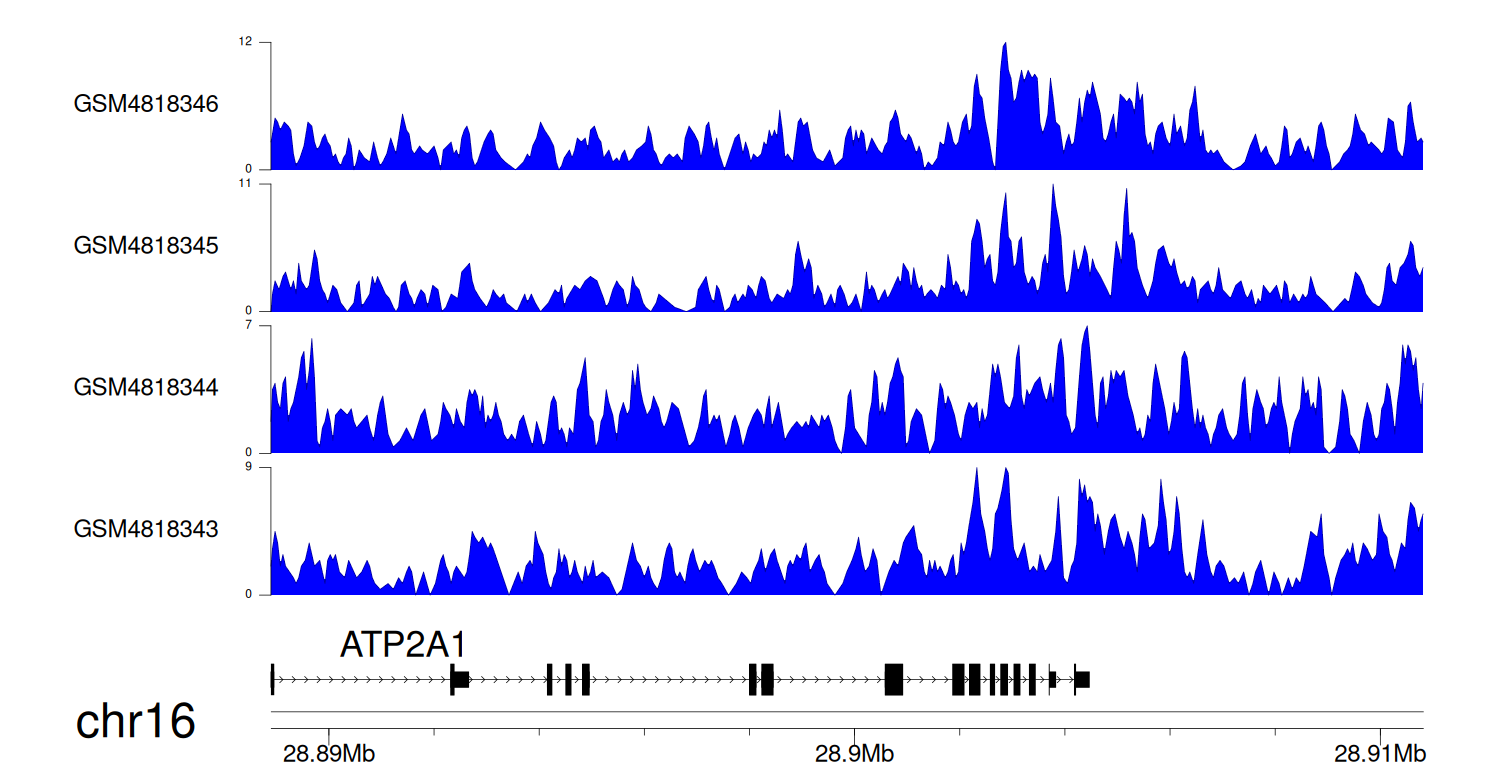
> Dataset: GSE131257 - ATP2A1 peak across samples
|
Peak Plot
|
|
|
