Gene Information
|
Gene Name
|
ATP5F1C |
|
Gene ID
|
509
|
|
Gene Full Name
|
ATP synthase F1 subunit gamma |
|
Gene Alias
|
ATP5C|ATP5C1|ATP5CL1 |
|
Transcripts
|
ENSG00000165629
|
|
Virus
|
HTLV1 |
|
Gene Type
|
protein-coding |
|
HPA Location Info
|

|
|
Membrane Info
|
Metabolic proteins, Plasma proteins, Predicted intracellular proteins, Transporters |
|
Uniport_ID
|
P36542
|
|
HGNC ID
|
HGNC:833
|
|
OMIM ID
|
108729 |
|
Summary
|
This gene encodes a subunit of mitochondrial ATP synthase. Mitochondrial ATP synthase catalyzes ATP synthesis, utilizing an electrochemical gradient of protons across the inner membrane during oxidative phosphorylation. ATP synthase is composed of two linked multi-subunit complexes: the soluble catalytic core, F1, and the membrane-spanning component, Fo, comprising the proton channel. The catalytic portion of mitochondrial ATP synthase consists of 5 different subunits (alpha, beta, gamma, delta, and epsilon) assembled with a stoichiometry of 3 alpha, 3 beta, and a single representative of the other 3. The proton channel consists of three main subunits (a, b, c). This gene encodes the gamma subunit of the catalytic core. Alternatively spliced transcript variants encoding different isoforms have been identified. This gene also has a pseudogene on chromosome 14. [provided by RefSeq, Jul 2008] |
Target gene [ATP5F1C] related to VISs 
Integration Table: if previous studies reported that target gene was altered by virus integration events, the overlap between VISs in this literature and Cistrome factors was listed in this section
| DVID |
Chromosome |
HM |
TFBS |
CA |
Sum of Overlapped Records |
Detail |
| 6006316 |
chr10 |
2 |
60 |
9 |
71 |
View |
Target gene [ATP5F1C] related to Omics data
| Data ID |
Experiment type |
Sample number |
Platform |
|
GSE52244
|
Expression array |
15 |
[HuEx-1_0-st] Affymetrix Human Exon 1.0 ST Array [probe set (exon) version] |
|
GSE224047
|
RNA-seq |
10 |
Illumina NextSeq 500 (Homo sapiens) |
|
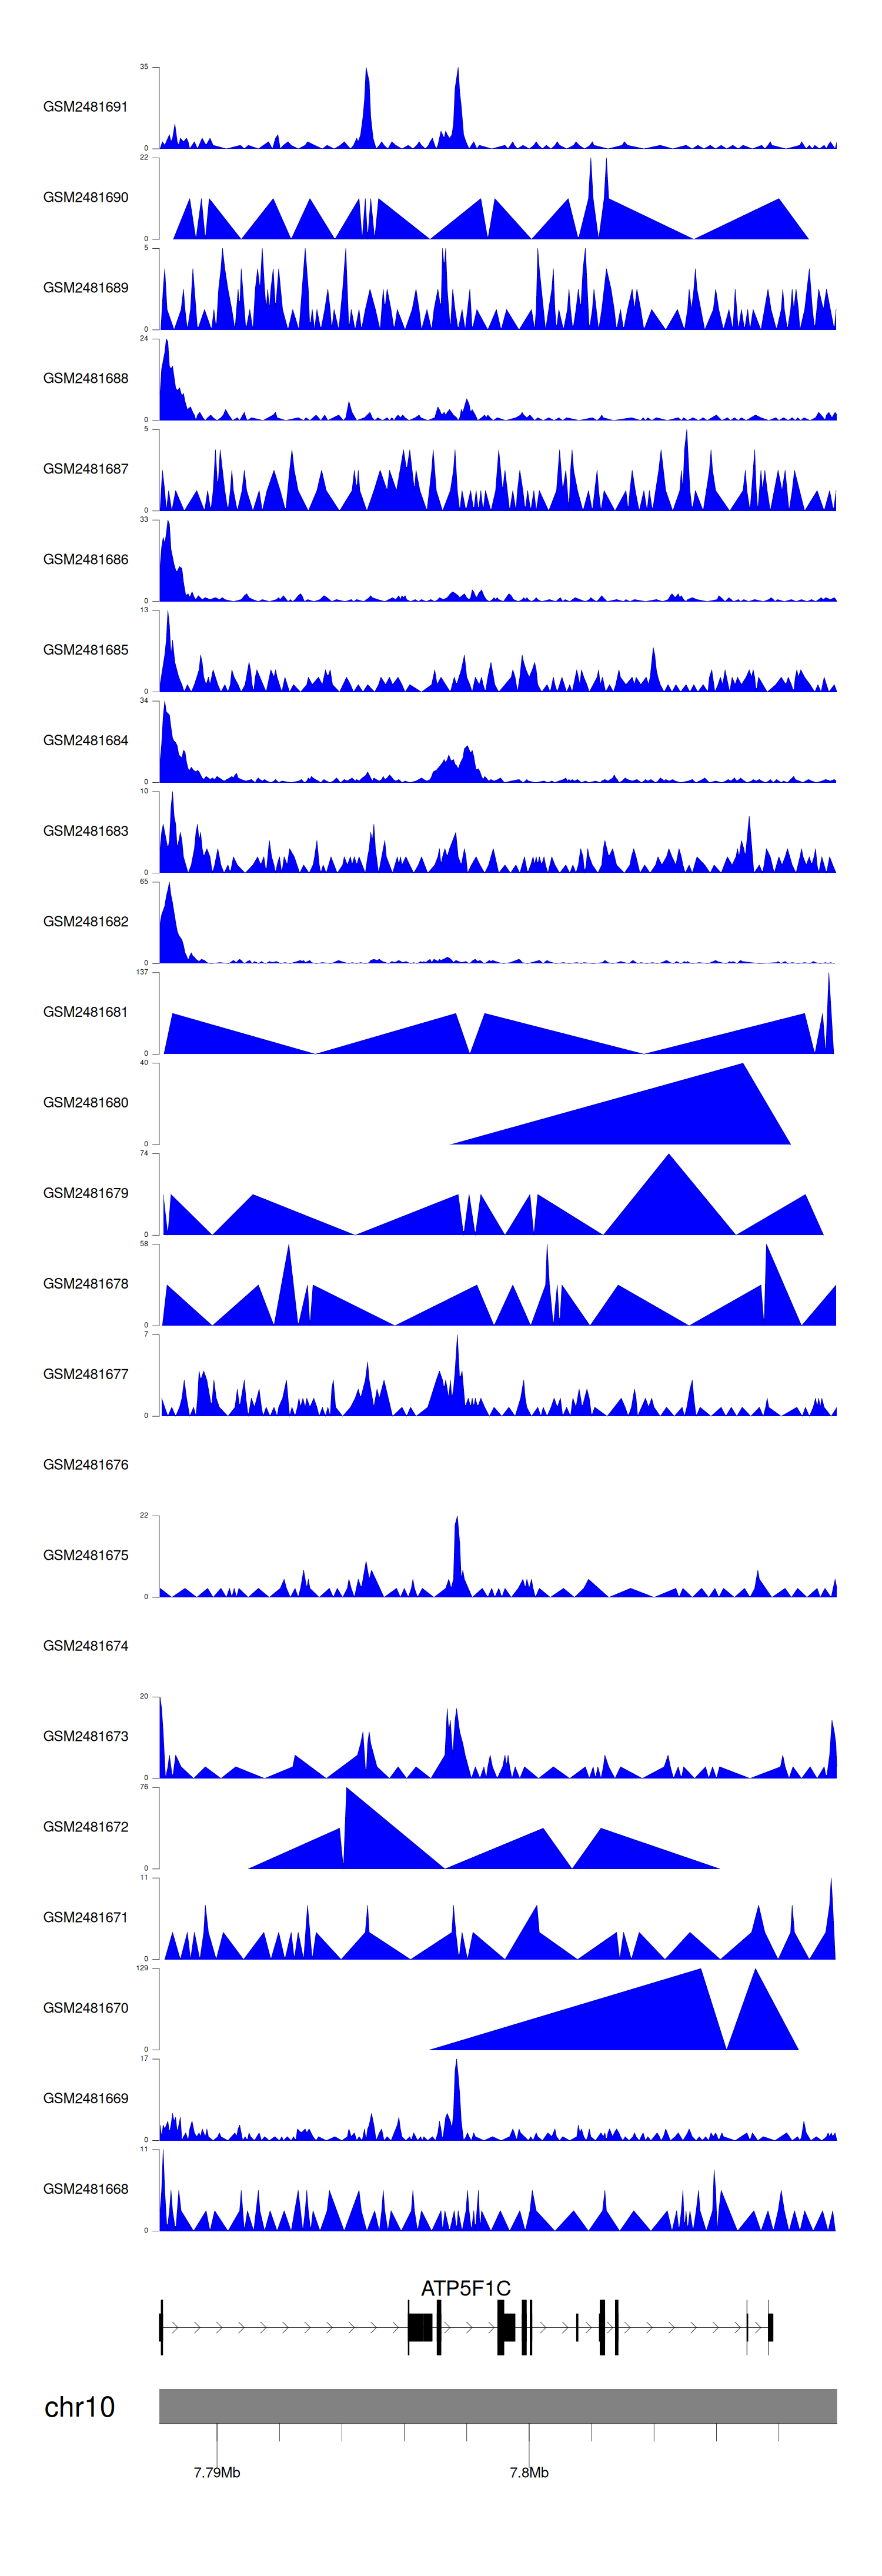
C GSE94732
|
Chip-seq |
24 |
Illumina NextSeq 500 (Homo sapiens);illumina Genome Analyzer IIx (Homo sapiens) |
When the gene can detect a peak in the dataset, a peak plot will be displayed.
> Dataset: GSE94732 - ATP5F1C peak across samples
|
Peak Plot
|
|
|
