Gene Information
|
Gene Name
|
B9D1 |
|
Gene ID
|
27077
|
|
Gene Full Name
|
B9 domain containing 1 |
|
Gene Alias
|
B9|EPPB9|JBTS27|MKS9|MKSR-1|MKSR1 |
|
Transcripts
|
ENSG00000108641
|
|
Virus
|
HBV |
|
Gene Type
|
protein-coding |
|
HPA Location Info
|
Nucleoplasm, Acrosome, Equatorial segment, Mid piece;Vesicles, Basal body, Cytosol, Principal piece, End piece; 
|
|
Membrane Info
|
Disease related genes, Human disease related genes, Predicted intracellular proteins |
|
Uniport_ID
|
Q9UPM9
|
|
HGNC ID
|
HGNC:24123
|
|
OMIM ID
|
614144 |
|
Summary
|
This gene encodes a B9 domain-containing protein, one of several that are involved in ciliogenesis. Alterations in expression of this gene have been found in a family with Meckel syndrome. Meckel syndrome has been associated with at least six different genes. This gene is located within the Smith-Magenis syndrome region on chromosome 17. [provided by RefSeq, Mar 2016] |
Target gene [B9D1] related to VISs 
Integration Table: if previous studies reported that target gene was altered by virus integration events, the overlap between VISs in this literature and Cistrome factors was listed in this section
| DVID |
Chromosome |
HM |
TFBS |
CA |
Sum of Overlapped Records |
Detail |
| 1042251 |
chr17 |
17 |
15 |
1 |
33 |
View |
| 1042252 |
chr17 |
294 |
27 |
9 |
330 |
View |
Target gene [B9D1] related to Omics data
| Data ID |
Experiment type |
Sample number |
Platform |
|
GSE236281
|
RNA-seq |
12 |
Illumina MiSeq (Homo sapiens) |
|
C GSE35465
|
Chip-seq;RNA-seq |
6 |
Illumina HiSeq 2000 (Homo sapiens) |
|
GSE199850
|
scRNA-seq |
1 |
HiSeq X Ten (Homo sapiens) |
|
C GSE68402
|
Chip-seq |
26 |
Illumina MiSeq (Homo sapiens);Illumina HiSeq 2500 (Homo sapiens) |
|
TCGA_LIHC_HBV
|
DNA methylation sequencing;RNA-seq |
97 |
TCGA |
|
C GSE270130
|
Chip-seq |
27 |
Illumina NovaSeq 6000 (Homo sapiens) |
|
GSE224901
|
RNA-seq |
21 |
Illumina NovaSeq 6000 (Homo sapiens) |
|
GSE100400
|
Chip-seq;RNA-seq;4C_cccDNA |
31 |
Illumina NextSeq 500 (Homo sapiens);Illumina NextSeq 500 (Mus musculus) |
|
GSE173897
|
RNA-seq |
95 |
Illumina HiSeq 4000 (Homo sapiens) |
|
GSE262515
|
RNA-seq |
21 |
Illumina HiSeq 2500 (Homo sapiens);Illumina HiSeq 2500 (Mus musculus) |
|
GSE110345
|
RNA-seq |
4 |
Illumina HiSeq 2500 (Homo sapiens) |
|
C GSE131257
|
ATAC-seq;RNA-seq |
19 |
Illumina HiSeq 2500 (Homo sapiens) |
|
GSE94660
|
RNA-seq |
42 |
Illumina HiSeq 2500 (Homo sapiens) |
When the gene can detect a peak in the dataset, a peak plot will be displayed.
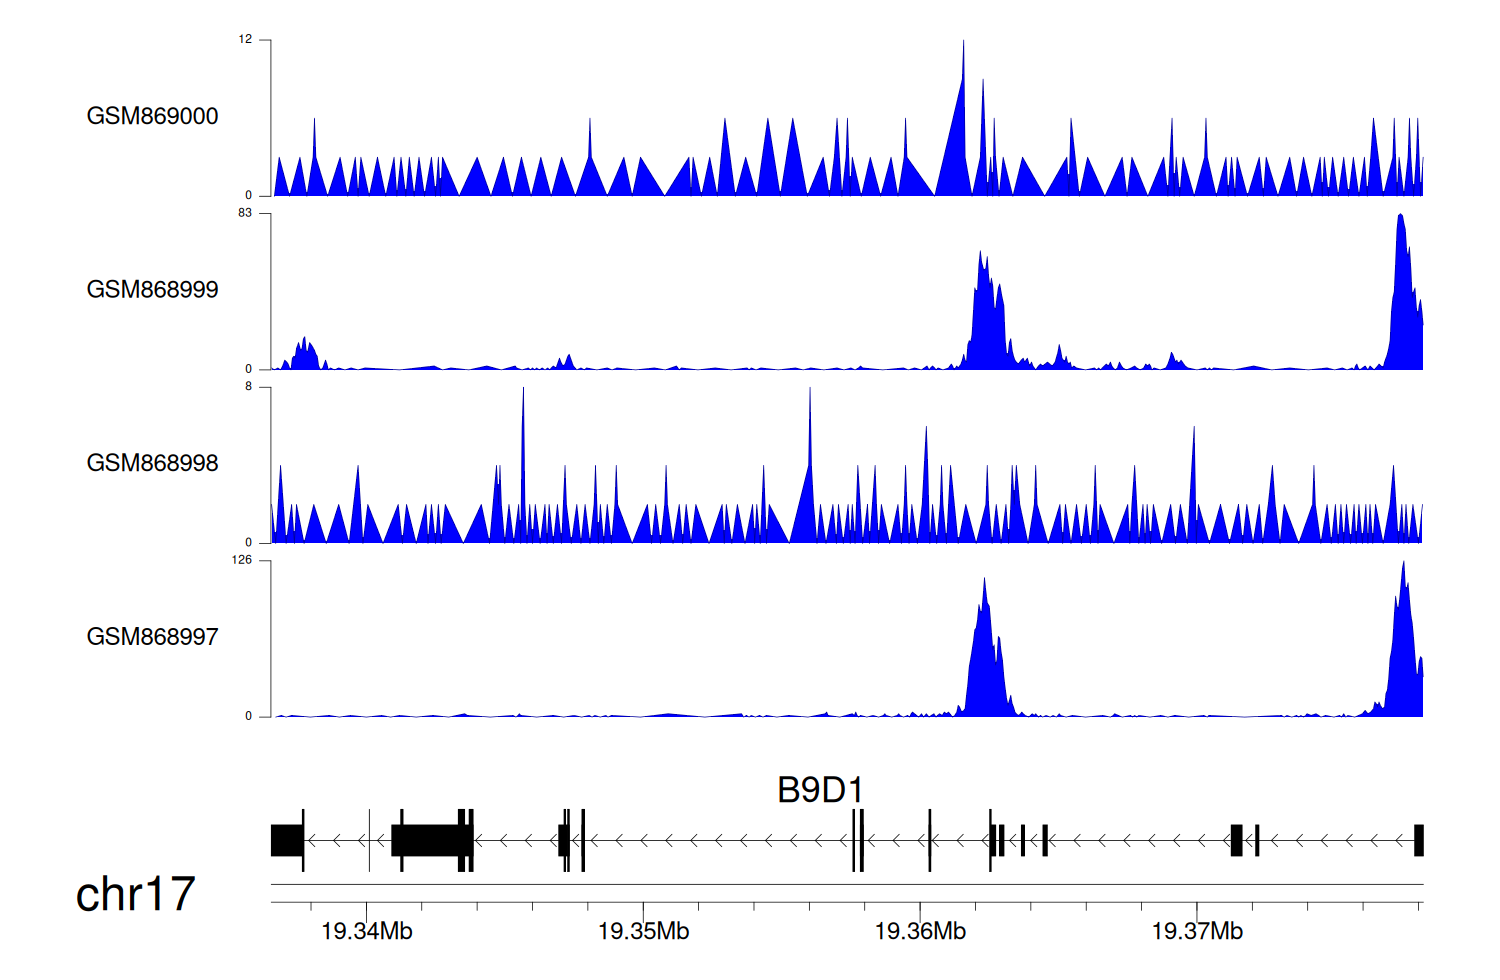
> Dataset: GSE35465 - B9D1 peak across samples
|
Peak Plot
|
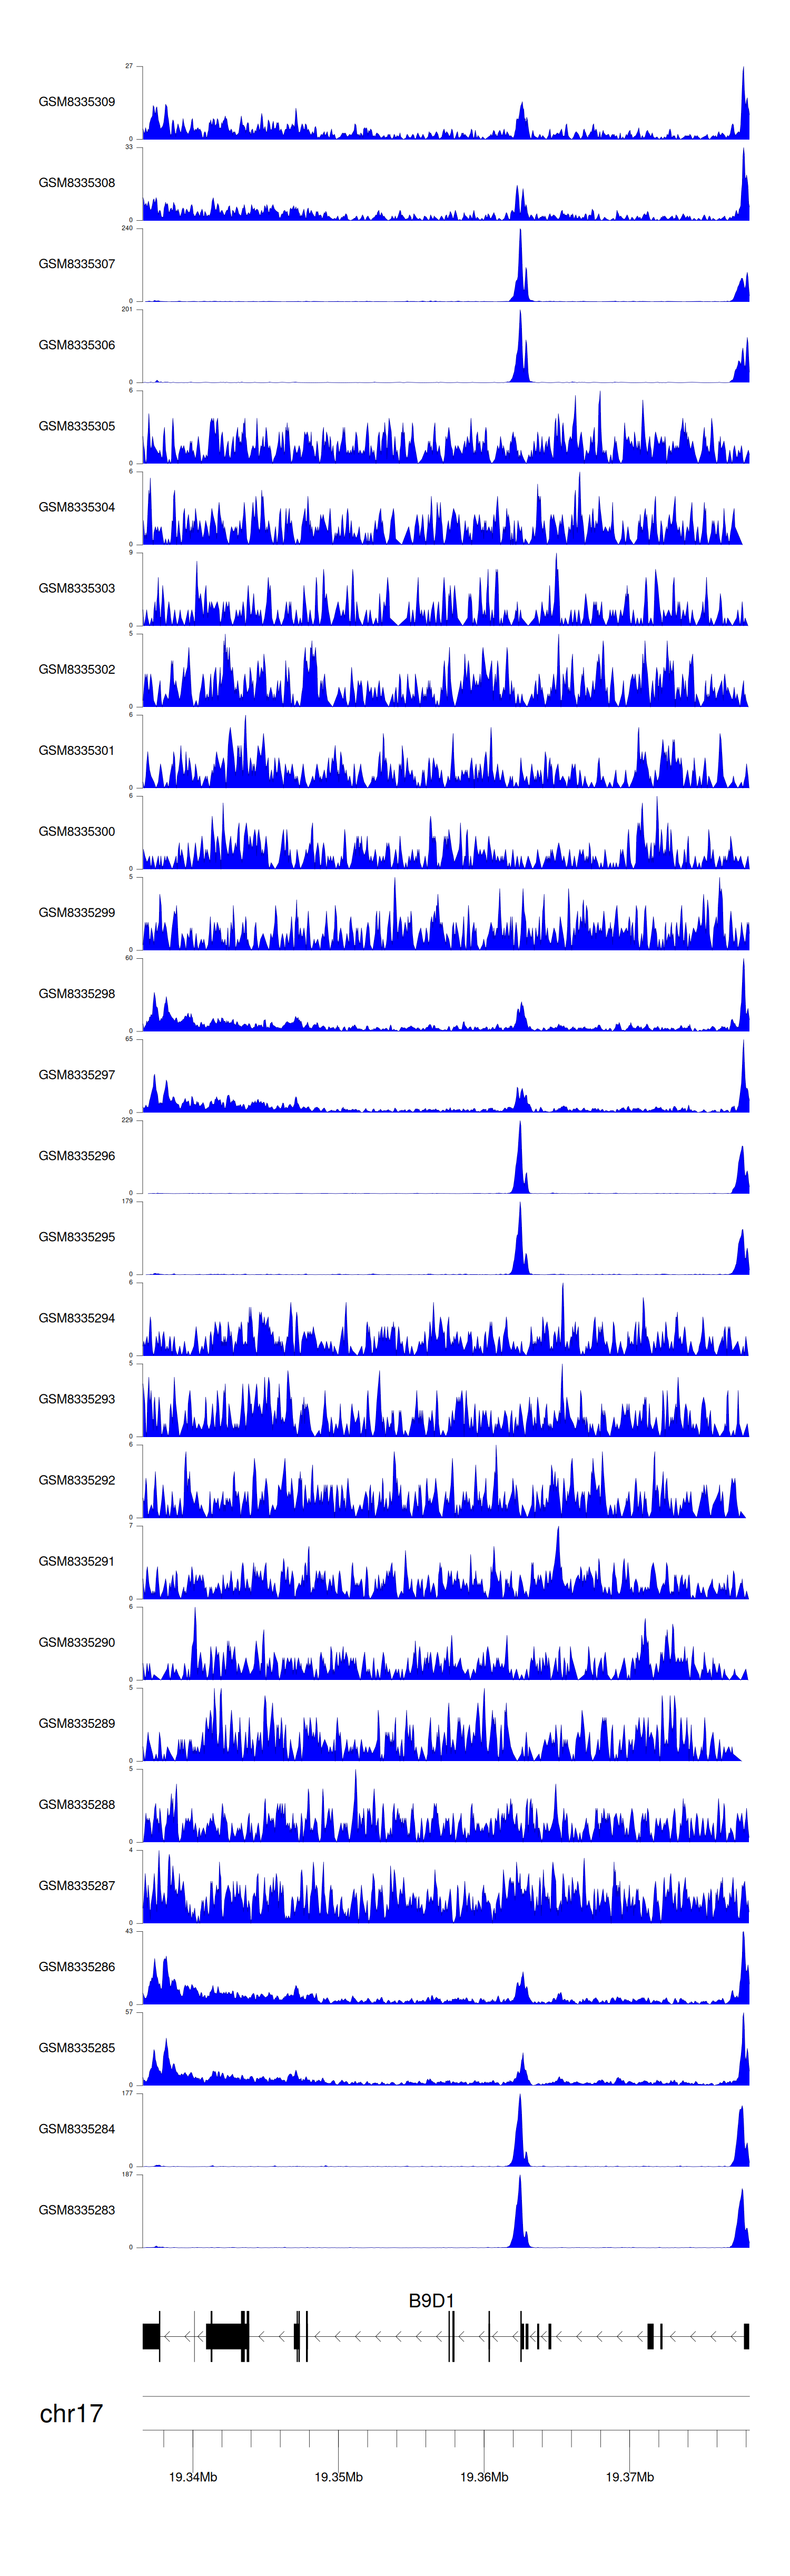
> Dataset: GSE68402 - B9D1 peak across samples
|
Peak Plot
|
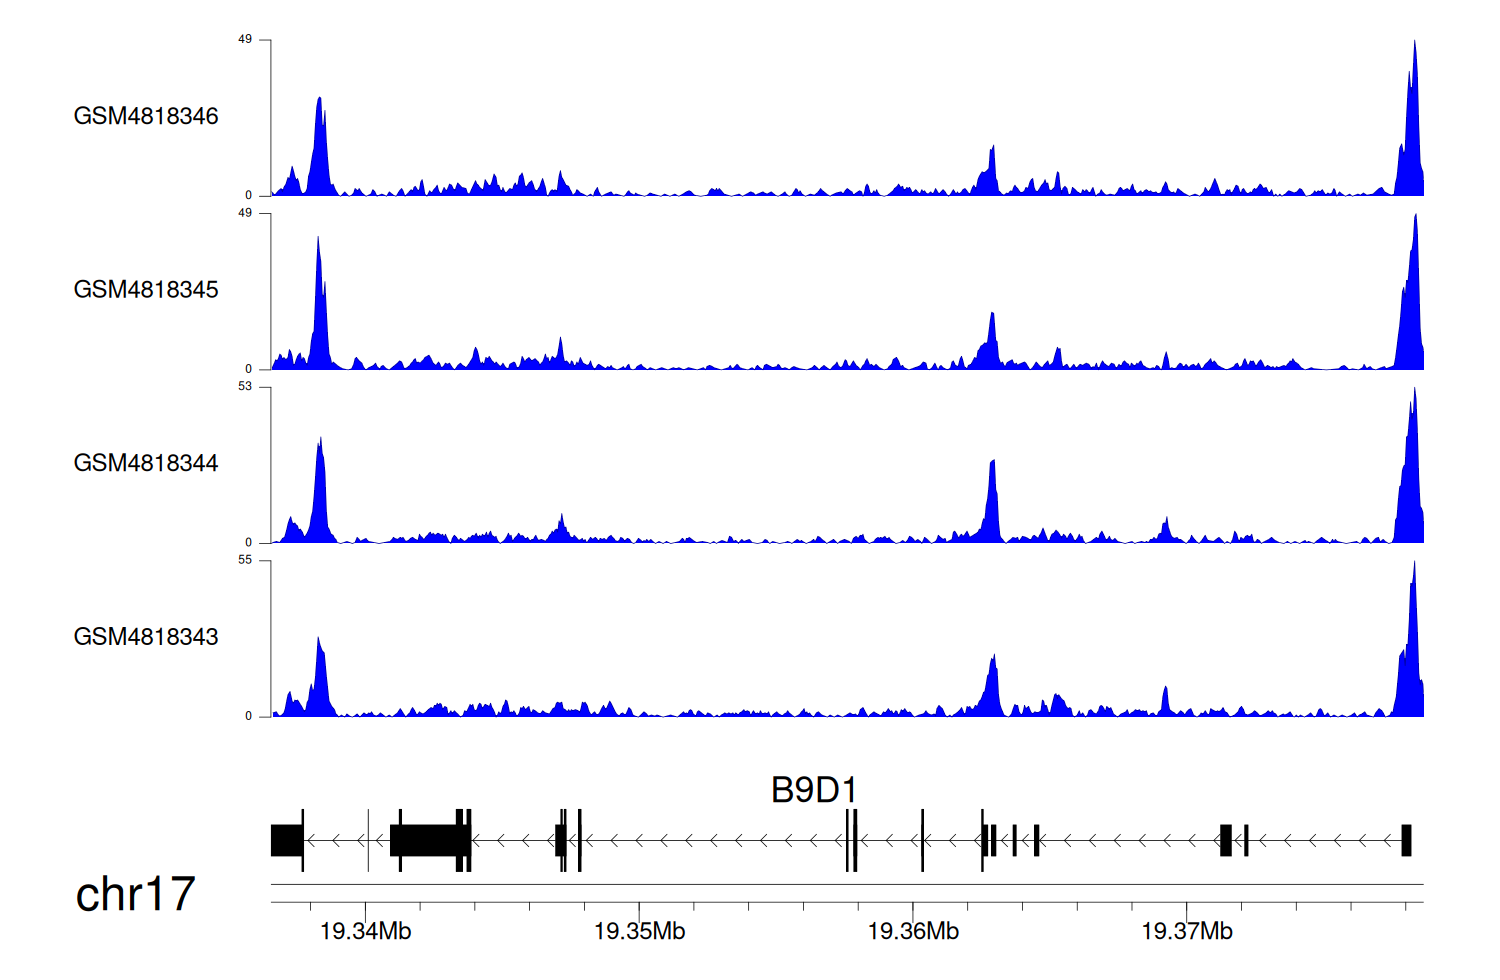
> Dataset: GSE270130 - B9D1 peak across samples
|
Peak Plot
|
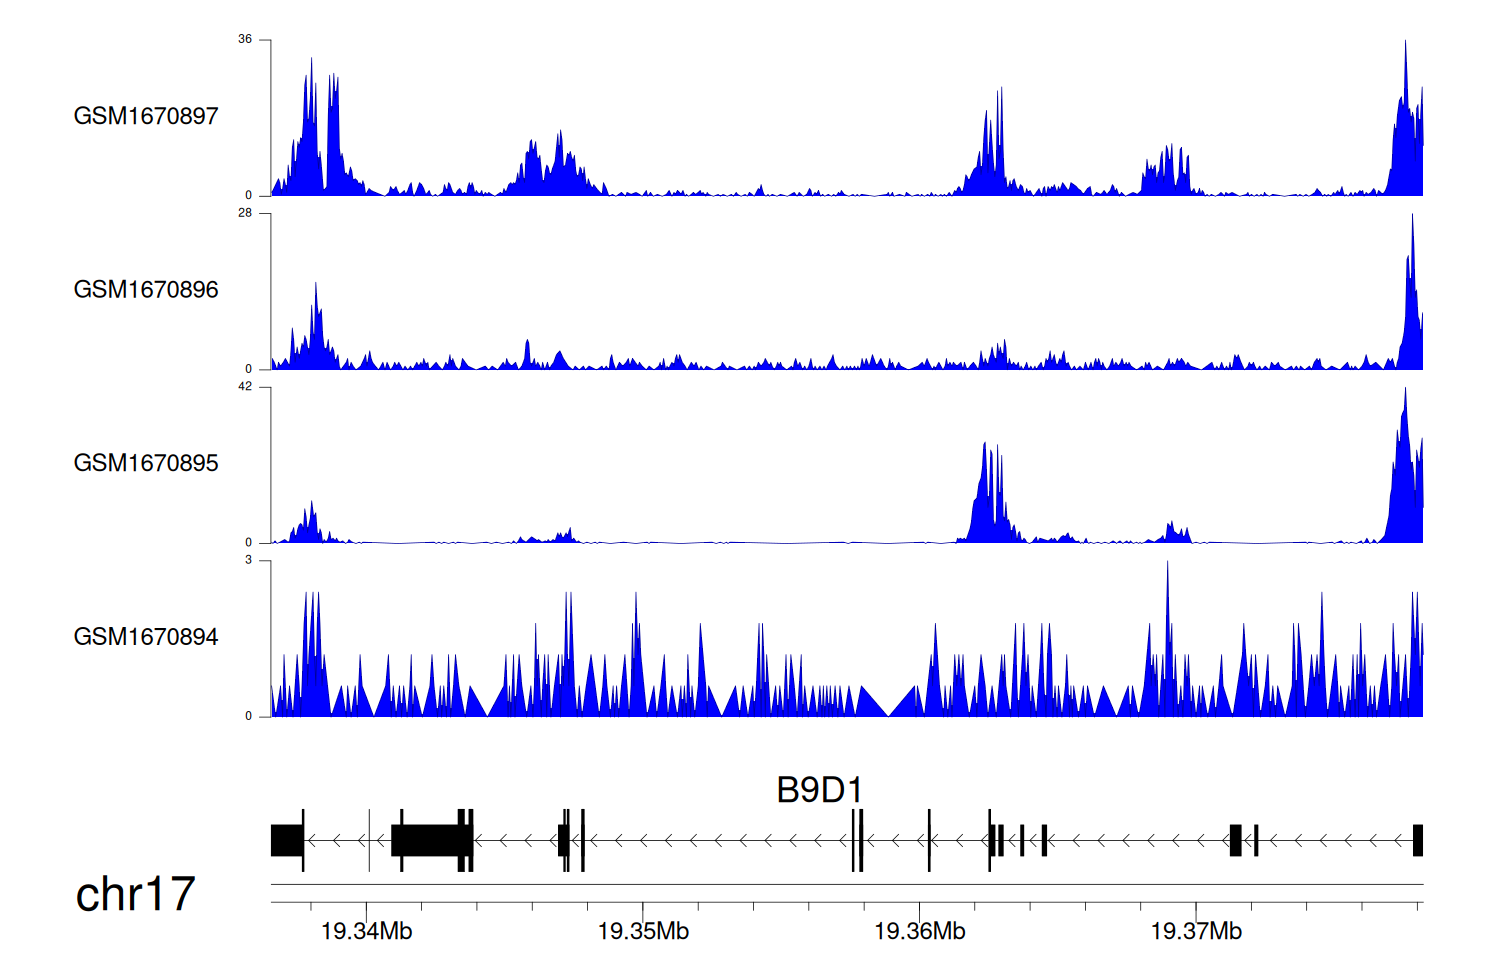
> Dataset: GSE131257 - B9D1 peak across samples
|
Peak Plot
|
|
|
