Gene Information
|
Gene Name
|
BORCS7-ASMT |
|
Gene ID
|
100528007
|
|
Gene Full Name
|
BORCS7-ASMT readthrough (NMD candidate) |
|
Gene Alias
|
C10orf32-AS3MT|C10orf32-ASMT |
|
Virus
|
HBV |
|
Gene Type
|
ncRNA |
|
HGNC ID
|
HGNC:49183
|
|
Summary
|
This locus represents naturally occurring read-through transcription between the neighboring C10orf32 (chromosome 10 open reading frame 32) and AS3MT (arsenic, +3 oxidation state, methyltransferase) genes. The read-through transcript is a candidate for nonsense-mediated mRNA decay (NMD), and is therefore unlikely to produce a protein product. [provided by RefSeq, Dec 2010] |
Target gene [BORCS7-ASMT] related to VISs 
Integration Table: if previous studies reported that target gene was altered by virus integration events, the overlap between VISs in this literature and Cistrome factors was listed in this section
| DVID |
Chromosome |
HM |
TFBS |
CA |
Sum of Overlapped Records |
Detail |
| 1039037 |
chr10 |
9 |
6 |
0 |
15 |
View |
Target gene [BORCS7-ASMT] related to Omics data
| Data ID |
Experiment type |
Sample number |
Platform |
|
GSE236281
|
RNA-seq |
12 |
Illumina MiSeq (Homo sapiens) |
|
C GSE35465
|
Chip-seq;RNA-seq |
6 |
Illumina HiSeq 2000 (Homo sapiens) |
|
C GSE68402
|
Chip-seq |
26 |
Illumina MiSeq (Homo sapiens);Illumina HiSeq 2500 (Homo sapiens) |
|
TCGA_LIHC_HBV
|
DNA methylation sequencing;RNA-seq |
97 |
TCGA |
|
GSE224901
|
RNA-seq |
21 |
Illumina NovaSeq 6000 (Homo sapiens) |
|
GSE100400
|
Chip-seq;RNA-seq;4C_cccDNA |
31 |
Illumina NextSeq 500 (Homo sapiens);Illumina NextSeq 500 (Mus musculus) |
|
C GSE131257
|
ATAC-seq;RNA-seq |
19 |
Illumina HiSeq 2500 (Homo sapiens) |
|
C GSE270130
|
Chip-seq |
27 |
Illumina NovaSeq 6000 (Homo sapiens) |
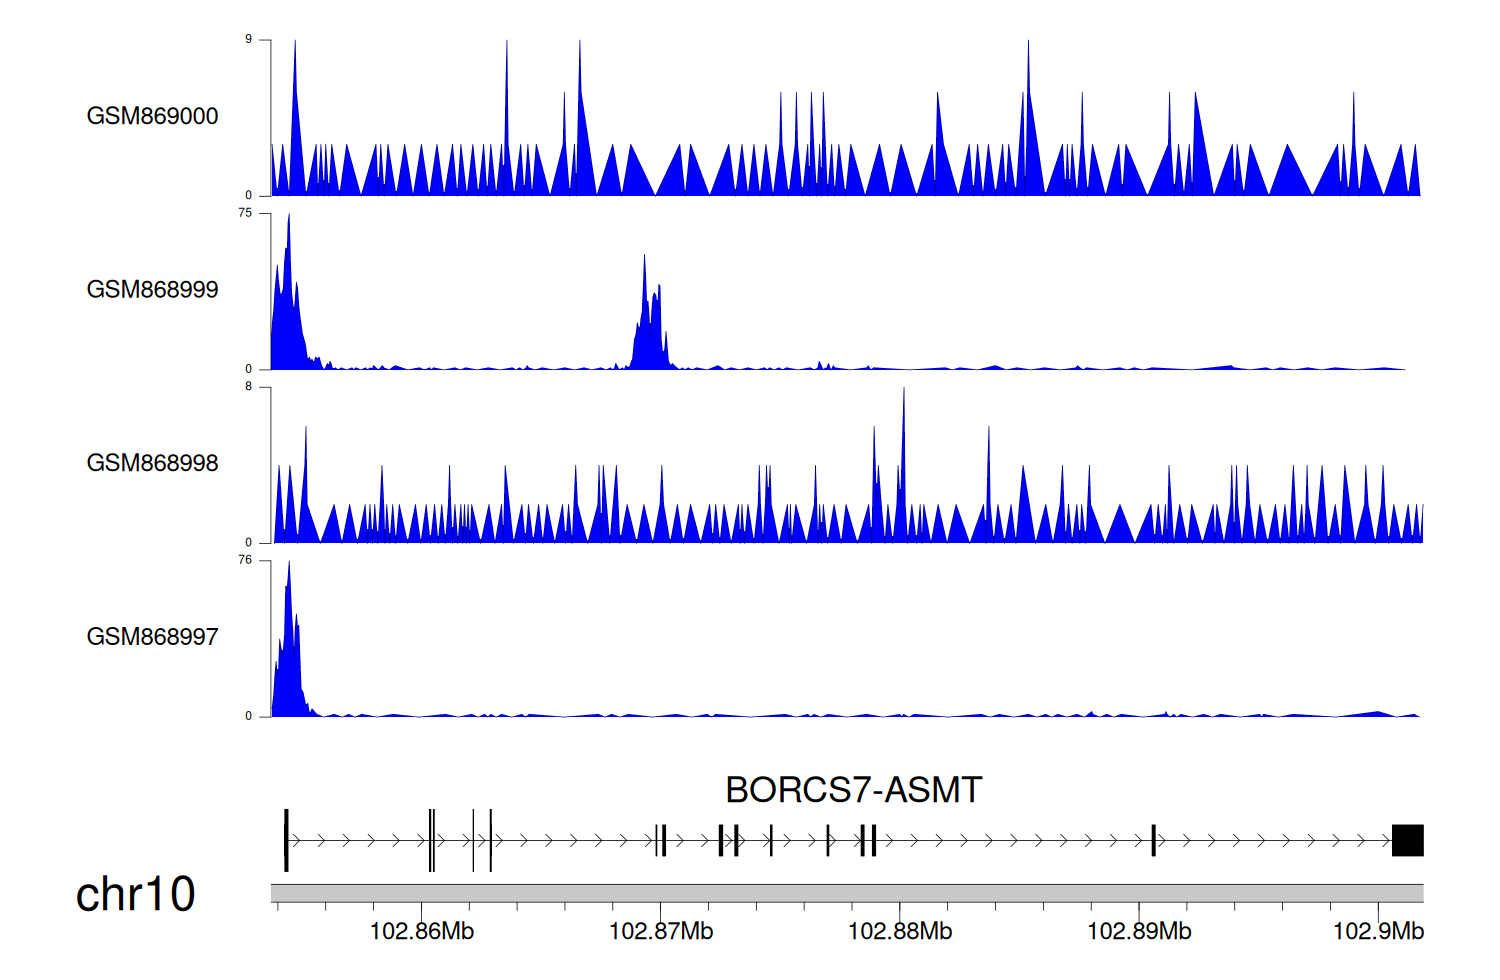
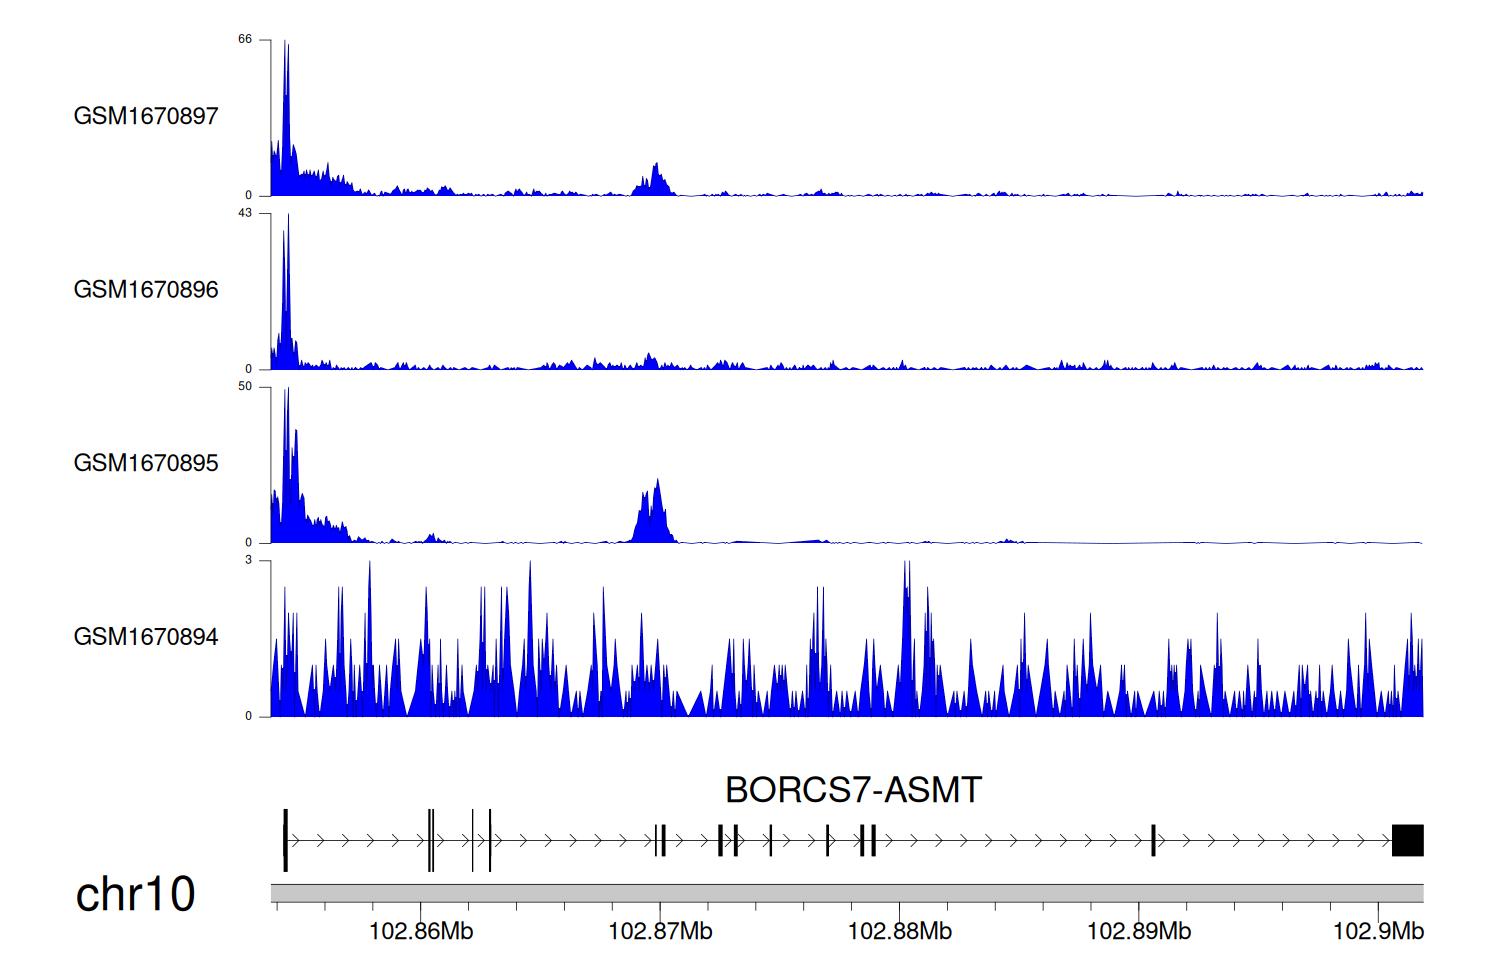
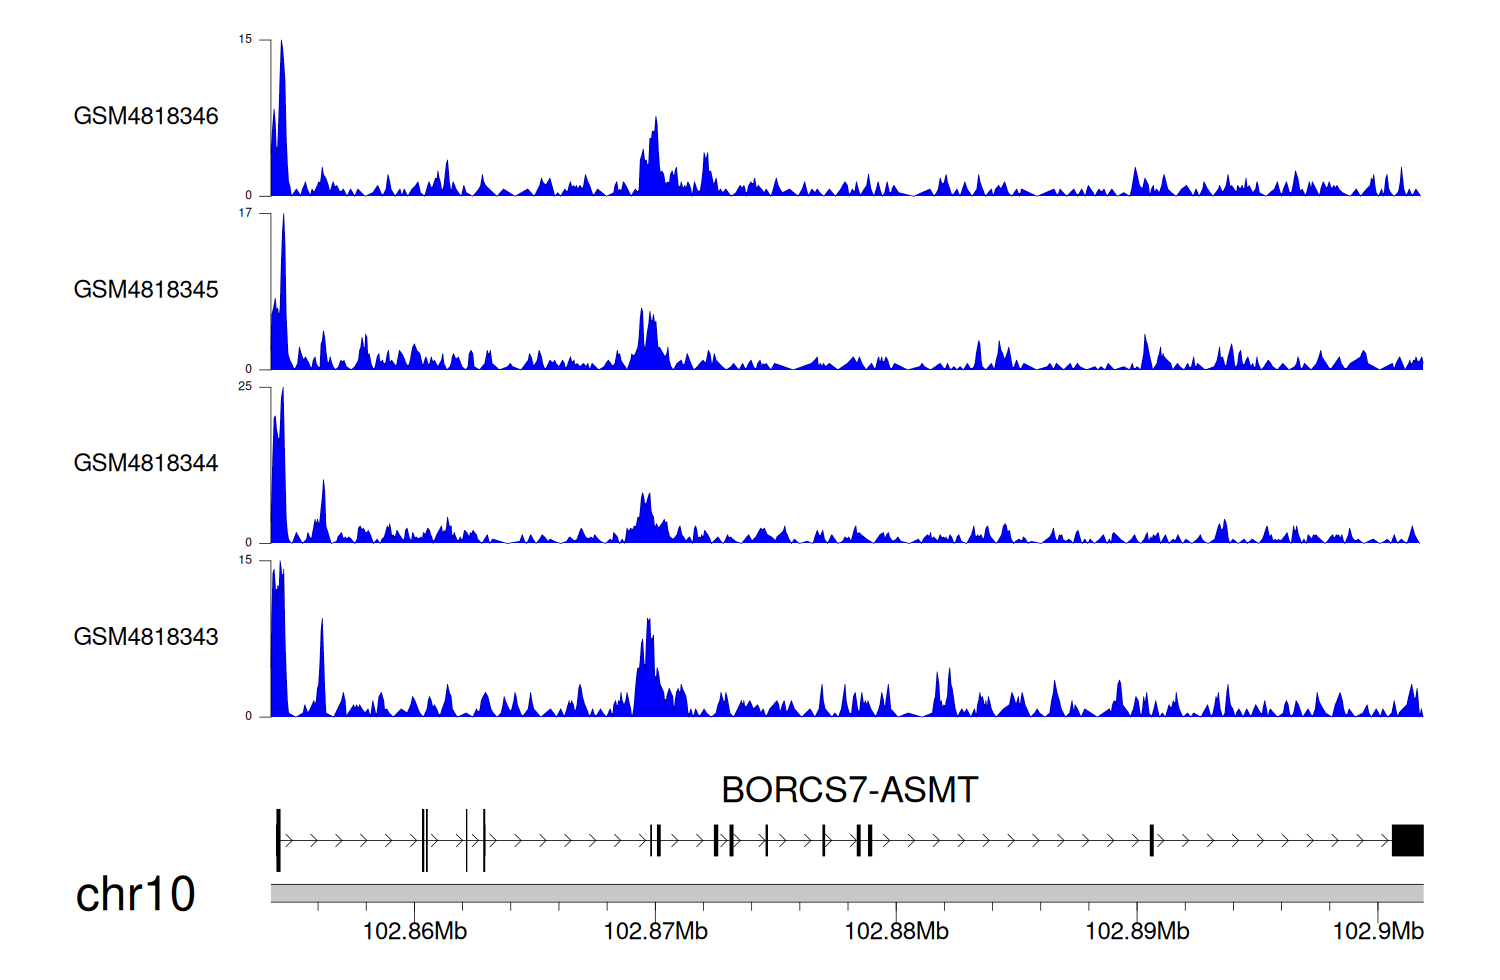
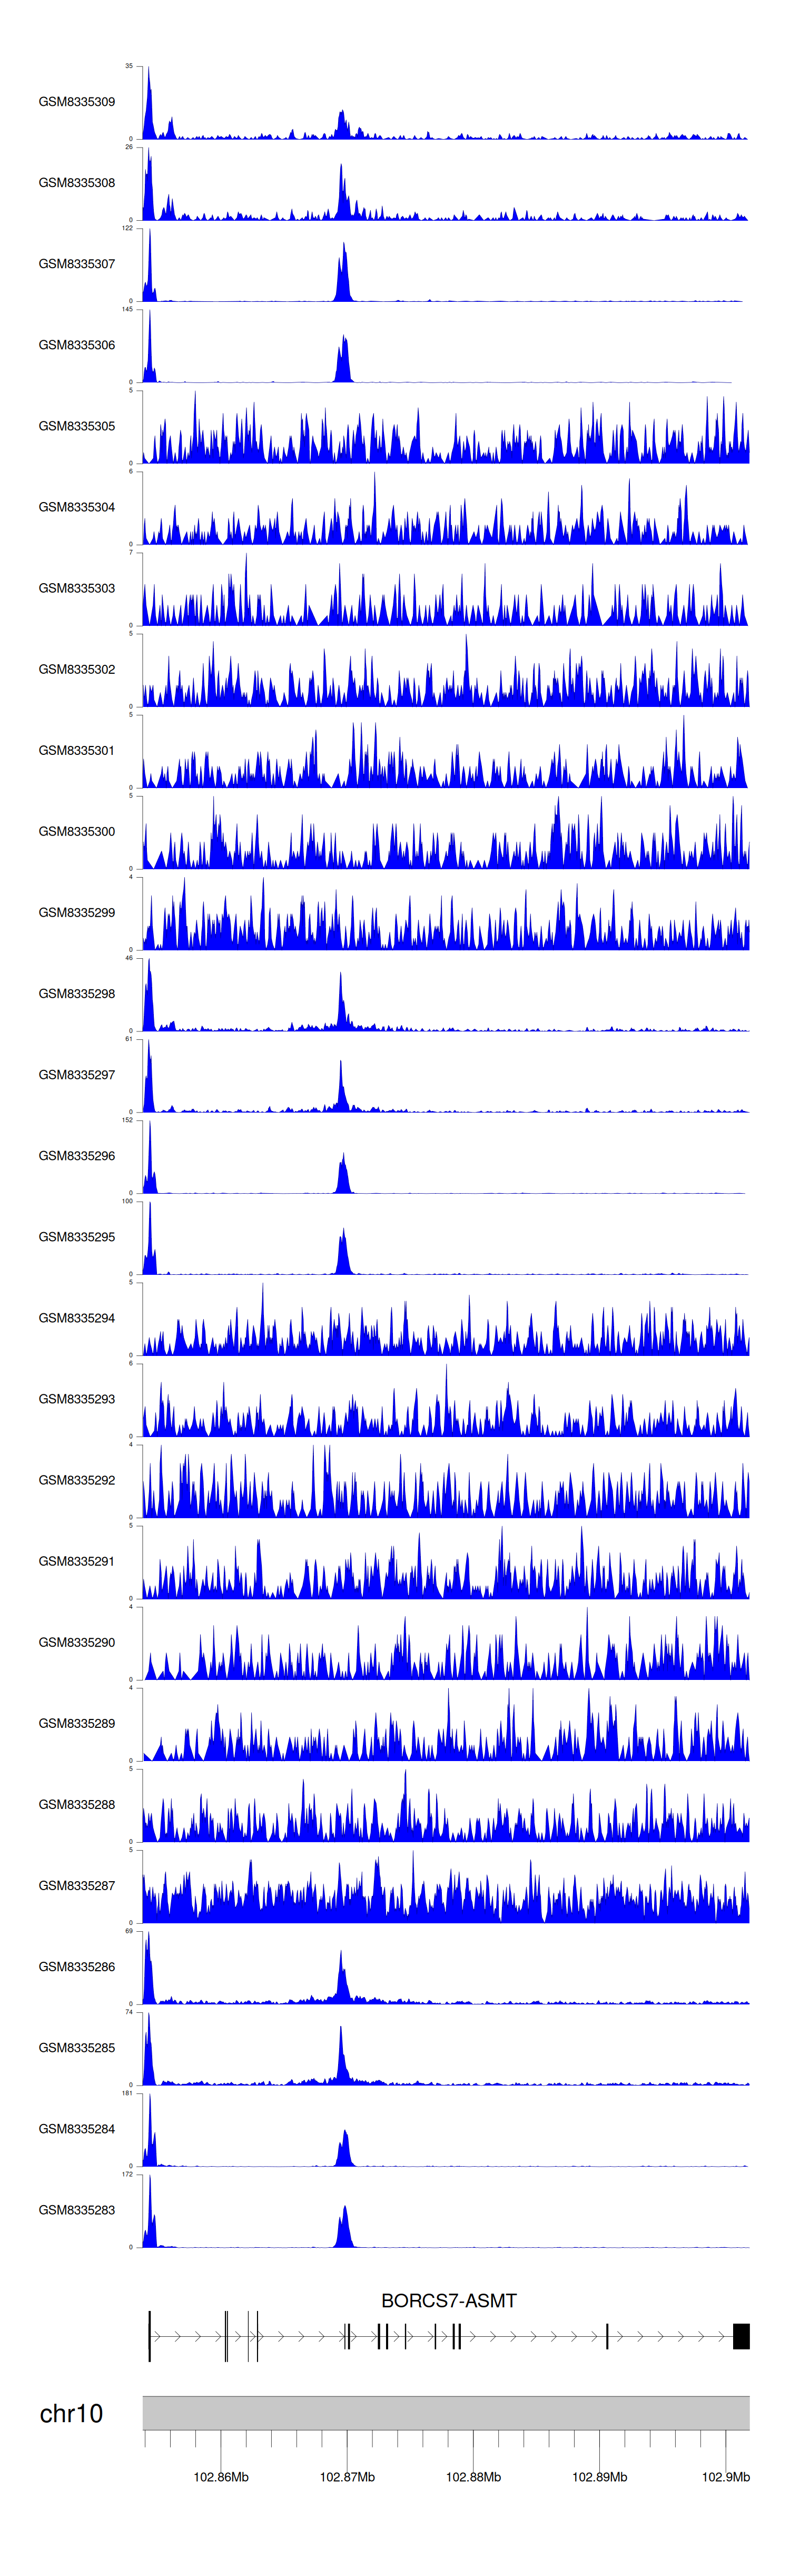
When the gene can detect a peak in the dataset, a peak plot will be displayed.
> Dataset: GSE35465 - BORCS7-ASMT peak across samples
|
Peak Plot
|
> Dataset: GSE68402 - BORCS7-ASMT peak across samples
|
Peak Plot
|
> Dataset: GSE131257 - BORCS7-ASMT peak across samples
|
Peak Plot
|
> Dataset: GSE270130 - BORCS7-ASMT peak across samples
|
Peak Plot
|
|
|
