Gene Information
|
Gene Name
|
C3 |
|
Gene ID
|
718
|
|
Gene Full Name
|
complement C3 |
|
Gene Alias
|
AHUS5|ARMD9|ASP|C3a|C3b|CPAMD1|HEL-S-62p |
|
Transcripts
|
ENSG00000125730
|
|
Virus
|
HBV |
|
Gene Type
|
protein-coding |
|
HPA Location Info
|
Secreted to blood; 
|
|
Membrane Info
|
Candidate cardiovascular disease genes, Disease related genes, FDA approved drug targets, Human disease related genes, Plasma proteins, Predicted intracellular proteins, Predicted secreted proteins |
|
Uniport_ID
|
P01024
|
|
HGNC ID
|
HGNC:1318
|
|
OMIM ID
|
120700 |
|
Summary
|
Complement component C3 plays a central role in the activation of complement system. Its activation is required for both classical and alternative complement activation pathways. The encoded preproprotein is proteolytically processed to generate alpha and beta subunits that form the mature protein, which is then further processed to generate numerous peptide products. The C3a peptide, also known as the C3a anaphylatoxin, modulates inflammation and possesses antimicrobial activity. Mutations in this gene are associated with atypical hemolytic uremic syndrome and age-related macular degeneration in human patients. [provided by RefSeq, Nov 2015] |
Target gene [C3] related to VISs 
Integration Table: if previous studies reported that target gene was altered by virus integration events, the overlap between VISs in this literature and Cistrome factors was listed in this section
Target gene [C3] related to Omics data
| Data ID |
Experiment type |
Sample number |
Platform |
|
GSE236281
|
RNA-seq |
12 |
Illumina MiSeq (Homo sapiens) |
|
C GSE35465
|
Chip-seq;RNA-seq |
6 |
Illumina HiSeq 2000 (Homo sapiens) |
|
C GSE68402
|
Chip-seq |
26 |
Illumina MiSeq (Homo sapiens);Illumina HiSeq 2500 (Homo sapiens) |
|
TCGA_LIHC_HBV
|
DNA methylation sequencing;RNA-seq |
97 |
TCGA |
|
C GSE270130
|
Chip-seq |
27 |
Illumina NovaSeq 6000 (Homo sapiens) |
|
GSE224901
|
RNA-seq |
21 |
Illumina NovaSeq 6000 (Homo sapiens) |
|
GSE100400
|
Chip-seq;RNA-seq;4C_cccDNA |
31 |
Illumina NextSeq 500 (Homo sapiens);Illumina NextSeq 500 (Mus musculus) |
|
GSE173897
|
RNA-seq |
95 |
Illumina HiSeq 4000 (Homo sapiens) |
|
GSE262515
|
RNA-seq |
21 |
Illumina HiSeq 2500 (Homo sapiens);Illumina HiSeq 2500 (Mus musculus) |
|
GSE110345
|
RNA-seq |
4 |
Illumina HiSeq 2500 (Homo sapiens) |
|
C GSE131257
|
ATAC-seq;RNA-seq |
19 |
Illumina HiSeq 2500 (Homo sapiens) |
|
GSE94660
|
RNA-seq |
42 |
Illumina HiSeq 2500 (Homo sapiens) |
When the gene can detect a peak in the dataset, a peak plot will be displayed.
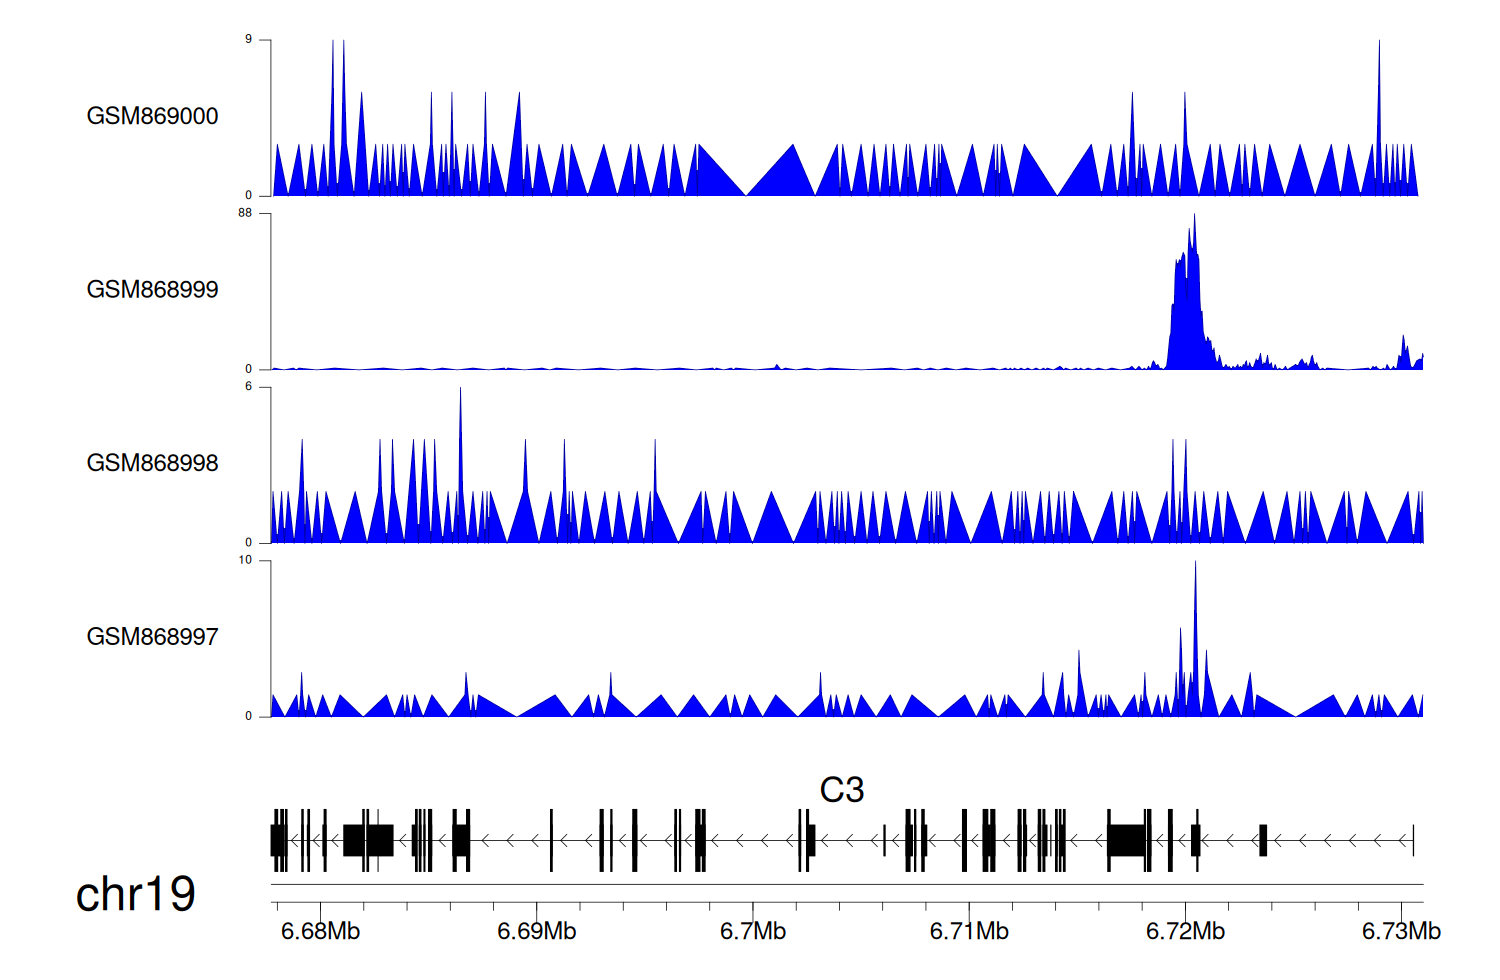
> Dataset: GSE35465 - C3 peak across samples
|
Peak Plot
|
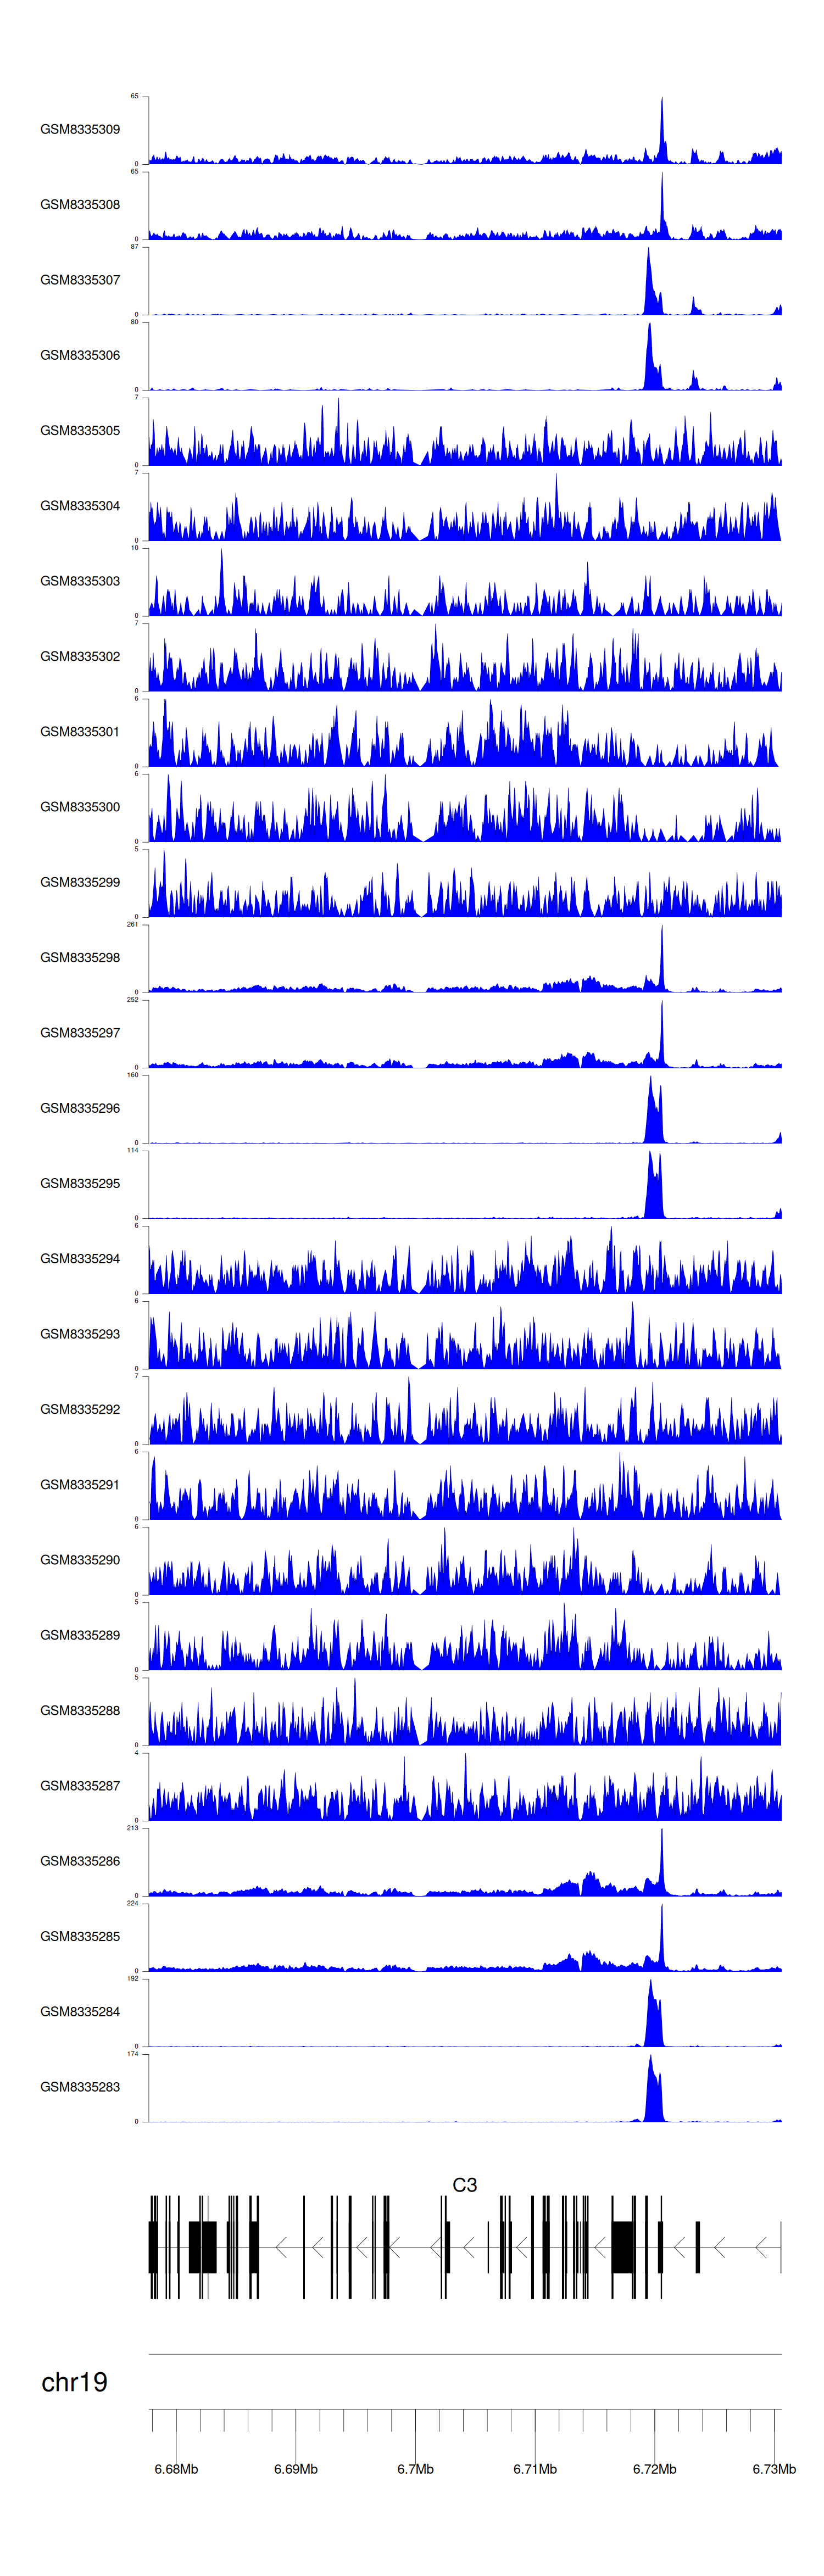
> Dataset: GSE68402 - C3 peak across samples
|
Peak Plot
|
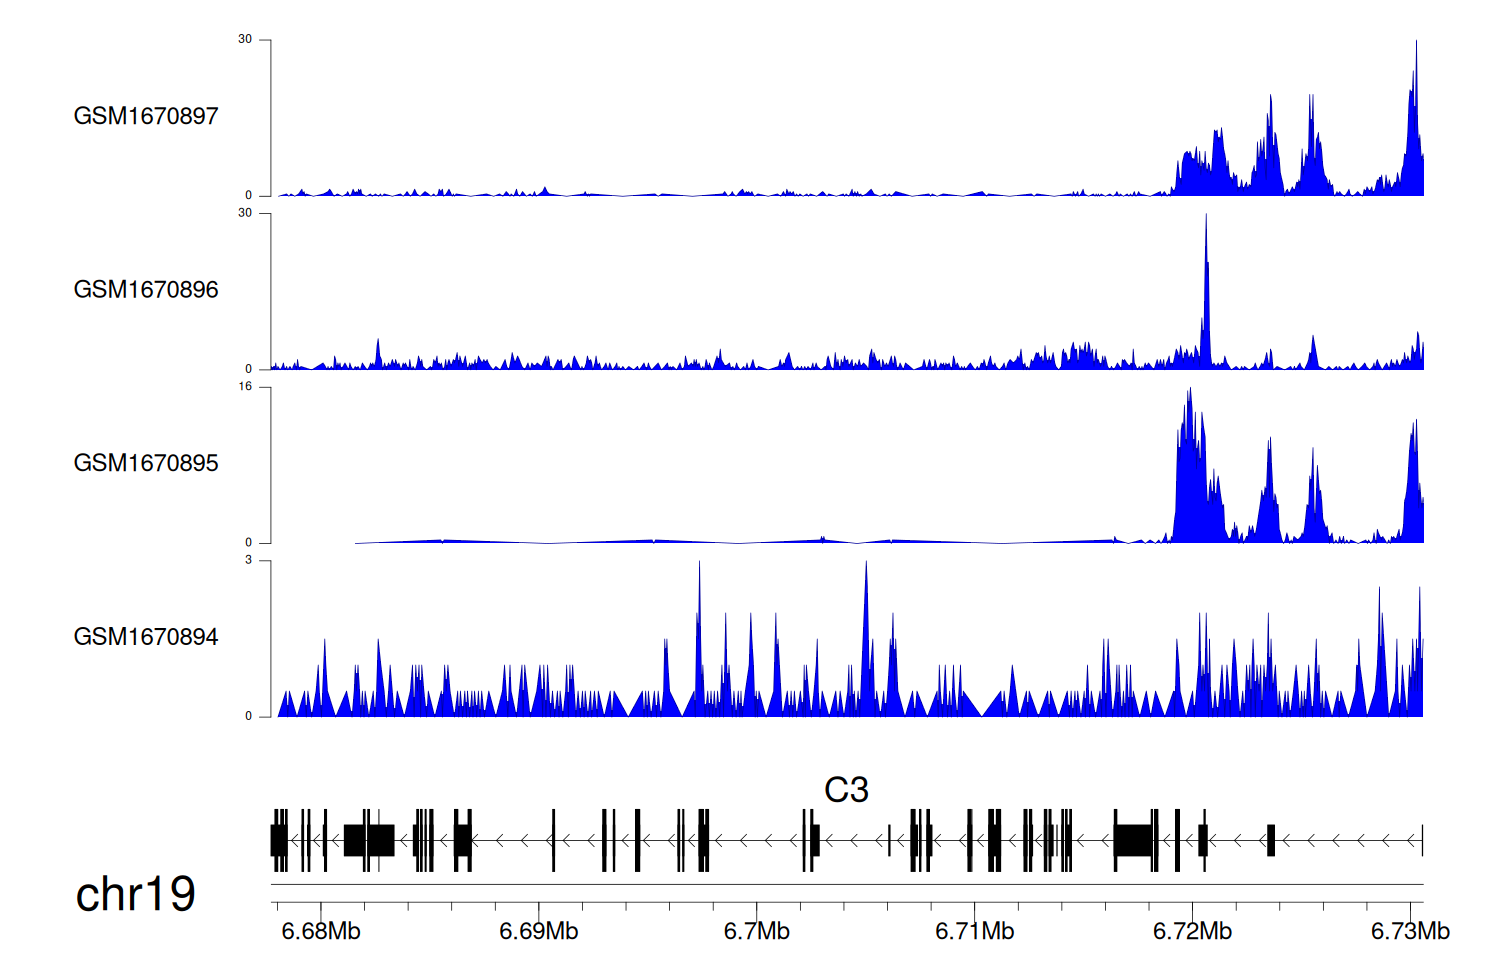
> Dataset: GSE270130 - C3 peak across samples
|
Peak Plot
|
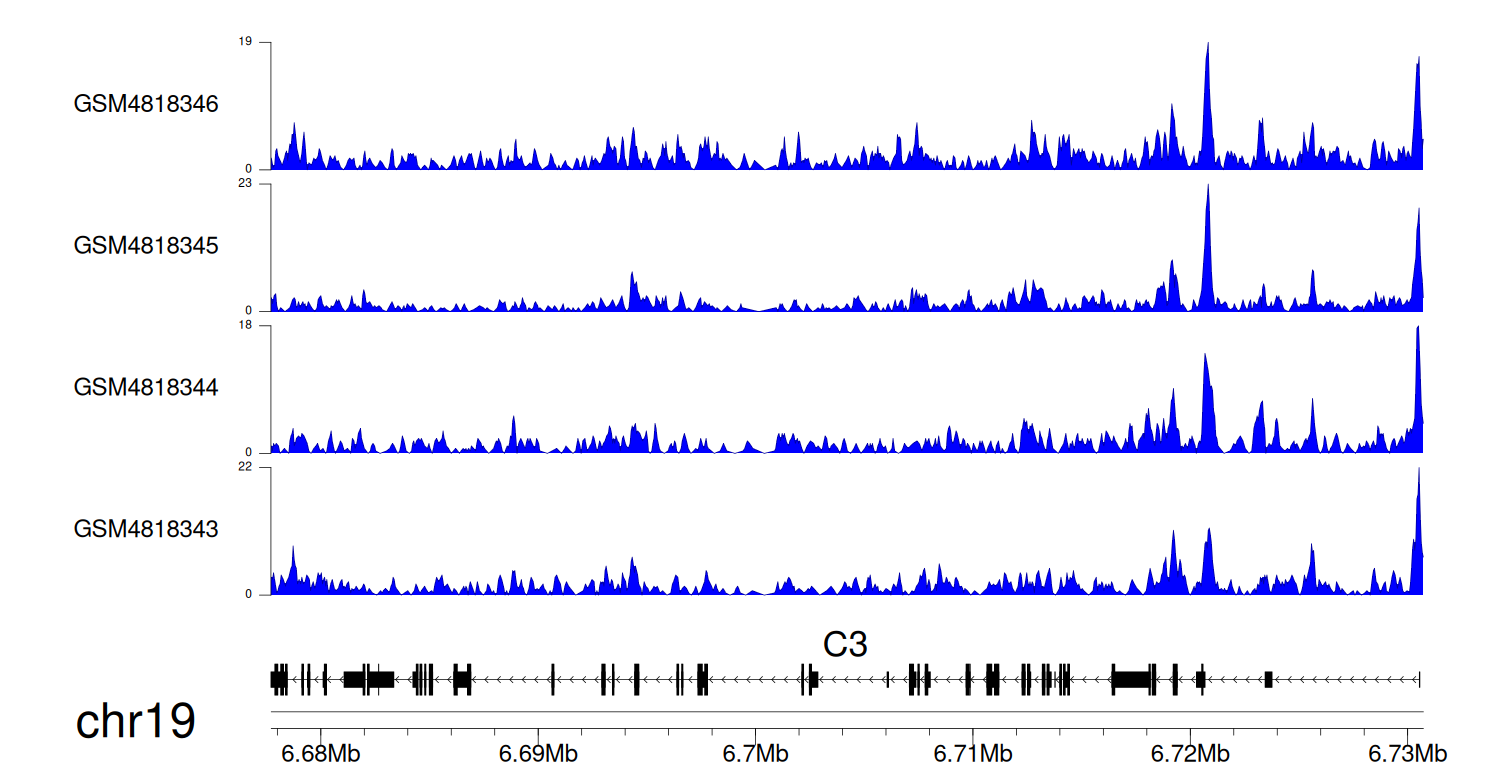
> Dataset: GSE131257 - C3 peak across samples
|
Peak Plot
|
|
|
