Gene Information
|
Gene Name
|
CELSR1 |
|
Gene ID
|
9620
|
|
Gene Full Name
|
cadherin EGF LAG seven-pass G-type receptor 1 |
|
Gene Alias
|
ADGRC1|CDHF9|FMI2|HFMI2|LMPHM9|ME2 |
|
Transcripts
|
ENSG00000075275
|
|
Virus
|
HBV |
|
Gene Type
|
protein-coding |
|
HPA Location Info
|
Plasma membrane;Nucleoplasm;Intracellular and membrane; 
|
|
Membrane Info
|
Disease related genes, G-protein coupled receptors, Human disease related genes, Potential drug targets, Predicted intracellular proteins, Predicted membrane proteins, Transporters |
|
Uniport_ID
|
Q9NYQ6
|
|
HGNC ID
|
HGNC:1850
|
|
OMIM ID
|
604523 |
|
Summary
|
The protein encoded by this gene is a member of the flamingo subfamily, part of the cadherin superfamily. The flamingo subfamily consists of nonclassic-type cadherins; a subpopulation that does not interact with catenins. The flamingo cadherins are located at the plasma membrane and have nine cadherin domains, seven epidermal growth factor-like repeats and two laminin A G-type repeats in their ectodomain. They also have seven transmembrane domains, a characteristic unique to this subfamily. It is postulated that these proteins are receptors involved in contact-mediated communication, with cadherin domains acting as homophilic binding regions and the EGF-like domains involved in cell adhesion and receptor-ligand interactions. This particular member is a developmentally regulated, neural-specific gene which plays an unspecified role in early embryogenesis. [provided by RefSeq, Jul 2008] |
Target gene [CELSR1] related to VISs 
Integration Table: if previous studies reported that target gene was altered by virus integration events, the overlap between VISs in this literature and Cistrome factors was listed in this section
| DVID |
Chromosome |
HM |
TFBS |
CA |
Sum of Overlapped Records |
Detail |
| 1004424 |
chr22 |
60 |
14 |
7 |
81 |
View |
| 1023779 |
chr22 |
60 |
14 |
7 |
81 |
View |
Target gene [CELSR1] related to Omics data
| Data ID |
Experiment type |
Sample number |
Platform |
|
GSE236281
|
RNA-seq |
12 |
Illumina MiSeq (Homo sapiens) |
|
C GSE35465
|
Chip-seq;RNA-seq |
6 |
Illumina HiSeq 2000 (Homo sapiens) |
|
C GSE68402
|
Chip-seq |
26 |
Illumina MiSeq (Homo sapiens);Illumina HiSeq 2500 (Homo sapiens) |
|
TCGA_LIHC_HBV
|
DNA methylation sequencing;RNA-seq |
97 |
TCGA |
|
C GSE270130
|
Chip-seq |
27 |
Illumina NovaSeq 6000 (Homo sapiens) |
|
GSE224901
|
RNA-seq |
21 |
Illumina NovaSeq 6000 (Homo sapiens) |
|
E GSE100400
|
Chip-seq;RNA-seq;4C_cccDNA |
31 |
Illumina NextSeq 500 (Homo sapiens);Illumina NextSeq 500 (Mus musculus) |
|
GSE173897
|
RNA-seq |
95 |
Illumina HiSeq 4000 (Homo sapiens) |
|
GSE262515
|
RNA-seq |
21 |
Illumina HiSeq 2500 (Homo sapiens);Illumina HiSeq 2500 (Mus musculus) |
|
GSE110345
|
RNA-seq |
4 |
Illumina HiSeq 2500 (Homo sapiens) |
|
C GSE131257
|
ATAC-seq;RNA-seq |
19 |
Illumina HiSeq 2500 (Homo sapiens) |
|
GSE94660
|
RNA-seq |
42 |
Illumina HiSeq 2500 (Homo sapiens) |
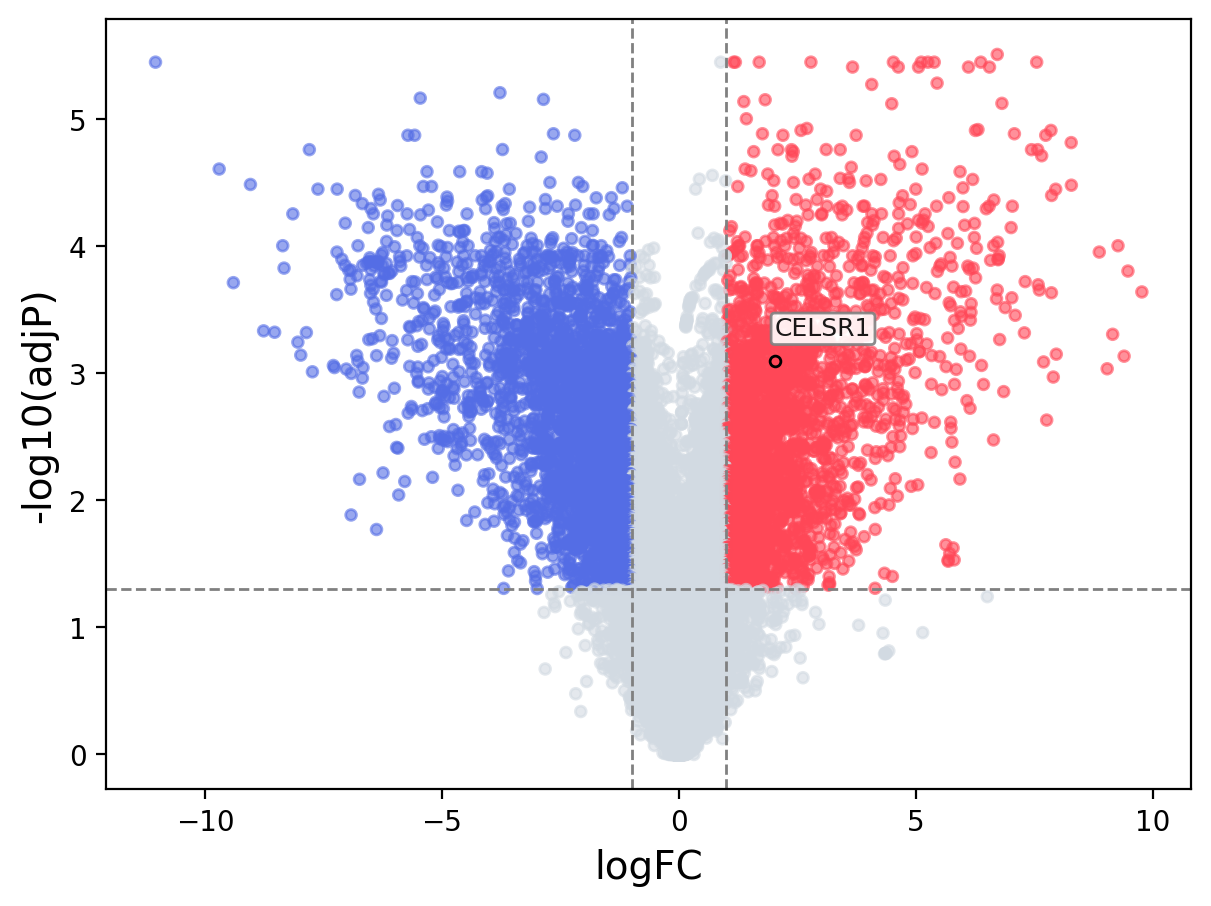
When the query gene is differentially changed in the dataset, a volcano/bar plot will be displayed.
> Dataset: GSE100400 - CELSR1 expression across samples
|
Volcano Plot
|
Bar Plot
|
|
|
