HBV Target gene Detail Information

> CFAP251 Gene Search Result


Gene Information
Gene Name CFAP251
Gene ID 144406
Gene Full Name cilia and flagella associated protein 251
Gene Alias CaM-IP4|SPGF33|WDR66
Transcripts ENSG00000158023
Virus HBV
Gene Type protein-coding
HPA Location Info Mid piece, End piece;
Membrane Info Disease related genes, Human disease related genes, Predicted intracellular proteins
Uniport_ID Q8TBY9
HGNC ID HGNC:28506
OMIM ID 618146
Summary This protein encoded by this gene belongs to the WD repeat-containing family of proteins, which function in the formation of protein-protein complexes in a variety of biological pathways. This family member appears to function in the determination of mean platelet volume (MPV), and polymorphisms in this gene have been associated with variance in MPV. Alternative splicing of this gene results in multiple transcript variants. [provided by RefSeq, Sep 2011]
Target gene [CFAP251] related to VISs

Integration Table: if previous studies reported that target gene was altered by virus integration events, the overlap between VISs in this literature and Cistrome factors was listed in this section


DVID Chromosome HM TFBS CA Sum of Overlapped Records Detail
1007920 chr12 15 7 1 23 View

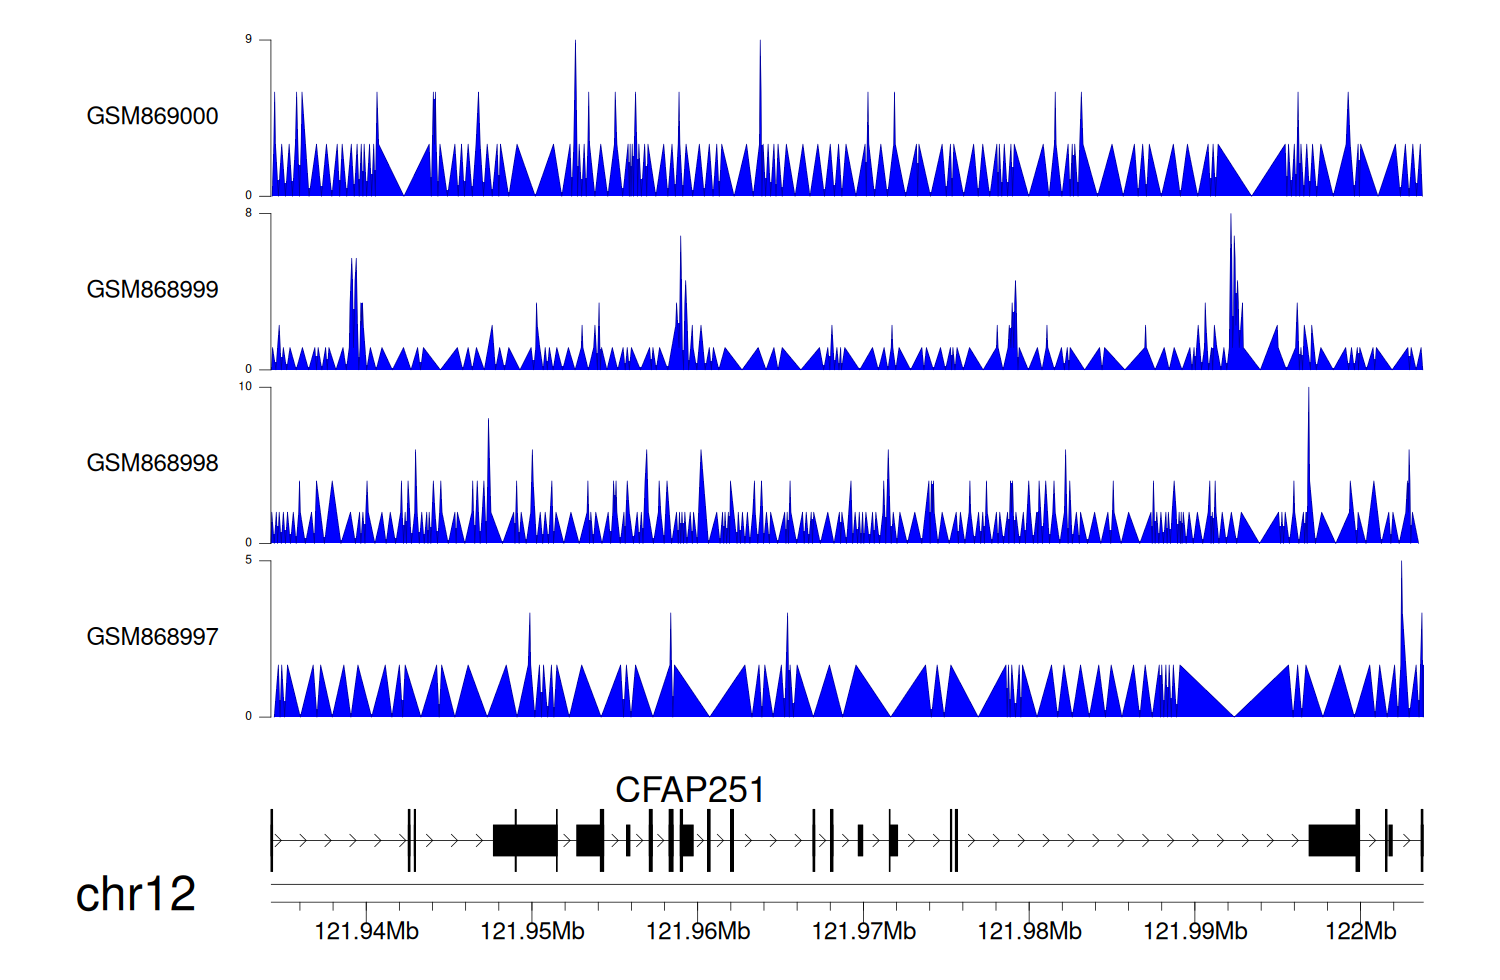
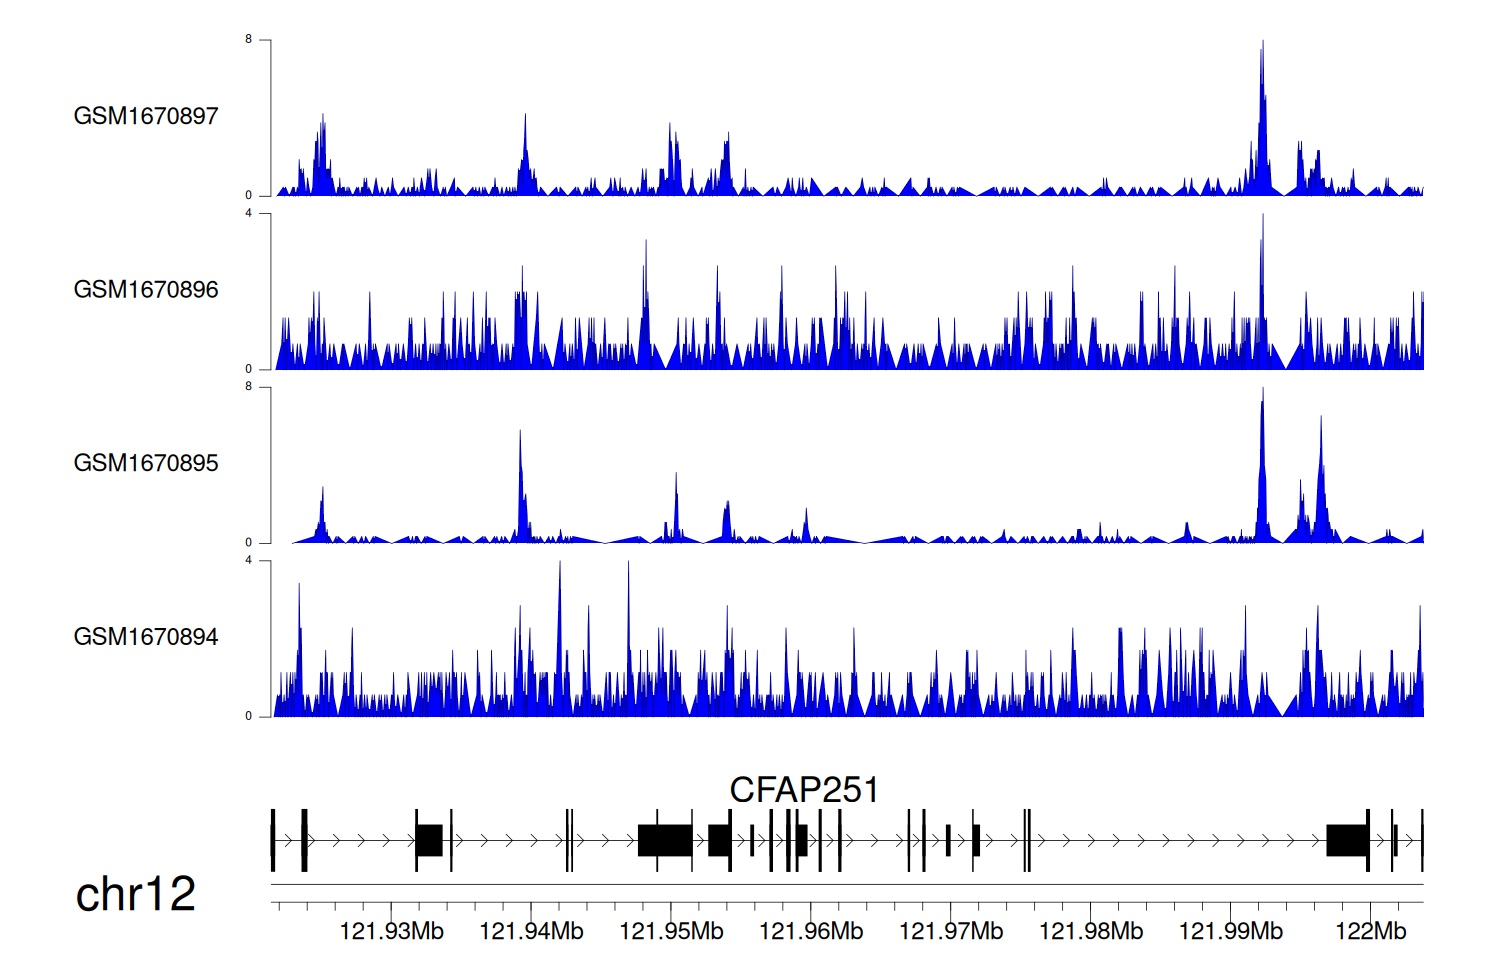
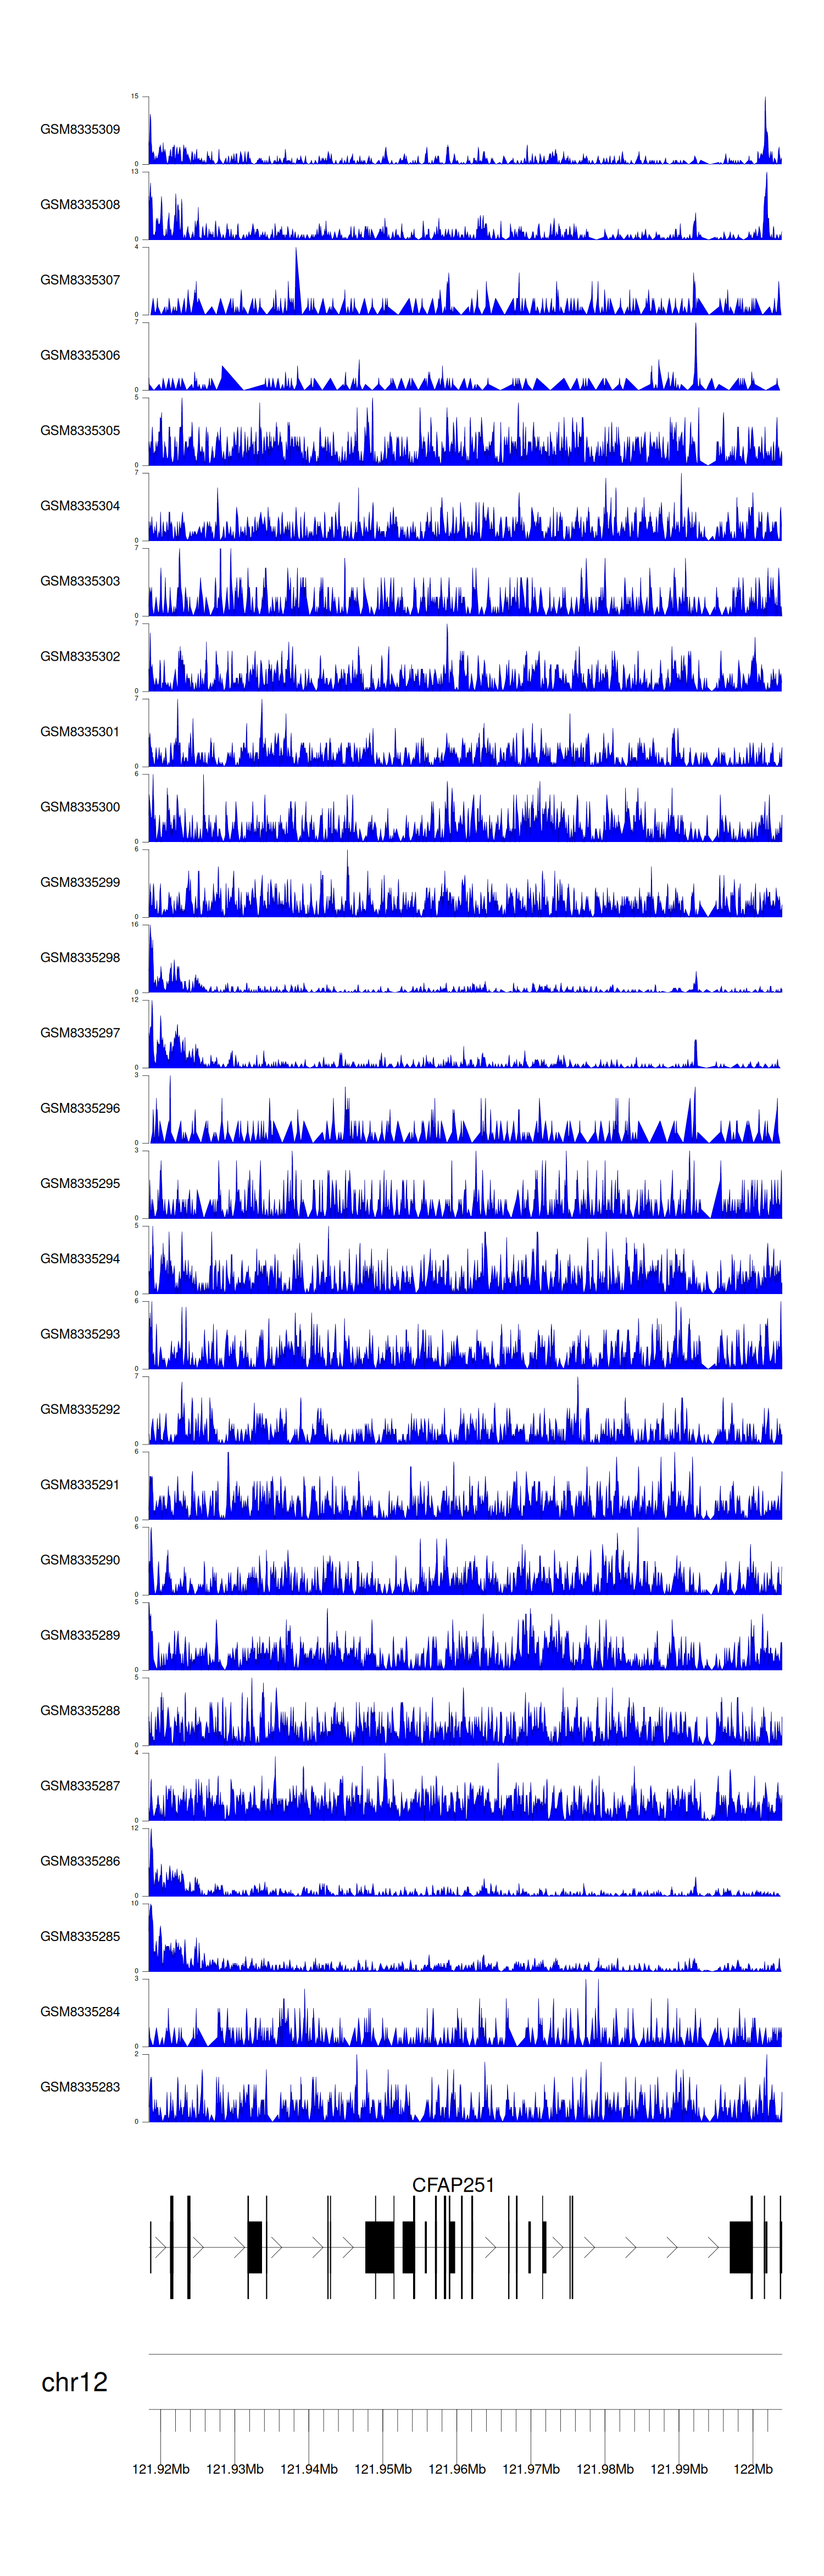
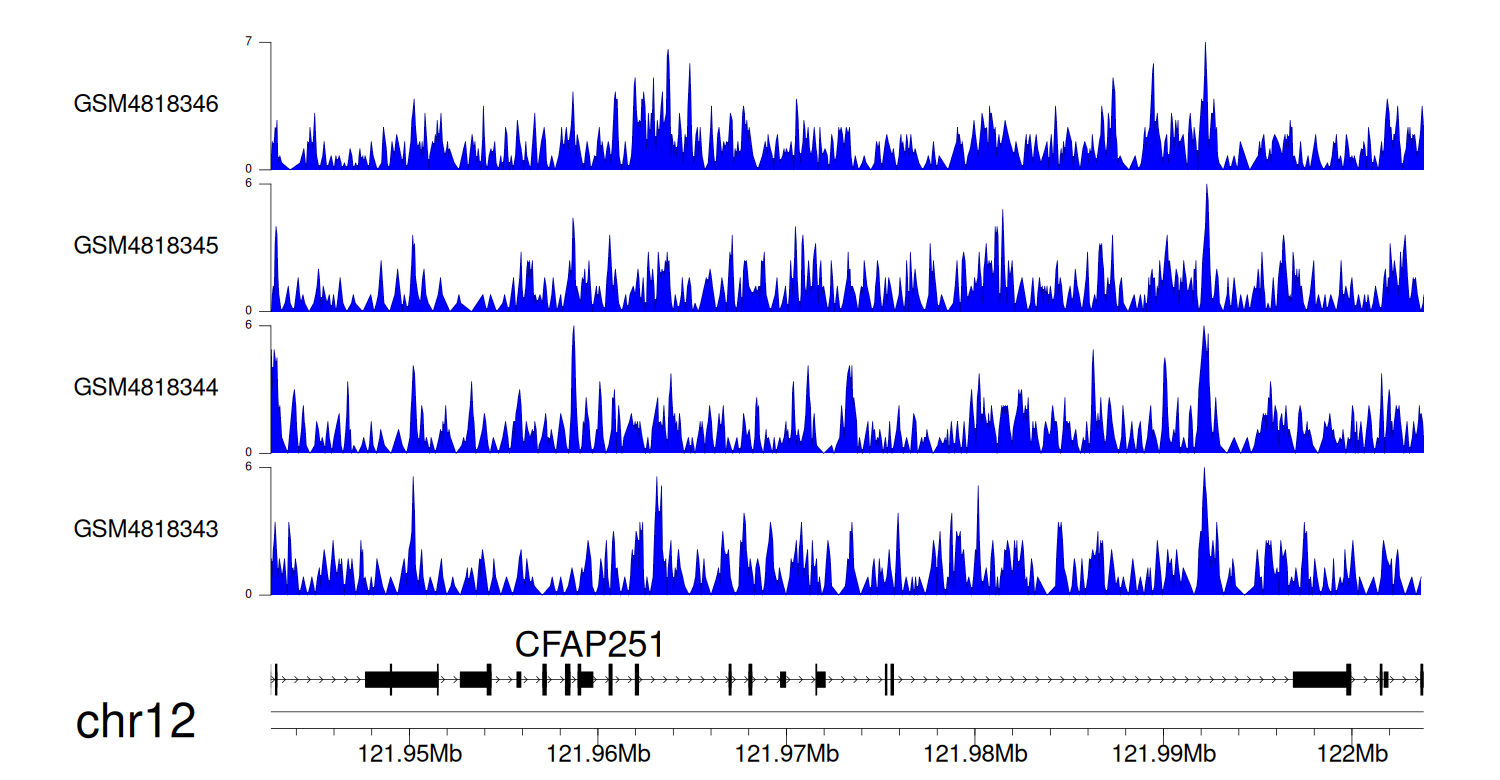
Target gene [CFAP251] related to Omics data
Data ID Experiment type Sample number Platform
C
  GSE35465
Chip-seq;RNA-seq 6 Illumina HiSeq 2000 (Homo sapiens)
C
  GSE68402
Chip-seq 26 Illumina MiSeq (Homo sapiens);Illumina HiSeq 2500 (Homo sapiens)
C
  GSE270130
Chip-seq 27 Illumina NovaSeq 6000 (Homo sapiens)
GSE224901 RNA-seq 21 Illumina NovaSeq 6000 (Homo sapiens)
GSE100400 Chip-seq;RNA-seq;4C_cccDNA 31 Illumina NextSeq 500 (Homo sapiens);Illumina NextSeq 500 (Mus musculus)
GSE173897 RNA-seq 95 Illumina HiSeq 4000 (Homo sapiens)
C
  GSE131257
ATAC-seq;RNA-seq 19 Illumina HiSeq 2500 (Homo sapiens)
GSE94660 RNA-seq 42 Illumina HiSeq 2500 (Homo sapiens)


When the gene can detect a peak in the dataset, a peak plot will be displayed.


> Dataset: GSE35465 - CFAP251 peak across samples

Peak Plot


> Dataset: GSE68402 - CFAP251 peak across samples

Peak Plot


> Dataset: GSE270130 - CFAP251 peak across samples

Peak Plot


> Dataset: GSE131257 - CFAP251 peak across samples

Peak Plot