Gene Information
|
Gene Name
|
CFAP418 |
|
Gene ID
|
157657
|
|
Gene Full Name
|
cilia and flagella associated protein 418 |
|
Gene Alias
|
BBS21|C8orf37|CORD16|FAP418|MOT25|RP64|smalltalk |
|
Transcripts
|
ENSG00000156172
|
|
Virus
|
HBV |
|
Gene Type
|
protein-coding |
|
HPA Location Info
|
Plasma membrane, Primary cilium;Vesicles, Cell Junctions, Centrosome; 
|
|
Membrane Info
|
Disease related genes, Human disease related genes, Predicted intracellular proteins |
|
Uniport_ID
|
Q96NL8
|
|
HGNC ID
|
HGNC:27232
|
|
OMIM ID
|
614477 |
|
Summary
|
This gene encodes a ubiquitously expressed protein of unknown function. It has high levels of mRNA expression in the brain, heart, and retina and the protein co-localizes with polyglutamylated tubulin at the base of the primary cilium in human retinal pigment epithelial cells. Mutations in this gene have been associated with autosomal recessive cone-rod dystrophy (arCRD) and retinitis pigmentosa (arRP). [provided by RefSeq, Mar 2012] |
Target gene [CFAP418] related to VISs 
Integration Table: if previous studies reported that target gene was altered by virus integration events, the overlap between VISs in this literature and Cistrome factors was listed in this section
| DVID |
Chromosome |
HM |
TFBS |
CA |
Sum of Overlapped Records |
Detail |
| 1043390 |
chr8 |
23 |
5 |
16 |
44 |
View |
Target gene [CFAP418] related to Omics data
| Data ID |
Experiment type |
Sample number |
Platform |
|
C GSE35465
|
Chip-seq;RNA-seq |
6 |
Illumina HiSeq 2000 (Homo sapiens) |
|
C GSE68402
|
Chip-seq |
26 |
Illumina MiSeq (Homo sapiens);Illumina HiSeq 2500 (Homo sapiens) |
|
C GSE270130
|
Chip-seq |
27 |
Illumina NovaSeq 6000 (Homo sapiens) |
|
GSE224901
|
RNA-seq |
21 |
Illumina NovaSeq 6000 (Homo sapiens) |
|
GSE100400
|
Chip-seq;RNA-seq;4C_cccDNA |
31 |
Illumina NextSeq 500 (Homo sapiens);Illumina NextSeq 500 (Mus musculus) |
|
GSE173897
|
RNA-seq |
95 |
Illumina HiSeq 4000 (Homo sapiens) |
|
C GSE131257
|
ATAC-seq;RNA-seq |
19 |
Illumina HiSeq 2500 (Homo sapiens) |
|
GSE94660
|
RNA-seq |
42 |
Illumina HiSeq 2500 (Homo sapiens) |
When the gene can detect a peak in the dataset, a peak plot will be displayed.
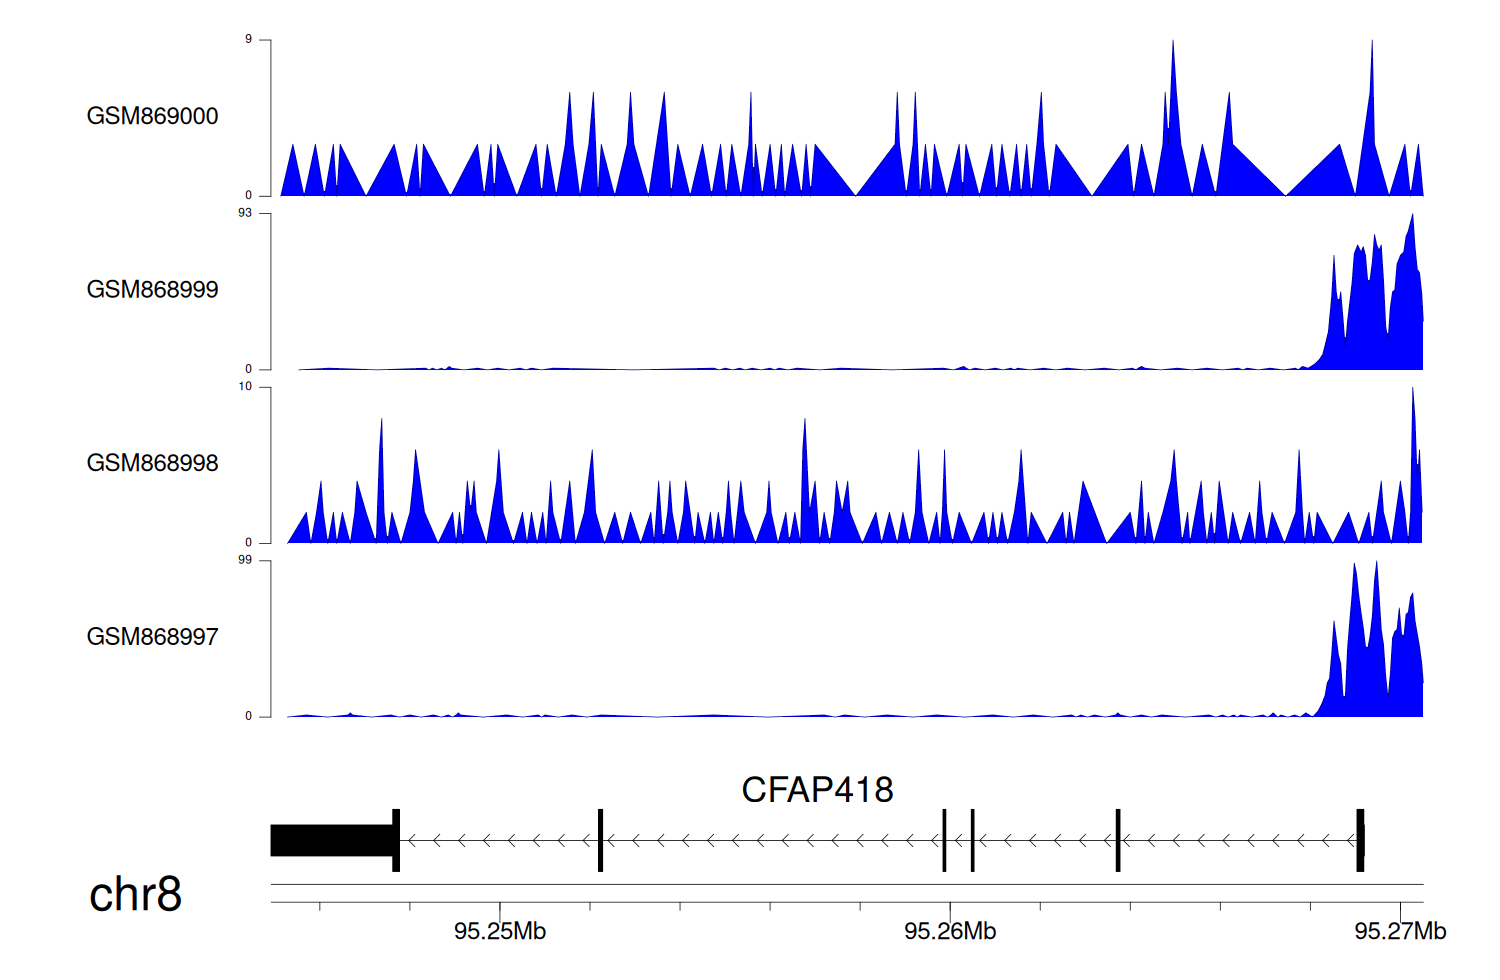
> Dataset: GSE35465 - CFAP418 peak across samples
|
Peak Plot
|
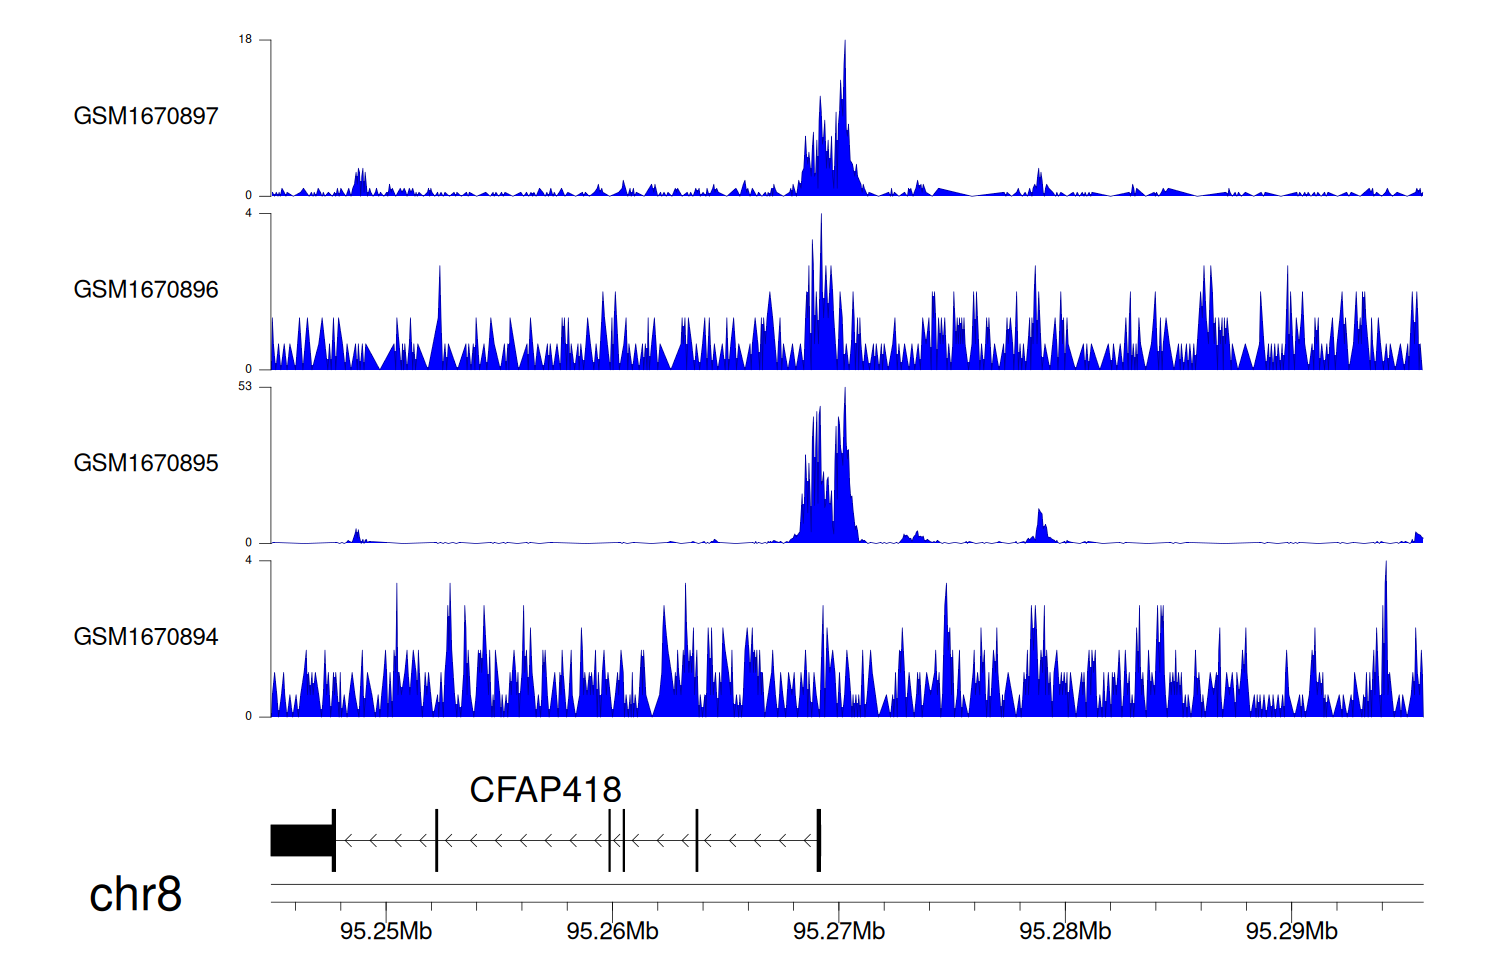
> Dataset: GSE68402 - CFAP418 peak across samples
|
Peak Plot
|
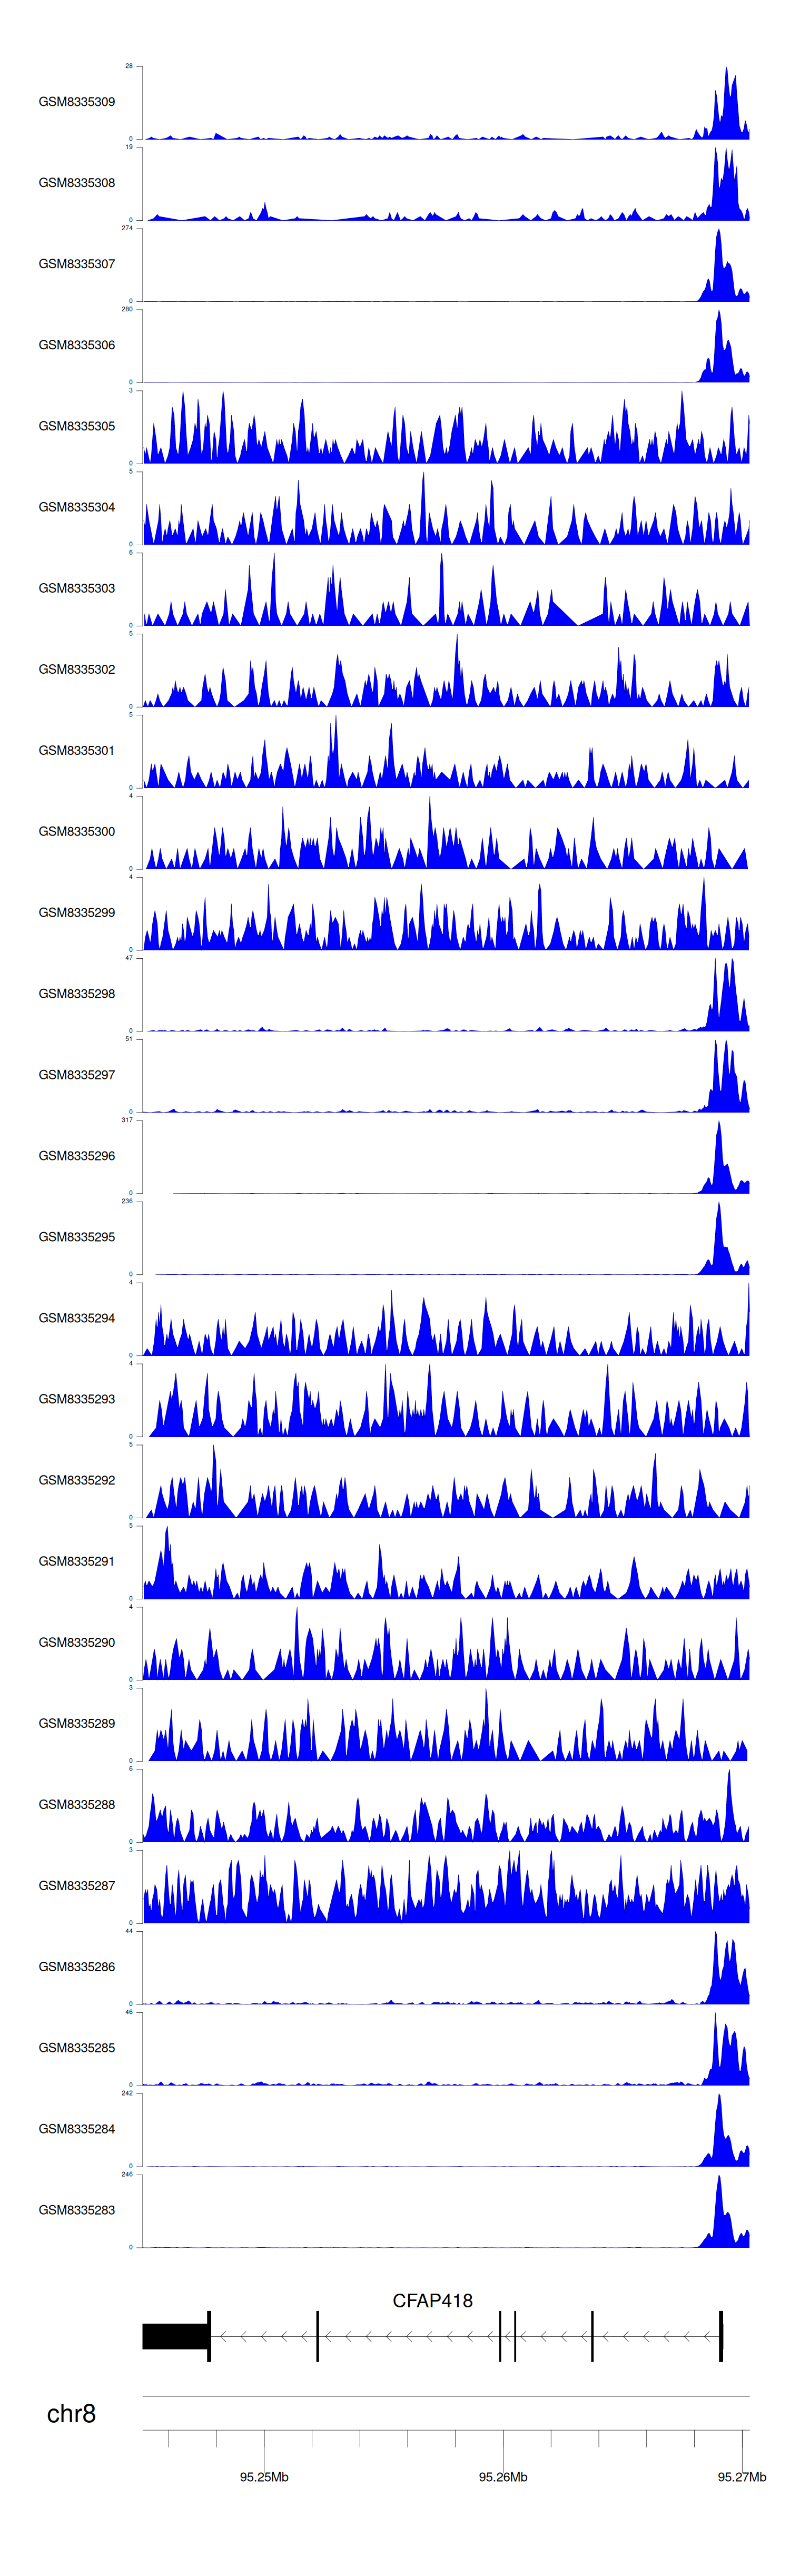
> Dataset: GSE270130 - CFAP418 peak across samples
|
Peak Plot
|
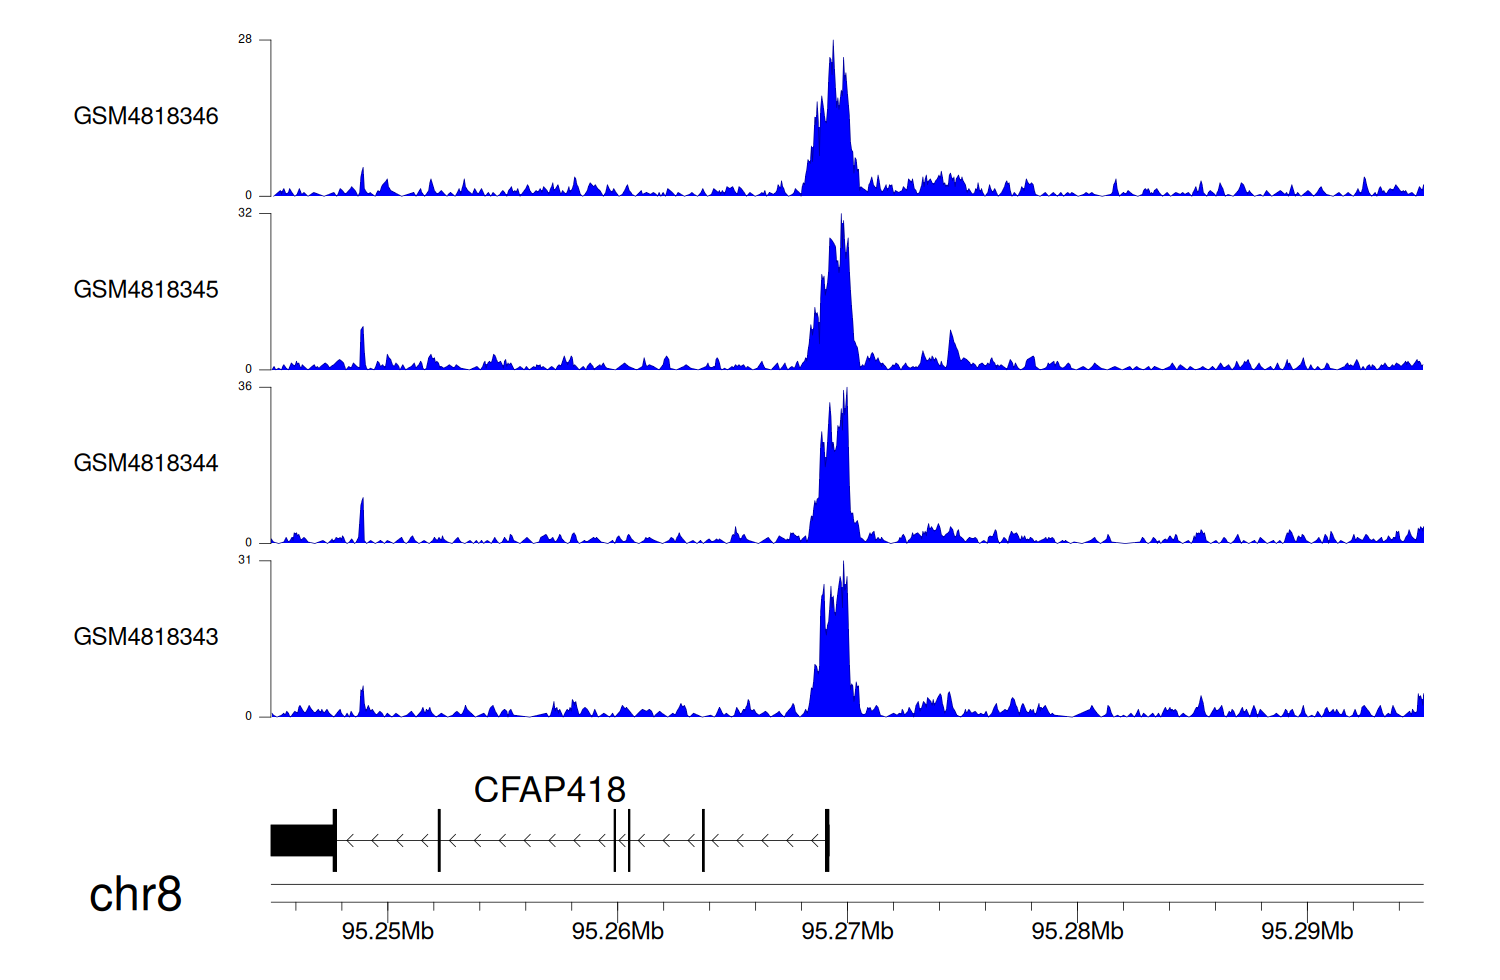
> Dataset: GSE131257 - CFAP418 peak across samples
|
Peak Plot
|
|
|
