Gene Information
|
Gene Name
|
CRYBB2 |
|
Gene ID
|
1415
|
|
Gene Full Name
|
crystallin beta B2 |
|
Gene Alias
|
CCA2|CRYB2|CRYB2A|CTRCT3|D22S665 |
|
Transcripts
|
ENSG00000244752
|
|
Virus
|
HBV |
|
Gene Type
|
protein-coding |
|
HPA Location Info
|
Nucleoplasm; 
|
|
Membrane Info
|
Disease related genes, Human disease related genes, Predicted intracellular proteins |
|
Uniport_ID
|
P43320
|
|
HGNC ID
|
HGNC:2398
|
|
OMIM ID
|
123620 |
|
Summary
|
Crystallins are separated into two classes: taxon-specific, or enzyme, and ubiquitous. The latter class constitutes the major proteins of vertebrate eye lens and maintains the transparency and refractive index of the lens. Since lens central fiber cells lose their nuclei during development, these crystallins are made and then retained throughout life, making them extremely stable proteins. Mammalian lens crystallins are divided into alpha, beta, and gamma families; beta and gamma crystallins are also considered as a superfamily. Alpha and beta families are further divided into acidic and basic groups. Seven protein regions exist in crystallins: four homologous motifs, a connecting peptide, and N- and C-terminal extensions. Beta-crystallins, the most heterogeneous, differ by the presence of the C-terminal extension (present in the basic group, none in the acidic group). Beta-crystallins form aggregates of different sizes and are able to self-associate to form dimers or to form heterodimers with other beta-crystallins. This gene, a beta basic group member, is part of a gene cluster with beta-A4, beta-B1, and beta-B3. A chain-terminating mutation was found to cause type 2 cerulean cataracts. [provided by RefSeq, Jul 2008] |
Target gene [CRYBB2] related to VISs 
Integration Table: if previous studies reported that target gene was altered by virus integration events, the overlap between VISs in this literature and Cistrome factors was listed in this section
| DVID |
Chromosome |
HM |
TFBS |
CA |
Sum of Overlapped Records |
Detail |
| 1013595 |
chr22 |
5 |
0 |
0 |
5 |
View |
Target gene [CRYBB2] related to Omics data
| Data ID |
Experiment type |
Sample number |
Platform |
|
GSE236281
|
RNA-seq |
12 |
Illumina MiSeq (Homo sapiens) |
|
C GSE35465
|
Chip-seq;RNA-seq |
6 |
Illumina HiSeq 2000 (Homo sapiens) |
|
C GSE68402
|
Chip-seq |
26 |
Illumina MiSeq (Homo sapiens);Illumina HiSeq 2500 (Homo sapiens) |
|
TCGA_LIHC_HBV
|
DNA methylation sequencing;RNA-seq |
97 |
TCGA |
|
C GSE270130
|
Chip-seq |
27 |
Illumina NovaSeq 6000 (Homo sapiens) |
|
GSE224901
|
RNA-seq |
21 |
Illumina NovaSeq 6000 (Homo sapiens) |
|
GSE100400
|
Chip-seq;RNA-seq;4C_cccDNA |
31 |
Illumina NextSeq 500 (Homo sapiens);Illumina NextSeq 500 (Mus musculus) |
|
GSE173897
|
RNA-seq |
95 |
Illumina HiSeq 4000 (Homo sapiens) |
|
GSE262515
|
RNA-seq |
21 |
Illumina HiSeq 2500 (Homo sapiens);Illumina HiSeq 2500 (Mus musculus) |
|
GSE110345
|
RNA-seq |
4 |
Illumina HiSeq 2500 (Homo sapiens) |
|
C GSE131257
|
ATAC-seq;RNA-seq |
19 |
Illumina HiSeq 2500 (Homo sapiens) |
|
GSE94660
|
RNA-seq |
42 |
Illumina HiSeq 2500 (Homo sapiens) |
When the gene can detect a peak in the dataset, a peak plot will be displayed.
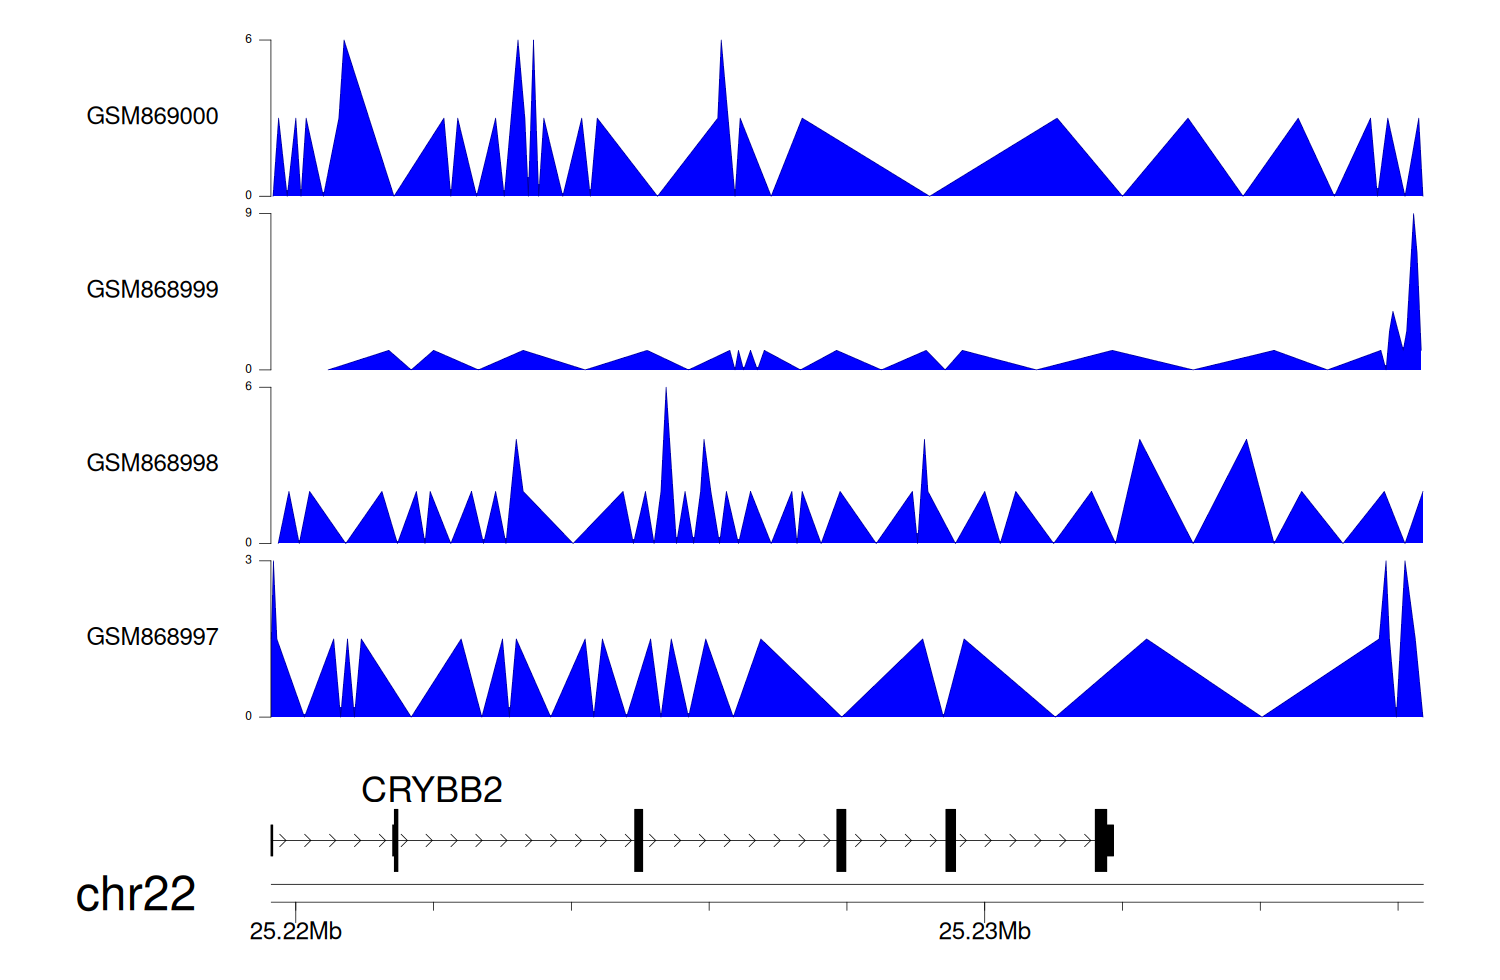
> Dataset: GSE35465 - CRYBB2 peak across samples
|
Peak Plot
|
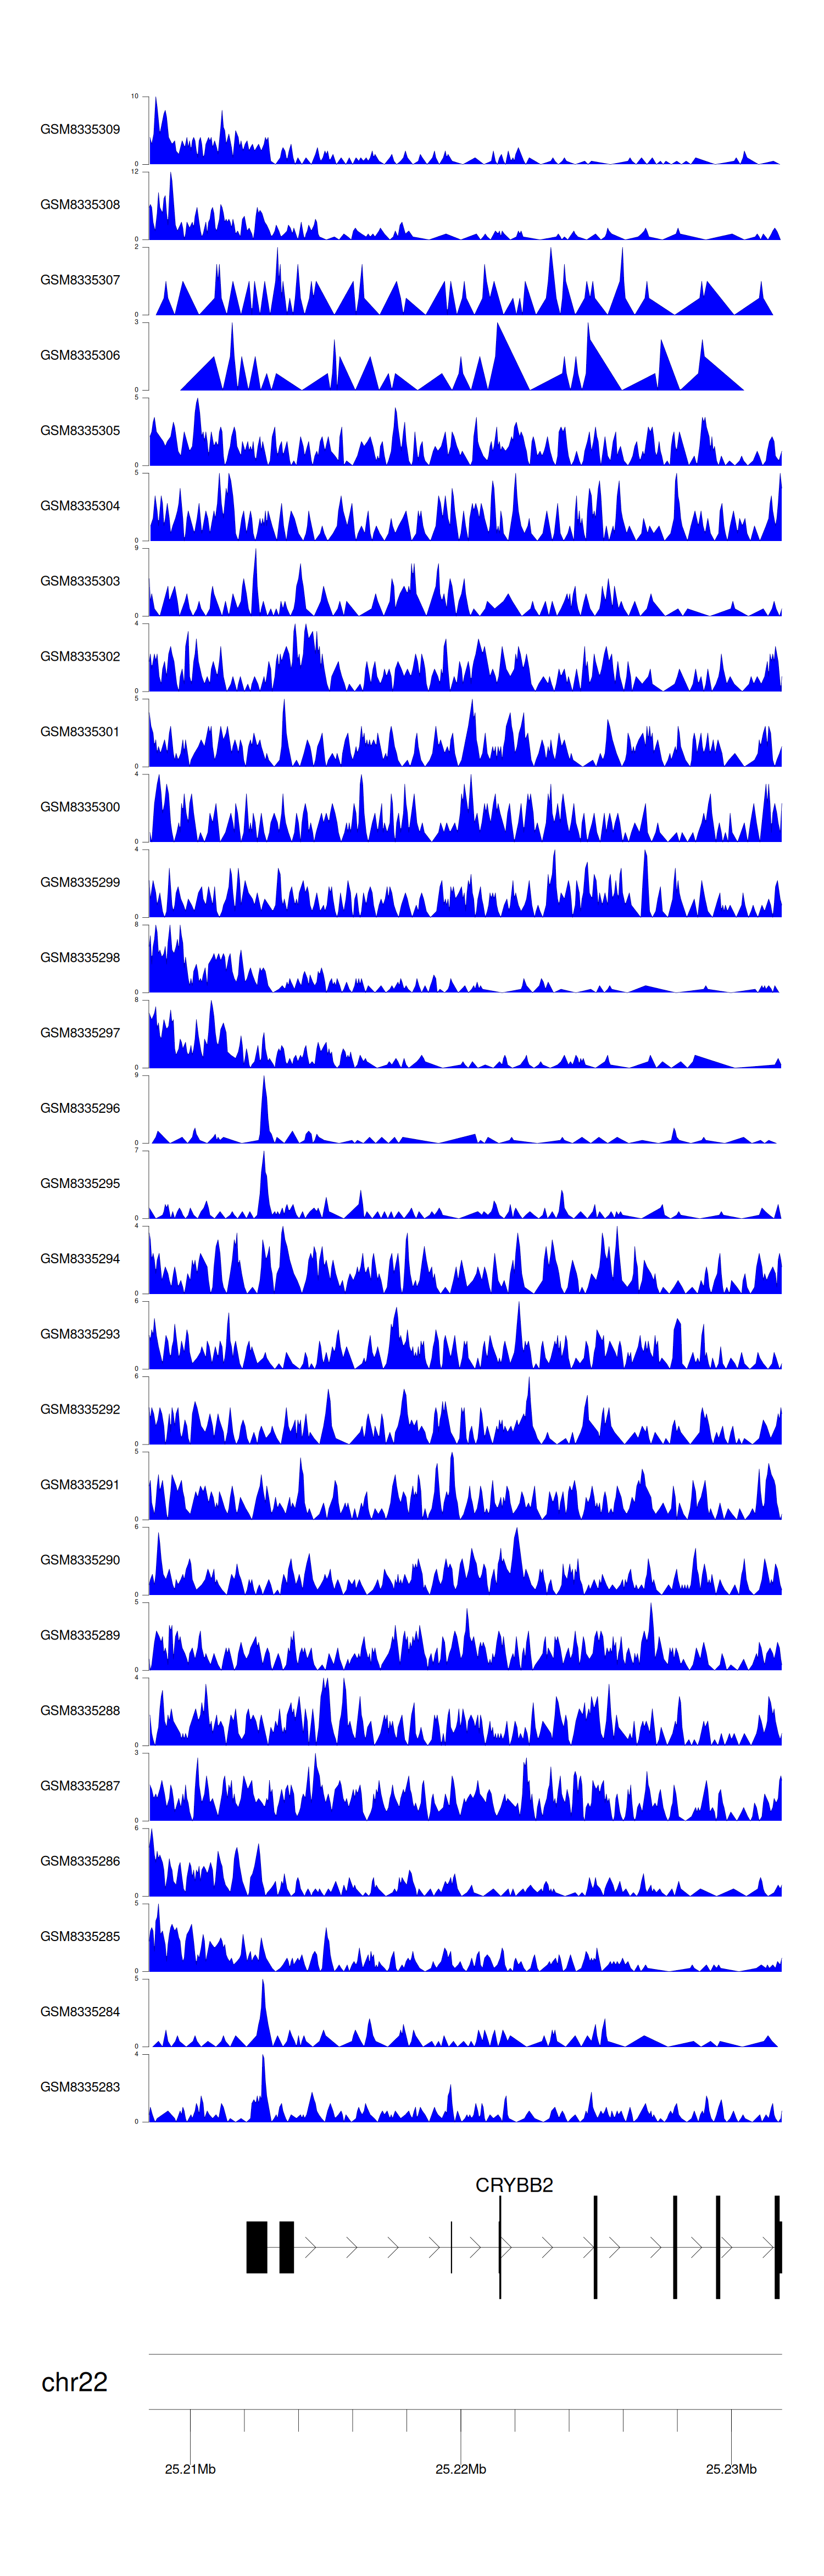
> Dataset: GSE68402 - CRYBB2 peak across samples
|
Peak Plot
|
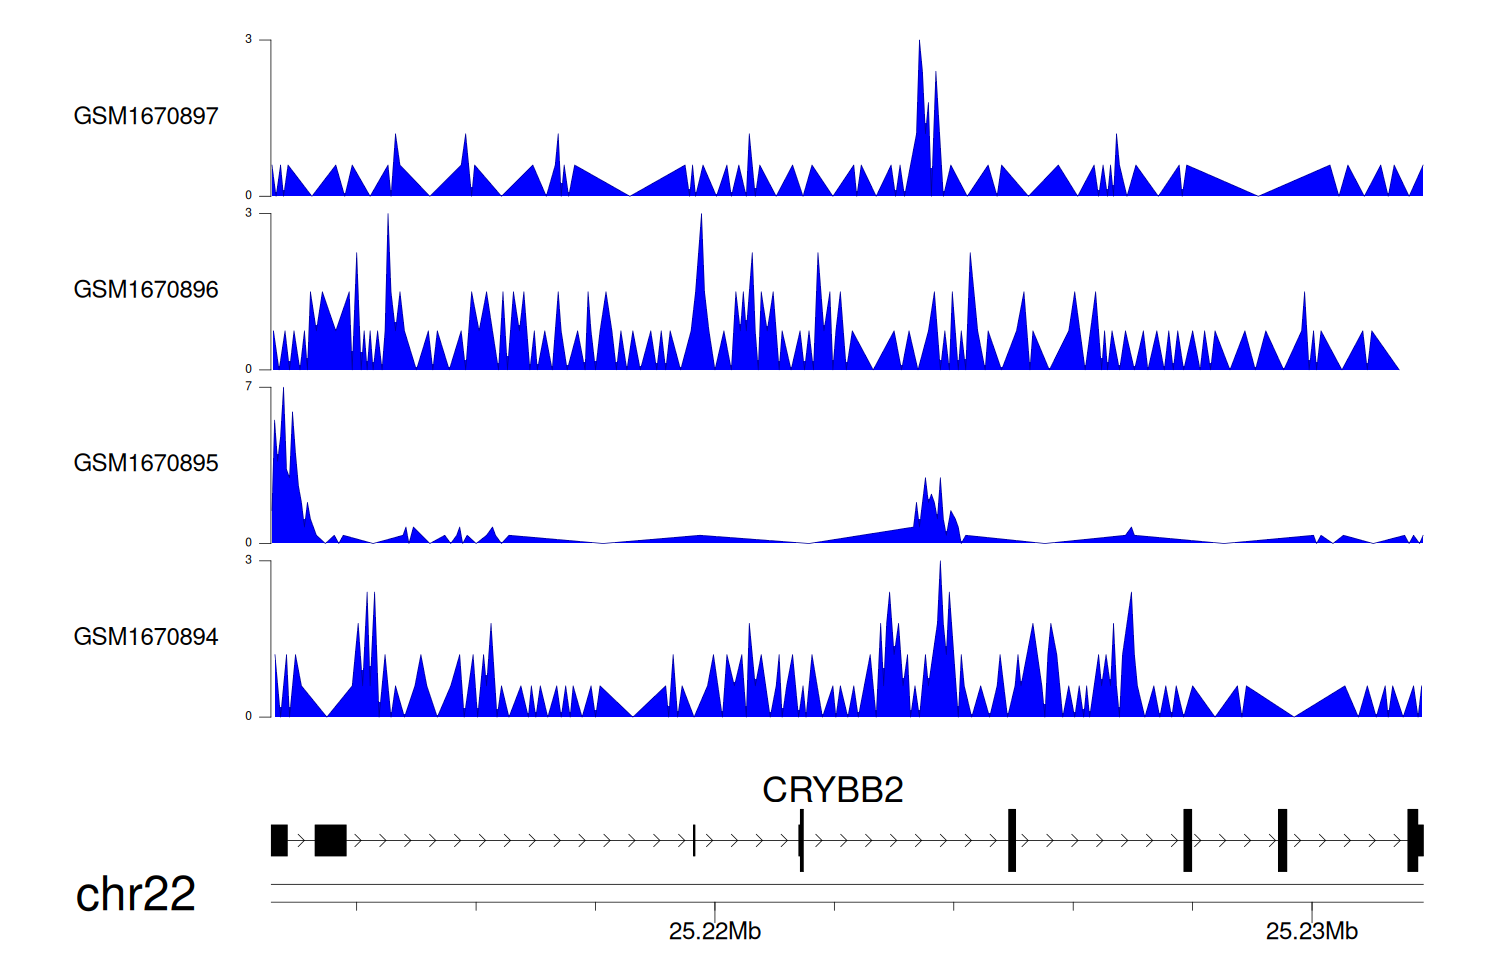
> Dataset: GSE270130 - CRYBB2 peak across samples
|
Peak Plot
|
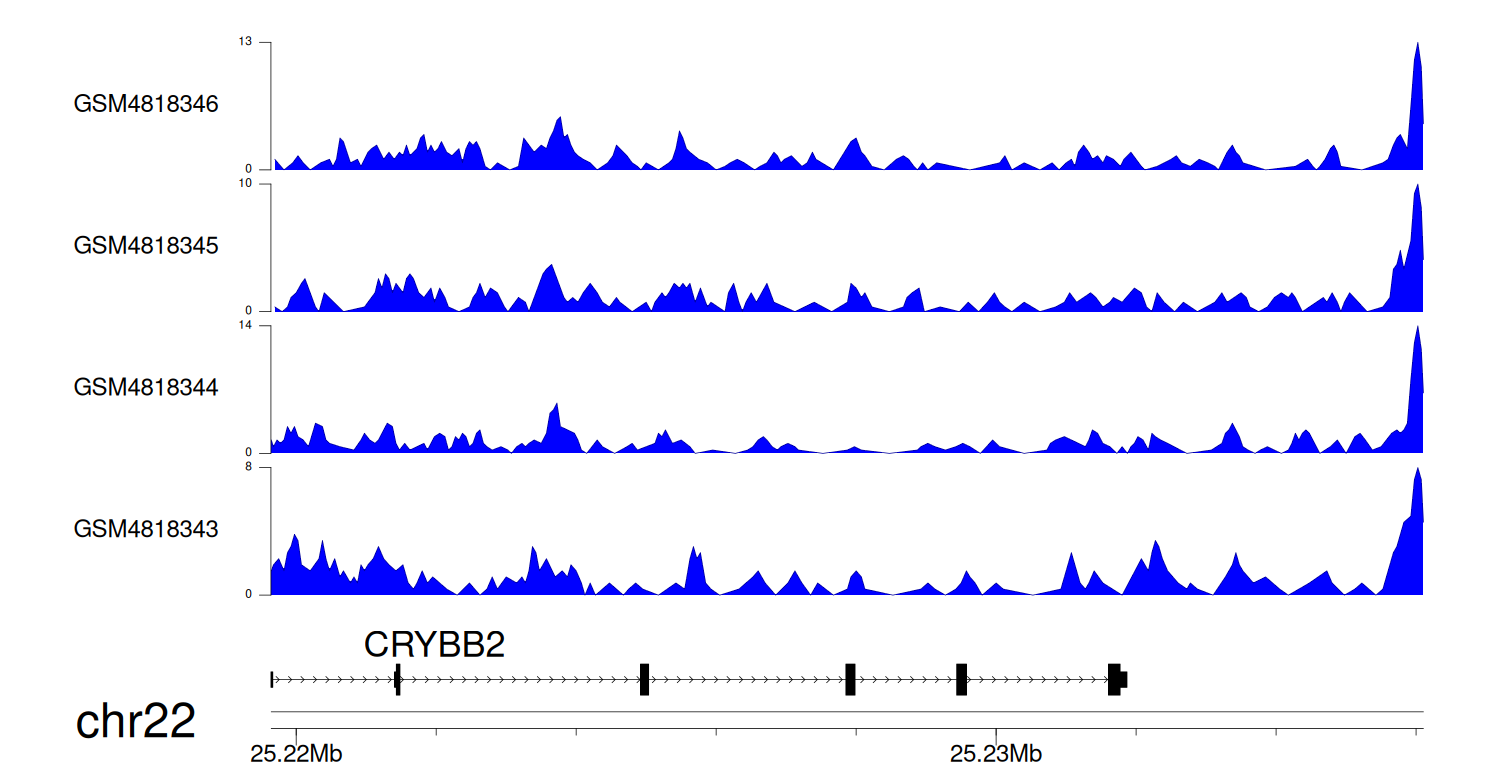
> Dataset: GSE131257 - CRYBB2 peak across samples
|
Peak Plot
|
|
|
