Gene Information
|
Gene Name
|
CTSL |
|
Gene ID
|
1514
|
|
Gene Full Name
|
cathepsin L |
|
Gene Alias
|
CATL|CTSL1|MEP |
|
Transcripts
|
ENSG00000135047
|
|
Virus
|
EBOV |
|
Gene Type
|
protein-coding |
|
HPA Location Info
|
Golgi apparatus, Vesicles;Intracellular and membrane; 
|
|
Membrane Info
|
Cancer-related genes, Enzymes, Metabolic proteins, Plasma proteins, Predicted intracellular proteins |
|
Uniport_ID
|
P07711
|
|
HGNC ID
|
HGNC:2537
|
|
OMIM ID
|
116880 |
|
Summary
|
The protein encoded by this gene is a lysosomal cysteine proteinase that plays a major role in intracellular protein catabolism. Its substrates include collagen and elastin, as well as alpha-1 protease inhibitor, a major controlling element of neutrophil elastase activity. The encoded protein has been implicated in several pathologic processes, including myofibril necrosis in myopathies and in myocardial ischemia, and in the renal tubular response to proteinuria. This protein, which is a member of the peptidase C1 family, is a dimer composed of disulfide-linked heavy and light chains, both produced from a single protein precursor. Additionally, this protein cleaves the S1 subunit of the SARS-CoV-2 spike protein, which is necessary for entry of the virus into the cell. [provided by RefSeq, Aug 2020] |
Target gene [CTSL] related to virus gene/protein/region 
Mutation Table: if previous studies reported that target gene was related to virus gene/region/protein, the information in this literature was listed in this section
| ID |
PMID |
Mutation |
Gene/Protein/Region |
Encoding Gene/Protein |
Disease |
Description |
Detail |
| 1 |
33593971 |
A82V |
GP
|
GP
|
Cell line
|
D
G
R
T
|
View |
Target gene [CTSL] related to Omics data
| Data ID |
Experiment type |
Sample number |
Platform |
|
E GSE96590
|
RNA-seq |
20 |
Illumina HiSeq 1000 (Homo sapiens) |
|
GSE80131
|
RNA-seq |
6 |
Illumina HiSeq 2500 (Homo sapiens) |
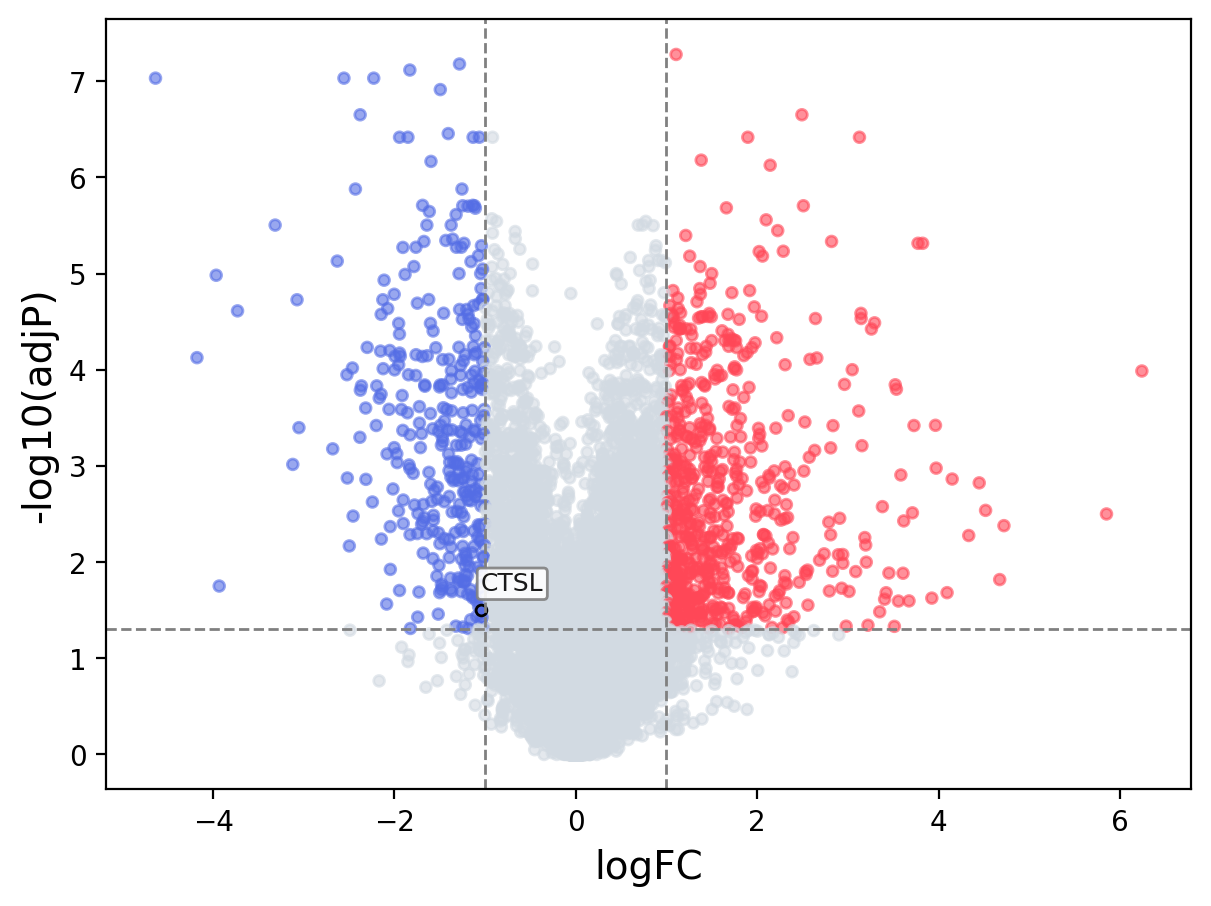
When the query gene is differentially changed in the dataset, a volcano/bar plot will be displayed.
> Dataset: GSE96590 - CTSL expression across samples
|
Volcano Plot
|
Bar Plot
|
|
|
