Gene Information
|
Gene Name
|
CYP3A7-CYP3A51P |
|
Gene ID
|
100861540
|
|
Gene Full Name
|
CYP3A7-CYP3A51P readthrough |
|
Gene Alias
|
CYP3A7|CYP3A7-3AP1|CYP3A7-CYP3AP1|CYP3A7.1L|CYPIIIA7 |
|
Transcripts
|
ENSG00000282301
|
|
Virus
|
HBV |
|
Gene Type
|
protein-coding |
|
HPA Location Info
|
Cytosol;Vesicles; 
|
|
Membrane Info
|
Metabolic proteins, Predicted intracellular proteins, Predicted membrane proteins |
|
HGNC ID
|
HGNC:51504
|
|
Summary
|
This locus represents readthrough transcription between the neighboring CYP3A7 (cytochrome P450, family 3, subfamily A, polypeptide 7) and CYP3A51P (cytochrome P450, family 3, subfamily A, polypeptide 51, pseudogene) genes, which are members of the CYP3A gene cluster on chromosome 7. The downstream pseudogene is not known to be independently transcribed. The readthrough transcript includes CYP3A7 exons 1-13 and exons 2 and 13 of the pseudogene. It encodes a CYP3A isoform with a novel C-terminus. This isoform is only expressed in alleles containing a T nucleotide at the -6 position of a splice acceptor in the pseudogene, which enables correct splicing of the upstream CYP3A7 exons to the pseudogene exons. It should be noted that the reference genome sequence represents the CYP3A7_39256 T->A allele, and thus this haplotype is unlikely to produce the readthrough transcript. [provided by RefSeq, Jan 2015] |
Target gene [CYP3A7-CYP3A51P] related to VISs 
Integration Table: if previous studies reported that target gene was altered by virus integration events, the overlap between VISs in this literature and Cistrome factors was listed in this section
| DVID |
Chromosome |
HM |
TFBS |
CA |
Sum of Overlapped Records |
Detail |
| 1024191 |
chr7 |
5 |
1 |
0 |
6 |
View |
Target gene [CYP3A7-CYP3A51P] related to Omics data
| Data ID |
Experiment type |
Sample number |
Platform |
|
GSE236281
|
RNA-seq |
12 |
Illumina MiSeq (Homo sapiens) |
|
C GSE35465
|
Chip-seq;RNA-seq |
6 |
Illumina HiSeq 2000 (Homo sapiens) |
|
C GSE68402
|
Chip-seq |
26 |
Illumina MiSeq (Homo sapiens);Illumina HiSeq 2500 (Homo sapiens) |
|
C GSE270130
|
Chip-seq |
27 |
Illumina NovaSeq 6000 (Homo sapiens) |
|
GSE224901
|
RNA-seq |
21 |
Illumina NovaSeq 6000 (Homo sapiens) |
|
GSE100400
|
Chip-seq;RNA-seq;4C_cccDNA |
31 |
Illumina NextSeq 500 (Homo sapiens);Illumina NextSeq 500 (Mus musculus) |
|
GSE173897
|
RNA-seq |
95 |
Illumina HiSeq 4000 (Homo sapiens) |
|
GSE262515
|
RNA-seq |
21 |
Illumina HiSeq 2500 (Homo sapiens);Illumina HiSeq 2500 (Mus musculus) |
|
C GSE131257
|
ATAC-seq;RNA-seq |
19 |
Illumina HiSeq 2500 (Homo sapiens) |
|
GSE94660
|
RNA-seq |
42 |
Illumina HiSeq 2500 (Homo sapiens) |
When the gene can detect a peak in the dataset, a peak plot will be displayed.
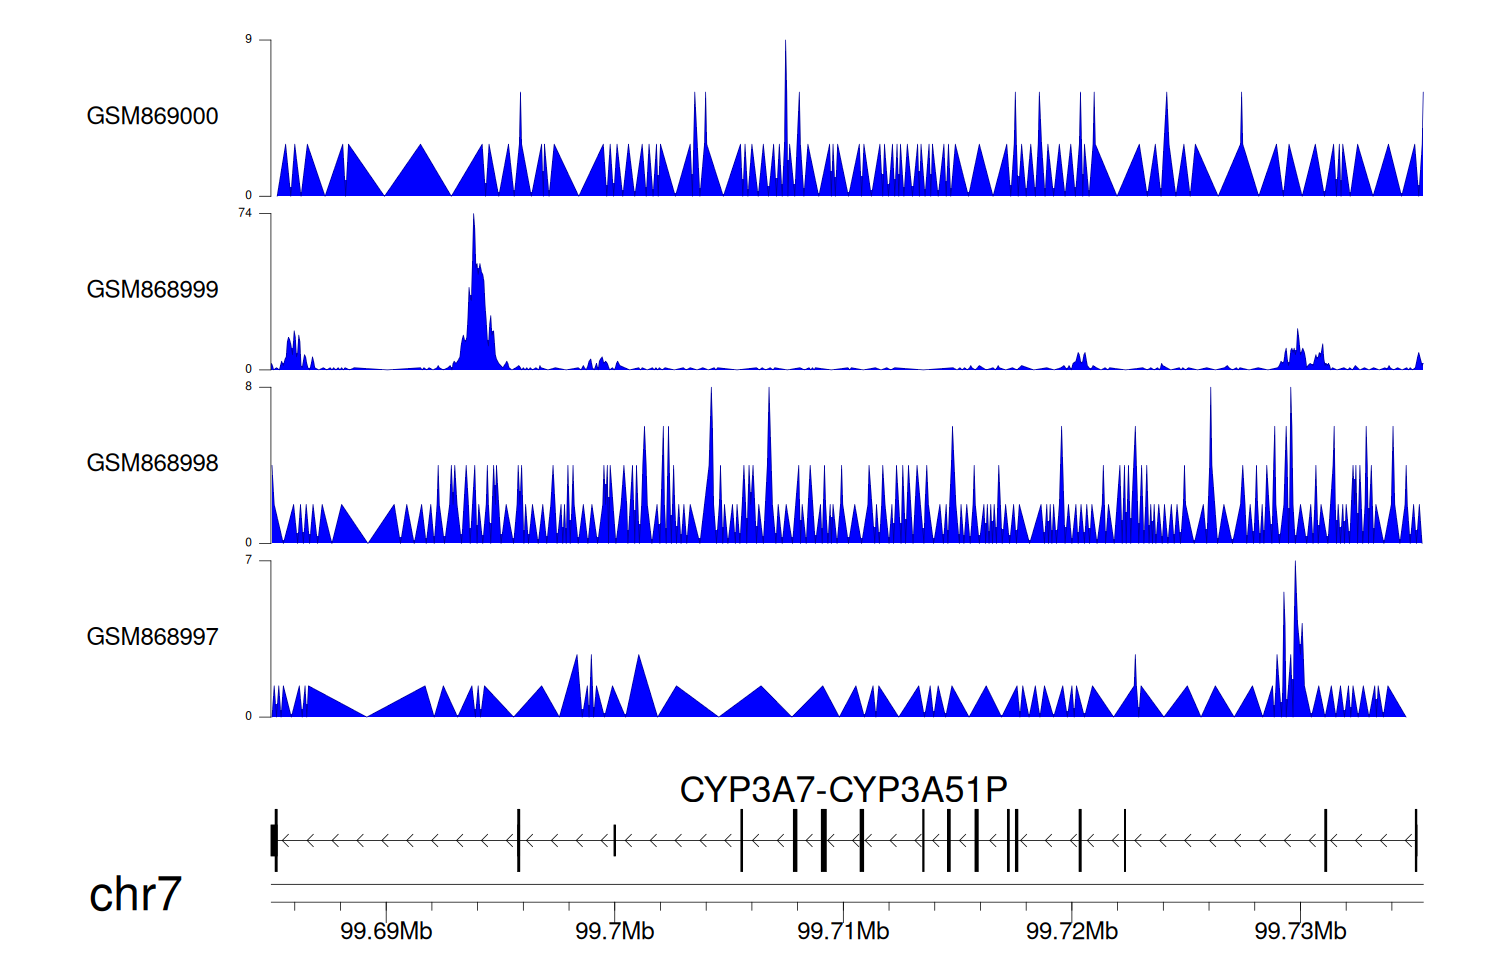
> Dataset: GSE35465 - CYP3A7-CYP3A51P peak across samples
|
Peak Plot
|
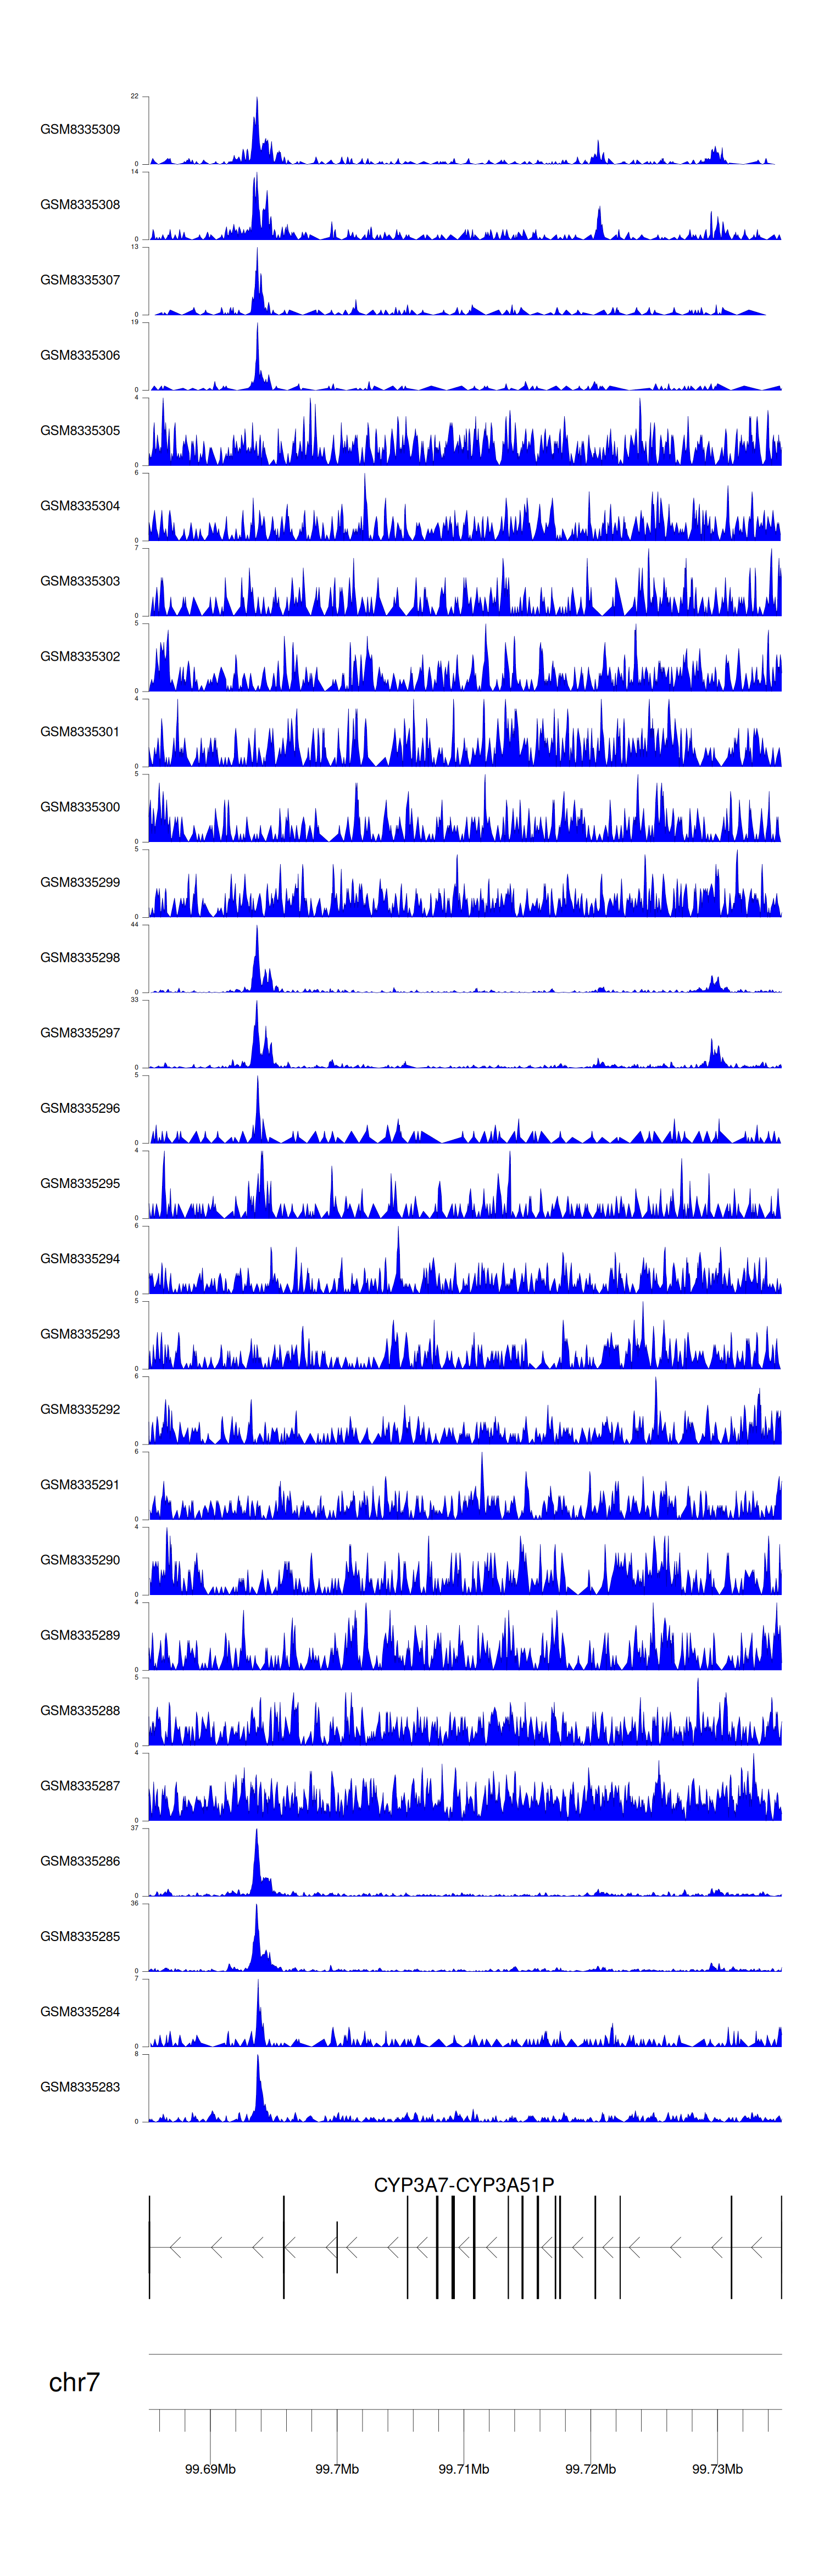
> Dataset: GSE68402 - CYP3A7-CYP3A51P peak across samples
|
Peak Plot
|
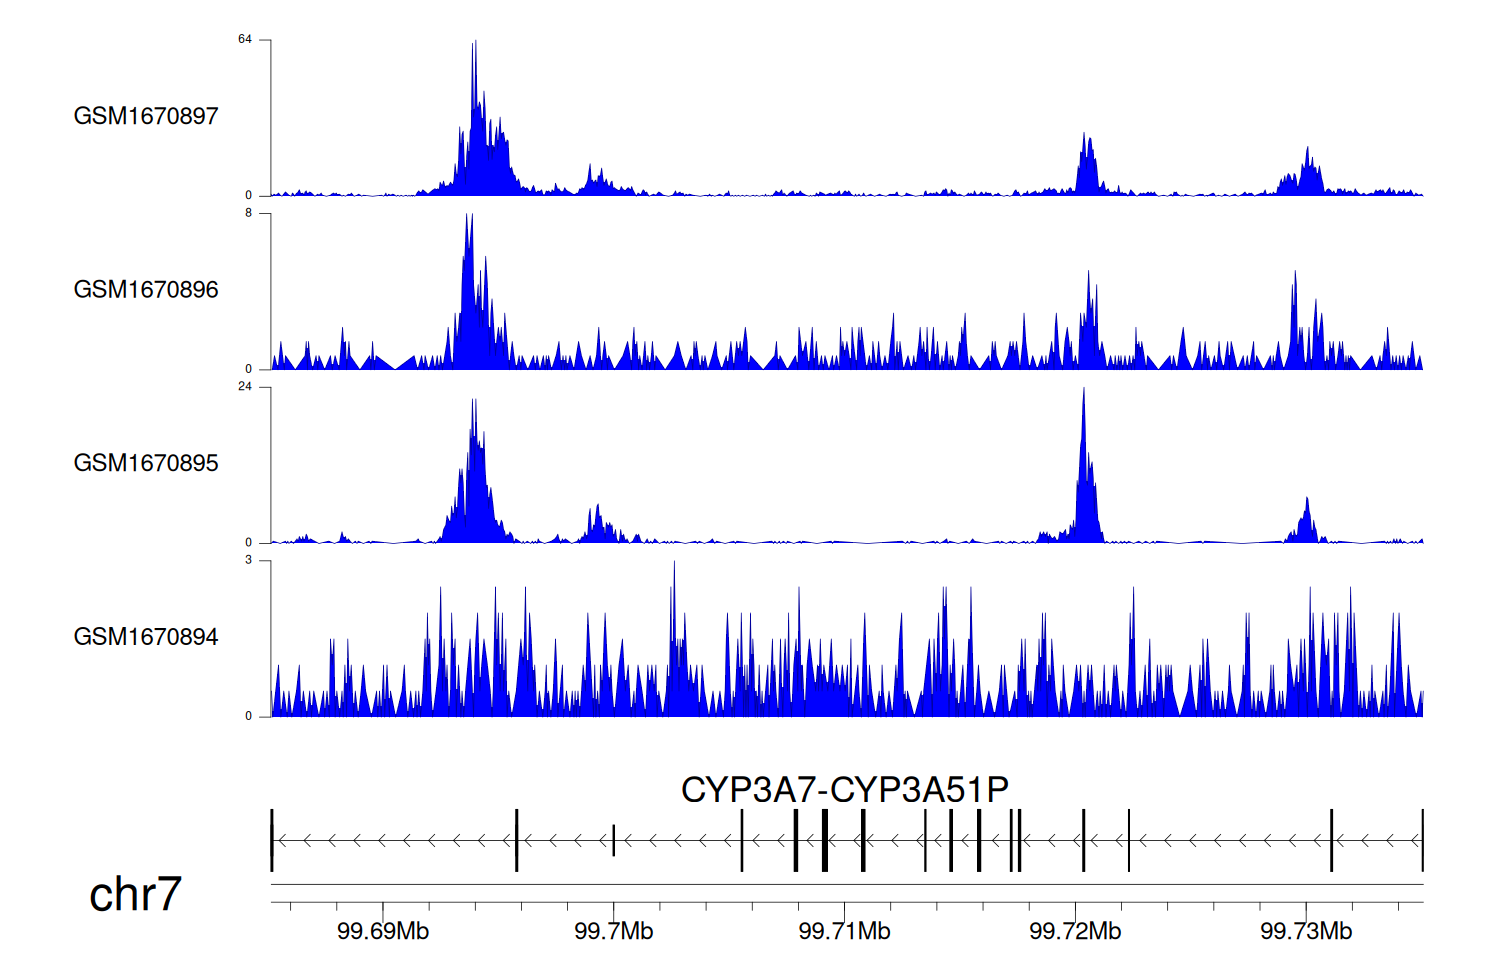
> Dataset: GSE270130 - CYP3A7-CYP3A51P peak across samples
|
Peak Plot
|
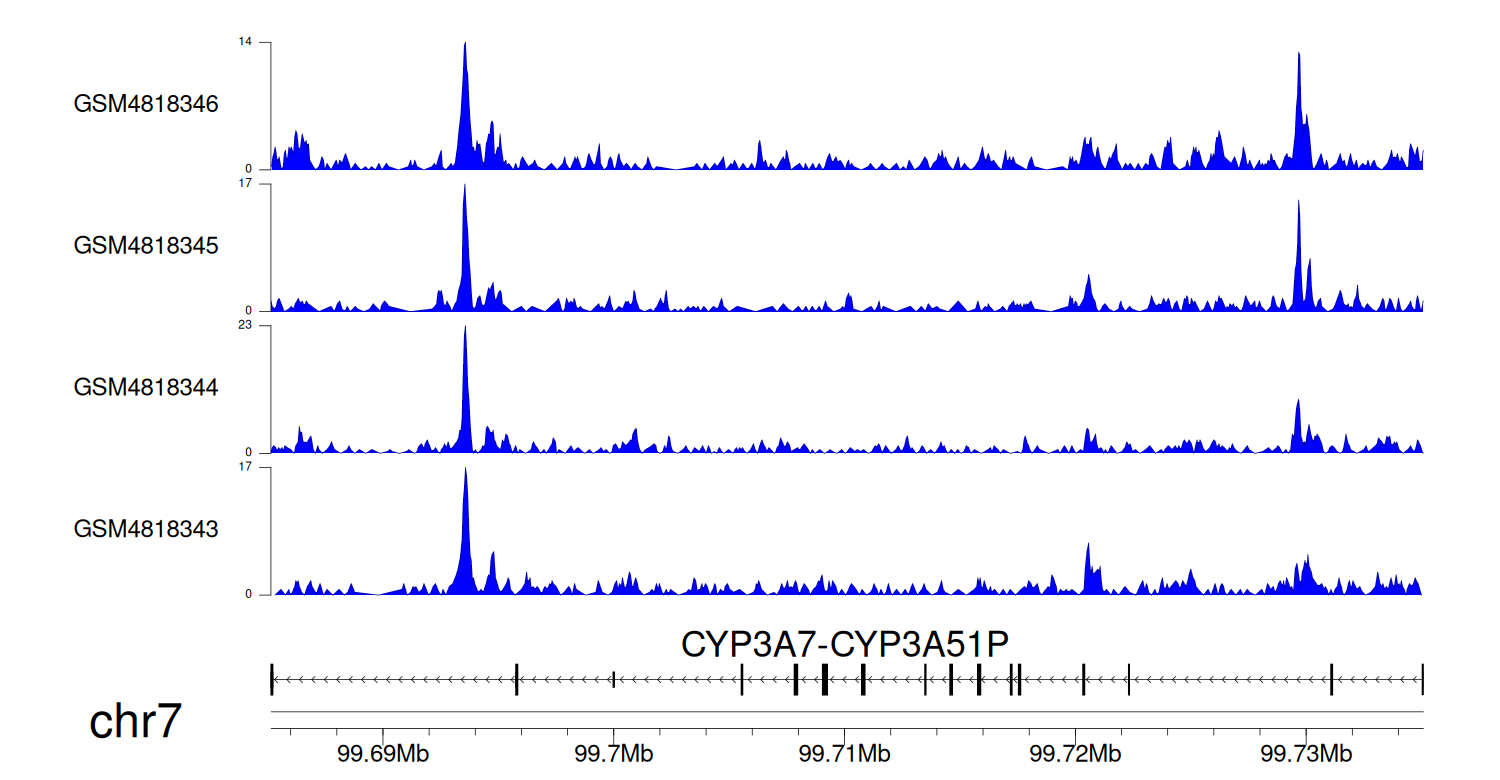
> Dataset: GSE131257 - CYP3A7-CYP3A51P peak across samples
|
Peak Plot
|
|
|
