Gene Information
|
Gene Name
|
DGAT1 |
|
Gene ID
|
8694
|
|
Gene Full Name
|
diacylglycerol O-acyltransferase 1 |
|
Gene Alias
|
ARAT|ARGP1|DGAT|DIAR7 |
|
Transcripts
|
ENSG00000185000
|
|
Virus
|
HTLV1 |
|
Gene Type
|
protein-coding |
|
HPA Location Info
|
Endoplasmic reticulum;Nucleoli, Nucleoli rim; 
|
|
Membrane Info
|
Disease related genes, Enzymes, Human disease related genes, Metabolic proteins, Potential drug targets, Predicted membrane proteins, Transporters |
|
Uniport_ID
|
O75907
|
|
HGNC ID
|
HGNC:2843
|
|
OMIM ID
|
604900 |
|
Summary
|
This gene encodes an multipass transmembrane protein that functions as a key metabolic enzyme. The encoded protein catalyzes the conversion of diacylglycerol and fatty acyl CoA to triacylglycerol. This enzyme can also transfer acyl CoA to retinol. Activity of this protein may be associated with obesity and other metabolic diseases. [provided by RefSeq, Jul 2013] |
Target gene [DGAT1] related to VISs 
Integration Table: if previous studies reported that target gene was altered by virus integration events, the overlap between VISs in this literature and Cistrome factors was listed in this section
| DVID |
Chromosome |
HM |
TFBS |
CA |
Sum of Overlapped Records |
Detail |
| 6011976 |
chr8 |
13 |
4 |
7 |
24 |
View |
| 6018736 |
chr8 |
5 |
4 |
0 |
9 |
View |
| 6018785 |
chr8 |
5 |
4 |
0 |
9 |
View |
Target gene [DGAT1] related to Omics data
| Data ID |
Experiment type |
Sample number |
Platform |
|
GSE189602
|
Methylation profiling (Array) |
4 |
Infinium MethylationEPIC |
|
GSE168557
|
Expression array |
6 |
Agilent-039494 SurePrint G3 Human GE v2 8x60K Microarray 039381 (Feature Number version) |
|
C GSE94732
|
Chip-seq |
24 |
Illumina NextSeq 500 (Homo sapiens);illumina Genome Analyzer IIx (Homo sapiens) |
|
GSE136189
|
Methylation profiling (Array) |
40 |
Illumina HumanMethylation450 BeadChip (HumanMethylation450_15017482);Illumina Infinium HumanMethylation850 BeadChip |
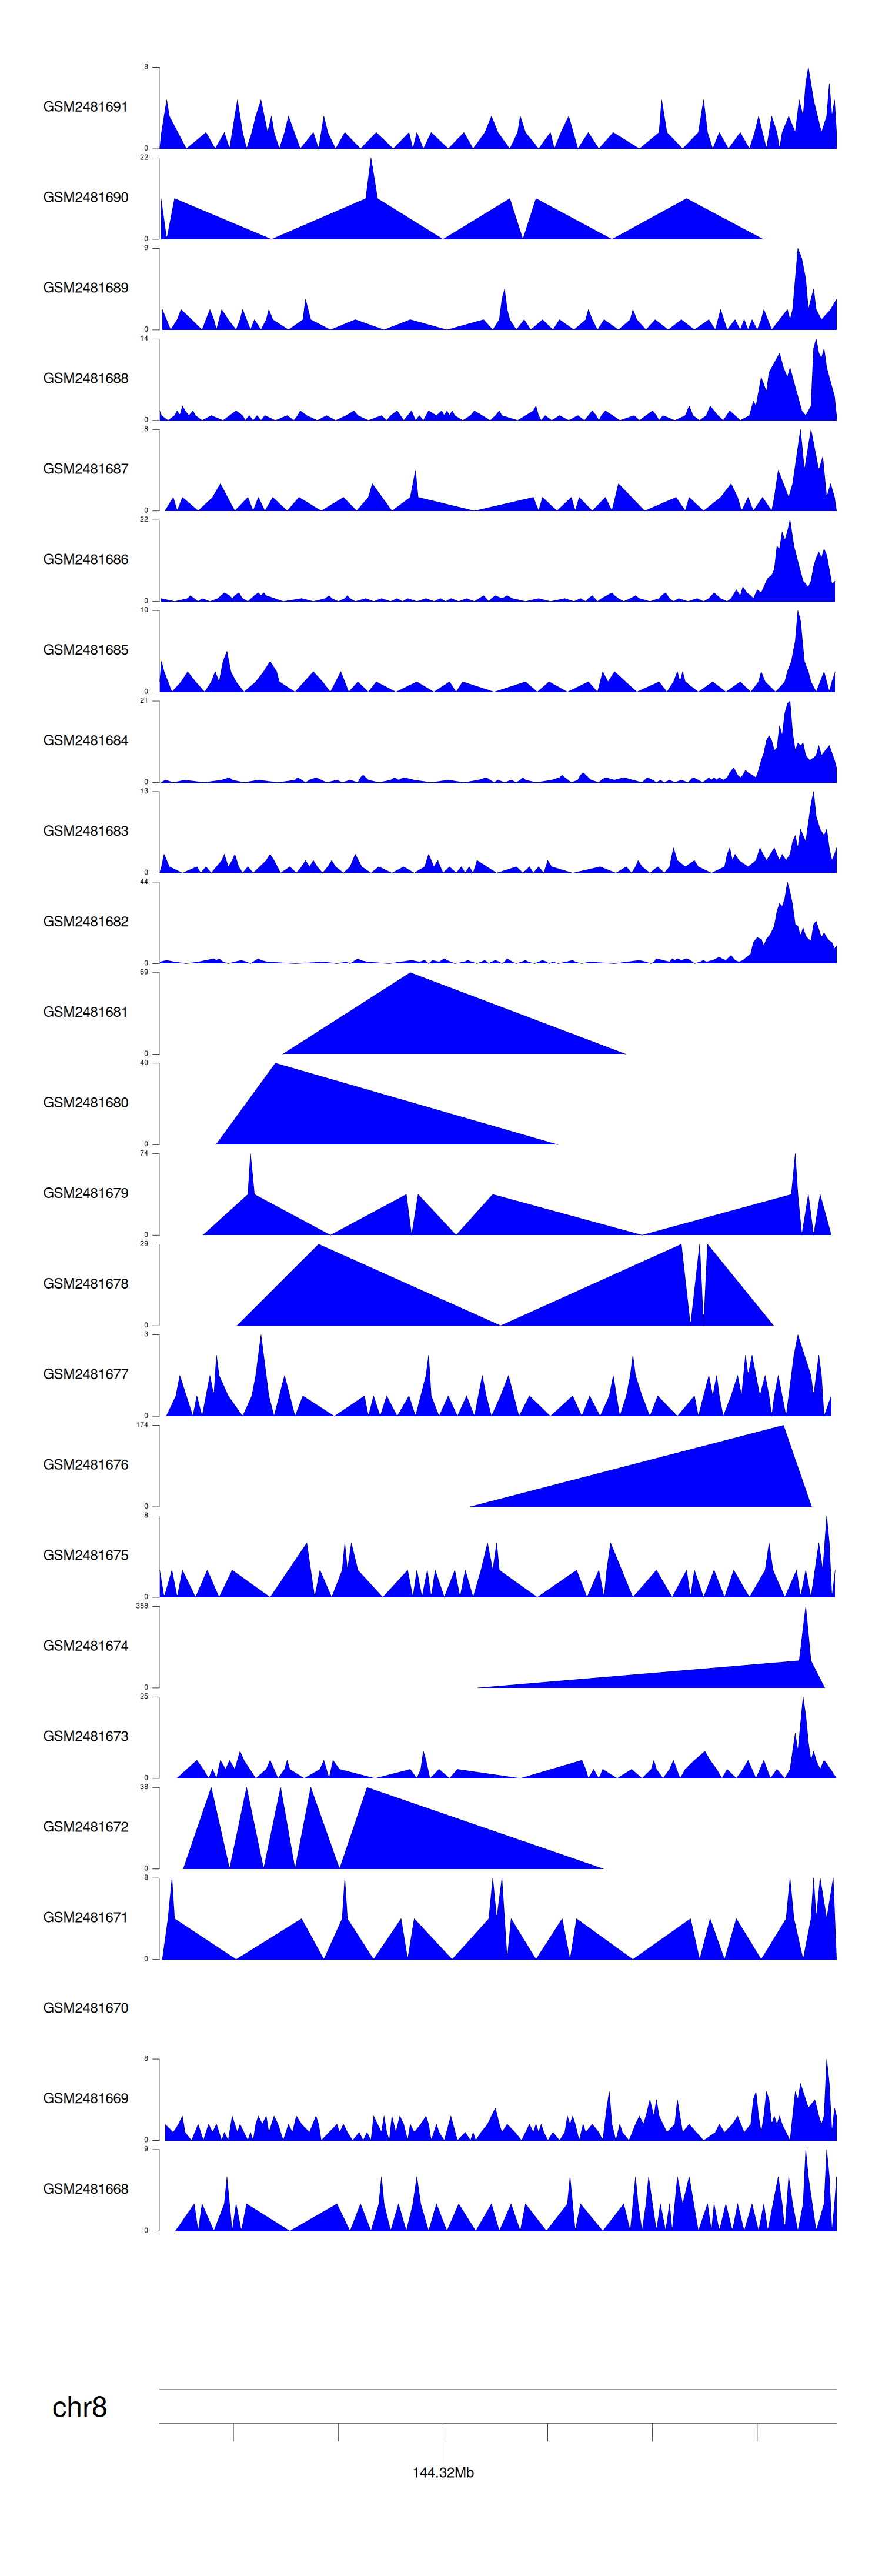
When the gene can detect a peak in the dataset, a peak plot will be displayed.
> Dataset: GSE94732 - DGAT1 peak across samples
|
Peak Plot
|
|
|
