Gene Information
|
Gene Name
|
DLAT |
|
Gene ID
|
1737
|
|
Gene Full Name
|
dihydrolipoamide S-acetyltransferase |
|
Gene Alias
|
DLTA|E2|PBC|PDC-E2|PDCE2 |
|
Transcripts
|
ENSG00000150768
|
|
Virus
|
HBV |
|
Gene Type
|
protein-coding |
|
HPA Location Info
|
Mitochondria;Connecting piece; 
|
|
Membrane Info
|
Citric acid cycle related proteins, Disease related genes, Enzymes, Human disease related genes, Metabolic proteins, Potential drug targets, Predicted intracellular proteins |
|
Uniport_ID
|
P10515
|
|
HGNC ID
|
HGNC:2896
|
|
OMIM ID
|
608770 |
|
Summary
|
This gene encodes component E2 of the multi-enzyme pyruvate dehydrogenase complex (PDC). PDC resides in the inner mitochondrial membrane and catalyzes the conversion of pyruvate to acetyl coenzyme A. The protein product of this gene, dihydrolipoamide acetyltransferase, accepts acetyl groups formed by the oxidative decarboxylation of pyruvate and transfers them to coenzyme A. Dihydrolipoamide acetyltransferase is the antigen for antimitochondrial antibodies. These autoantibodies are present in nearly 95% of patients with the autoimmune liver disease primary biliary cirrhosis (PBC). In PBC, activated T lymphocytes attack and destroy epithelial cells in the bile duct where this protein is abnormally distributed and overexpressed. PBC enventually leads to cirrhosis and liver failure. Mutations in this gene are also a cause of pyruvate dehydrogenase E2 deficiency which causes primary lactic acidosis in infancy and early childhood.[provided by RefSeq, Oct 2009] |
Target gene [DLAT] related to VISs 
Integration Table: if previous studies reported that target gene was altered by virus integration events, the overlap between VISs in this literature and Cistrome factors was listed in this section
| DVID |
Chromosome |
HM |
TFBS |
CA |
Sum of Overlapped Records |
Detail |
| 1005629 |
chr11 |
36 |
13 |
1 |
50 |
View |
Target gene [DLAT] related to Omics data
| Data ID |
Experiment type |
Sample number |
Platform |
|
GSE236281
|
RNA-seq |
12 |
Illumina MiSeq (Homo sapiens) |
|
C GSE35465
|
Chip-seq;RNA-seq |
6 |
Illumina HiSeq 2000 (Homo sapiens) |
|
C GSE68402
|
Chip-seq |
26 |
Illumina MiSeq (Homo sapiens);Illumina HiSeq 2500 (Homo sapiens) |
|
TCGA_LIHC_HBV
|
DNA methylation sequencing;RNA-seq |
97 |
TCGA |
|
C GSE270130
|
Chip-seq |
27 |
Illumina NovaSeq 6000 (Homo sapiens) |
|
GSE224901
|
RNA-seq |
21 |
Illumina NovaSeq 6000 (Homo sapiens) |
|
GSE100400
|
Chip-seq;RNA-seq;4C_cccDNA |
31 |
Illumina NextSeq 500 (Homo sapiens);Illumina NextSeq 500 (Mus musculus) |
|
GSE173897
|
RNA-seq |
95 |
Illumina HiSeq 4000 (Homo sapiens) |
|
GSE262515
|
RNA-seq |
21 |
Illumina HiSeq 2500 (Homo sapiens);Illumina HiSeq 2500 (Mus musculus) |
|
GSE110345
|
RNA-seq |
4 |
Illumina HiSeq 2500 (Homo sapiens) |
|
C GSE131257
|
ATAC-seq;RNA-seq |
19 |
Illumina HiSeq 2500 (Homo sapiens) |
|
GSE94660
|
RNA-seq |
42 |
Illumina HiSeq 2500 (Homo sapiens) |
When the gene can detect a peak in the dataset, a peak plot will be displayed.
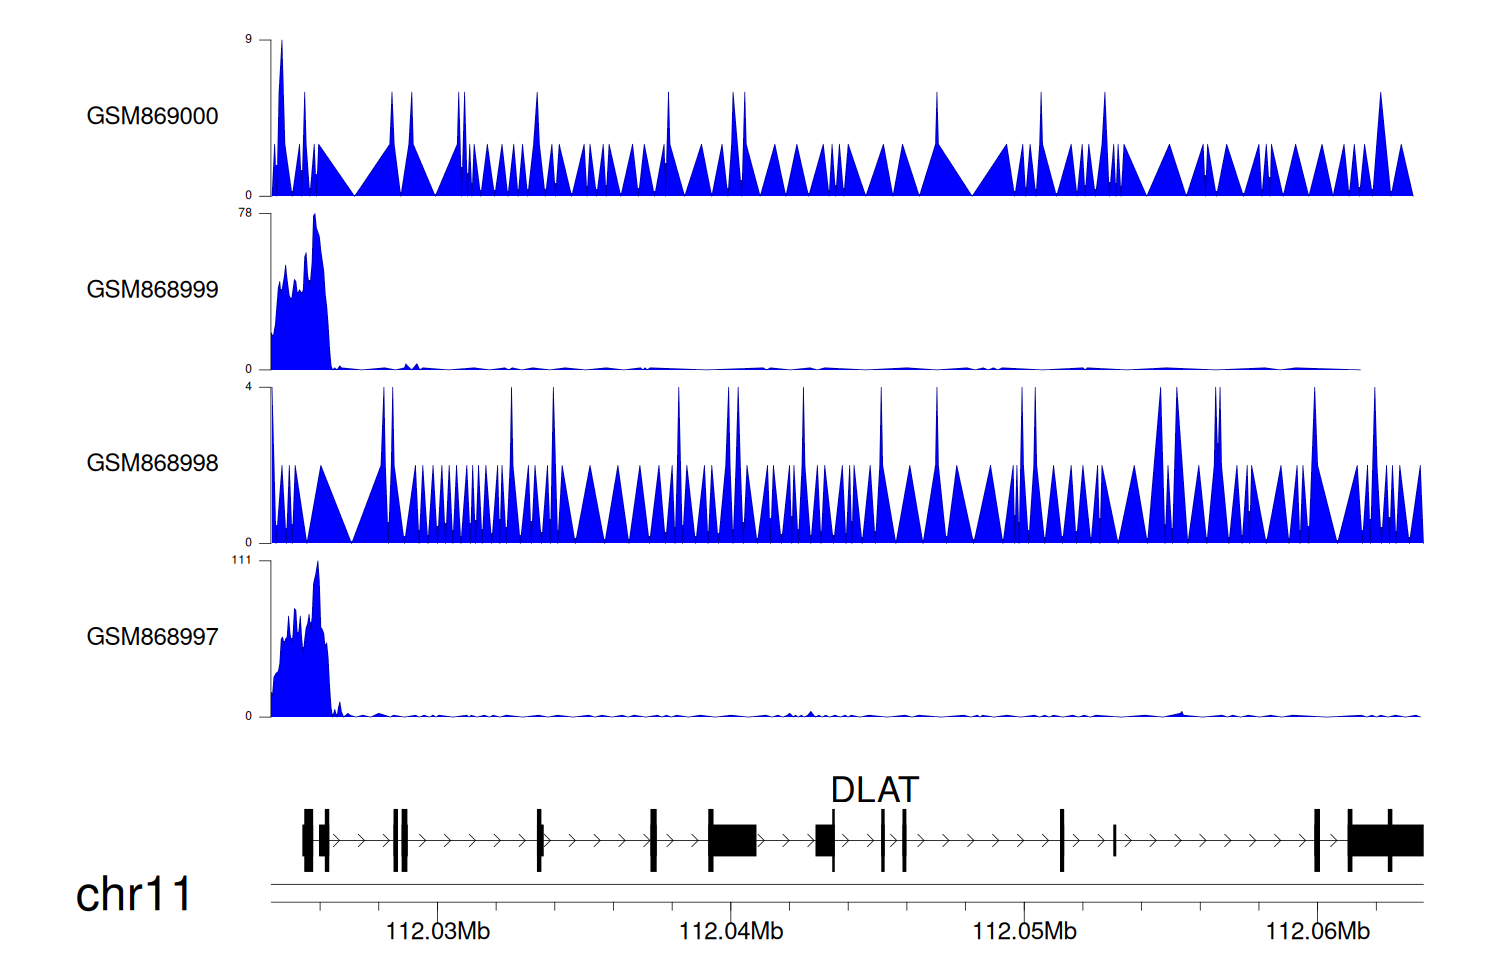
> Dataset: GSE35465 - DLAT peak across samples
|
Peak Plot
|
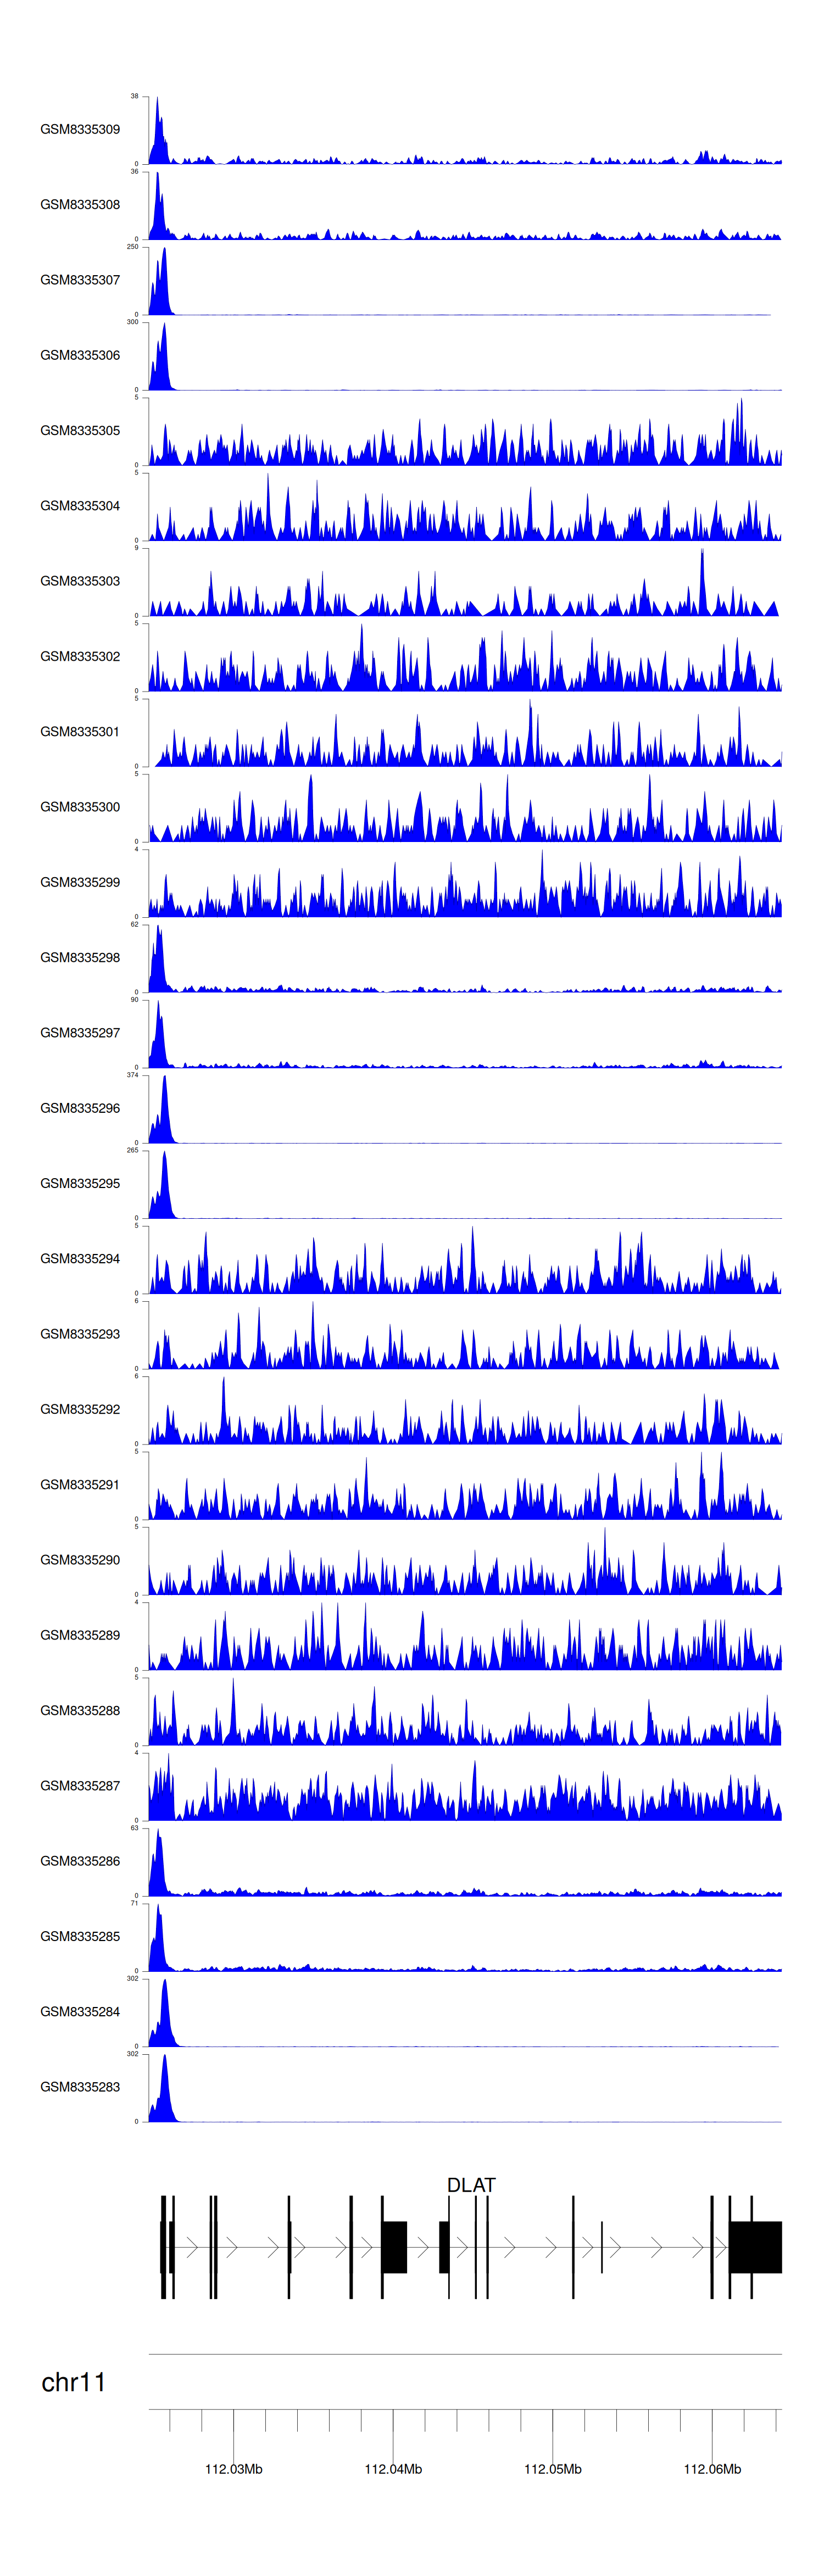
> Dataset: GSE68402 - DLAT peak across samples
|
Peak Plot
|
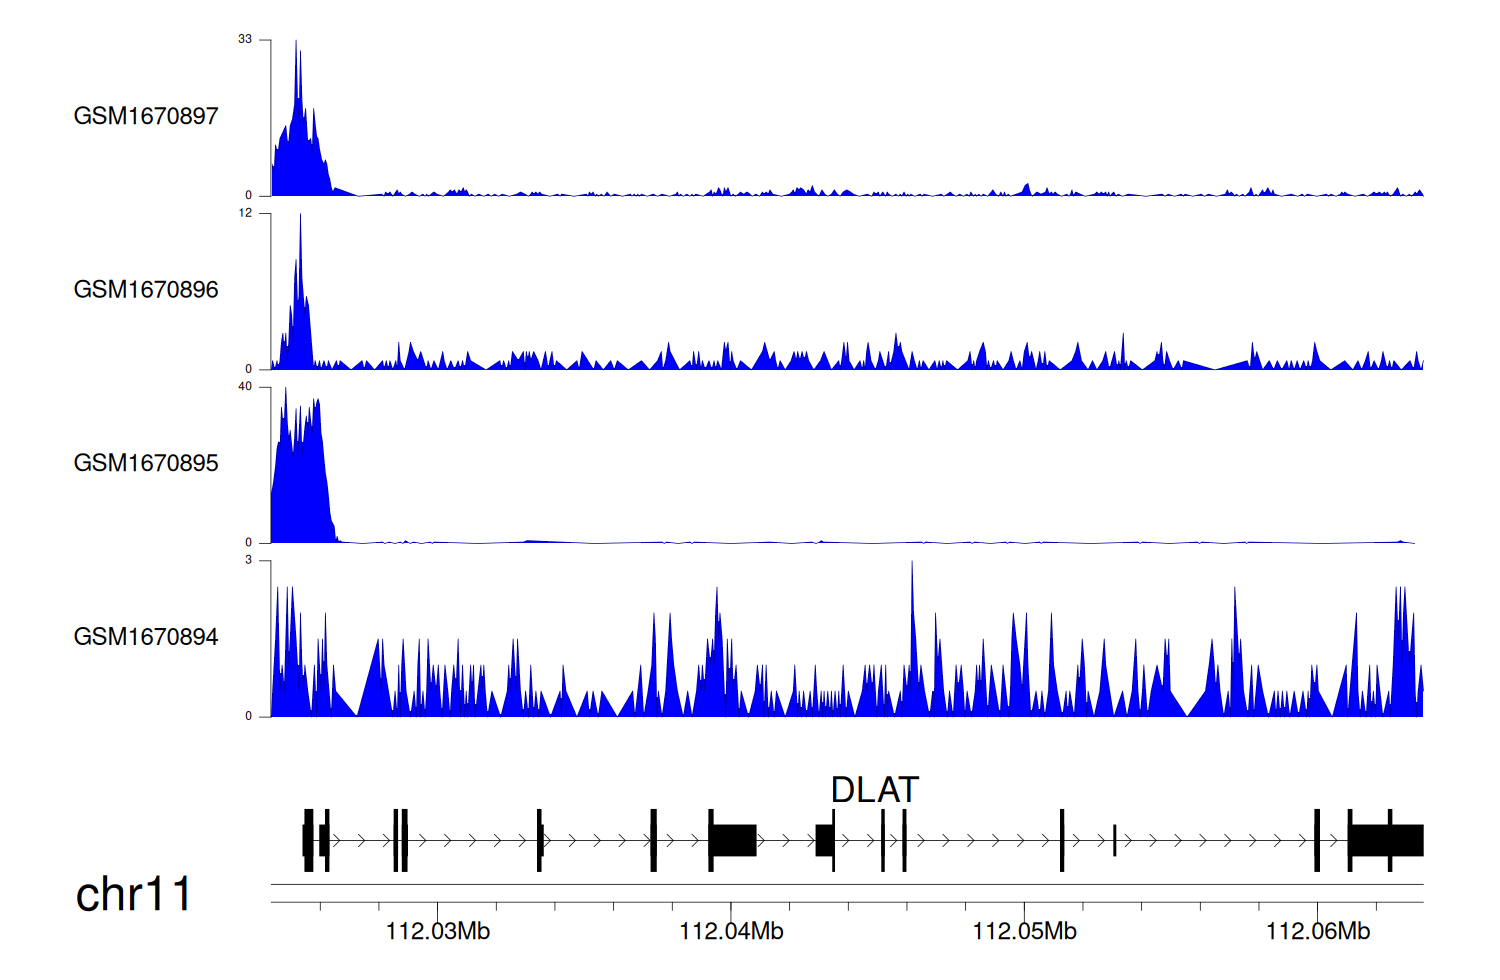
> Dataset: GSE270130 - DLAT peak across samples
|
Peak Plot
|
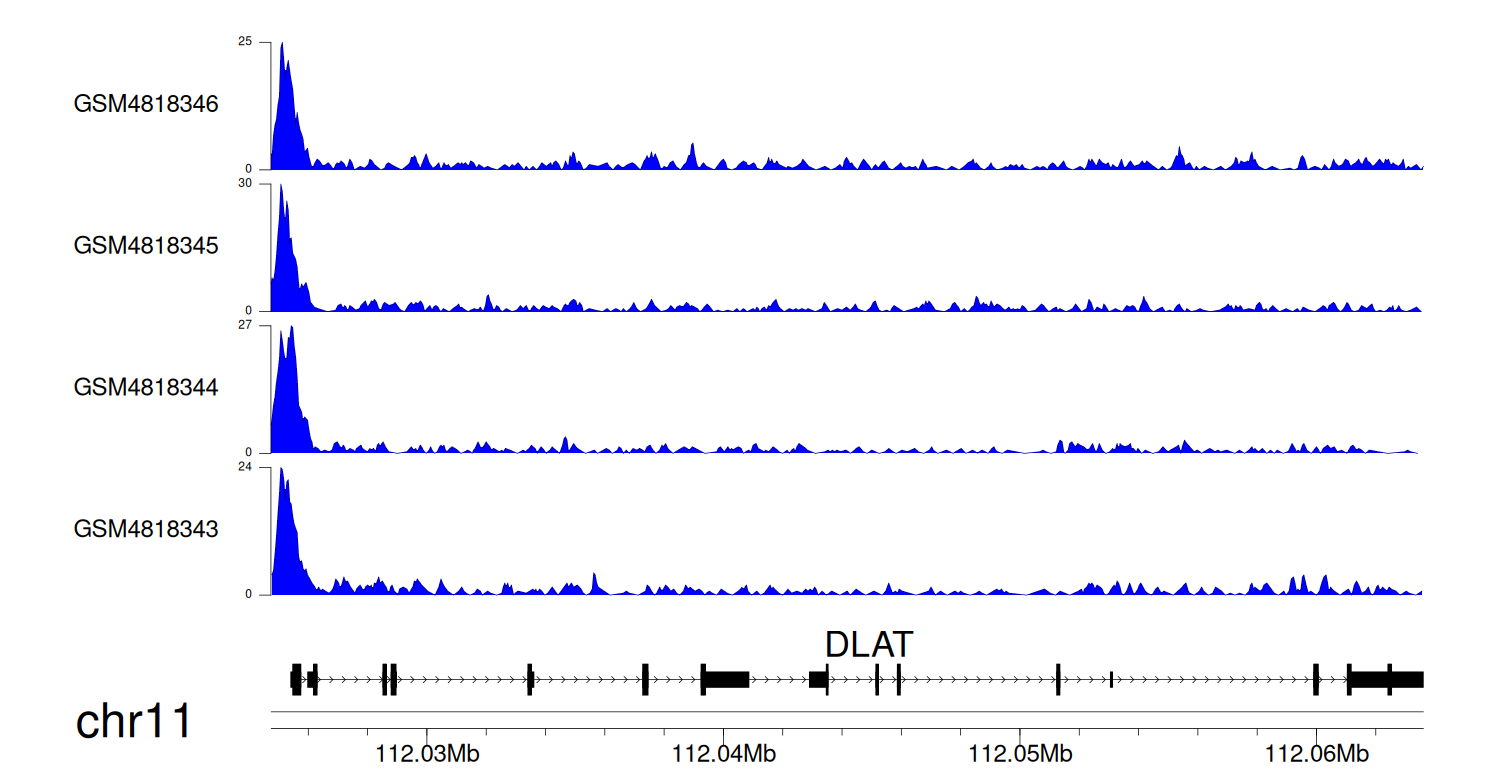
> Dataset: GSE131257 - DLAT peak across samples
|
Peak Plot
|
|
|
