Gene Information
|
Gene Name
|
DYNC2I1 |
|
Gene ID
|
55112
|
|
Gene Full Name
|
dynein 2 intermediate chain 1 |
|
Gene Alias
|
CFAP163|DIC6|FAP163|SRPS6|SRTD8|WDR60 |
|
Transcripts
|
ENSG00000126870
|
|
Virus
|
HTLV1 |
|
Gene Type
|
protein-coding |
|
HPA Location Info
|
Centrosome, Basal body;Primary cilium, Cytosol; 
|
|
Membrane Info
|
Disease related genes, Human disease related genes, Potential drug targets, Predicted intracellular proteins, Transporters |
|
Uniport_ID
|
Q8WVS4
|
|
HGNC ID
|
HGNC:21862
|
|
OMIM ID
|
615462 |
|
Summary
|
This gene encodes a member of the WD repeat protein family. WD repeats are minimally conserved regions of approximately 40 amino acids typically bracketed by gly-his and trp-asp (GH-WD) and may facilitate the formation of heterotrimeric or multiprotein complexes. Members of this family are involved in a variety of cellular processes including cell cycle progression, signal transduction, apoptosis, and gene regulation. The encoded protein contains four WD repeats and may play a role in the formation of cilia. Mutations in this gene have been associated with short-rib polydactyly and Jeune syndromes. [provided by RefSeq, Mar 2014] |
Target gene [DYNC2I1] related to VISs 
Integration Table: if previous studies reported that target gene was altered by virus integration events, the overlap between VISs in this literature and Cistrome factors was listed in this section
| DVID |
Chromosome |
HM |
TFBS |
CA |
Sum of Overlapped Records |
Detail |
| 6006572 |
chr7 |
13 |
31 |
22 |
66 |
View |
| 6011524 |
chr7 |
22 |
3 |
1 |
26 |
View |
| 6011525 |
chr7 |
22 |
3 |
1 |
26 |
View |
Target gene [DYNC2I1] related to Omics data
| Data ID |
Experiment type |
Sample number |
Platform |
|
GSE52244
|
Expression array |
15 |
[HuEx-1_0-st] Affymetrix Human Exon 1.0 ST Array [probe set (exon) version] |
|
GSE224047
|
RNA-seq |
10 |
Illumina NextSeq 500 (Homo sapiens) |
|
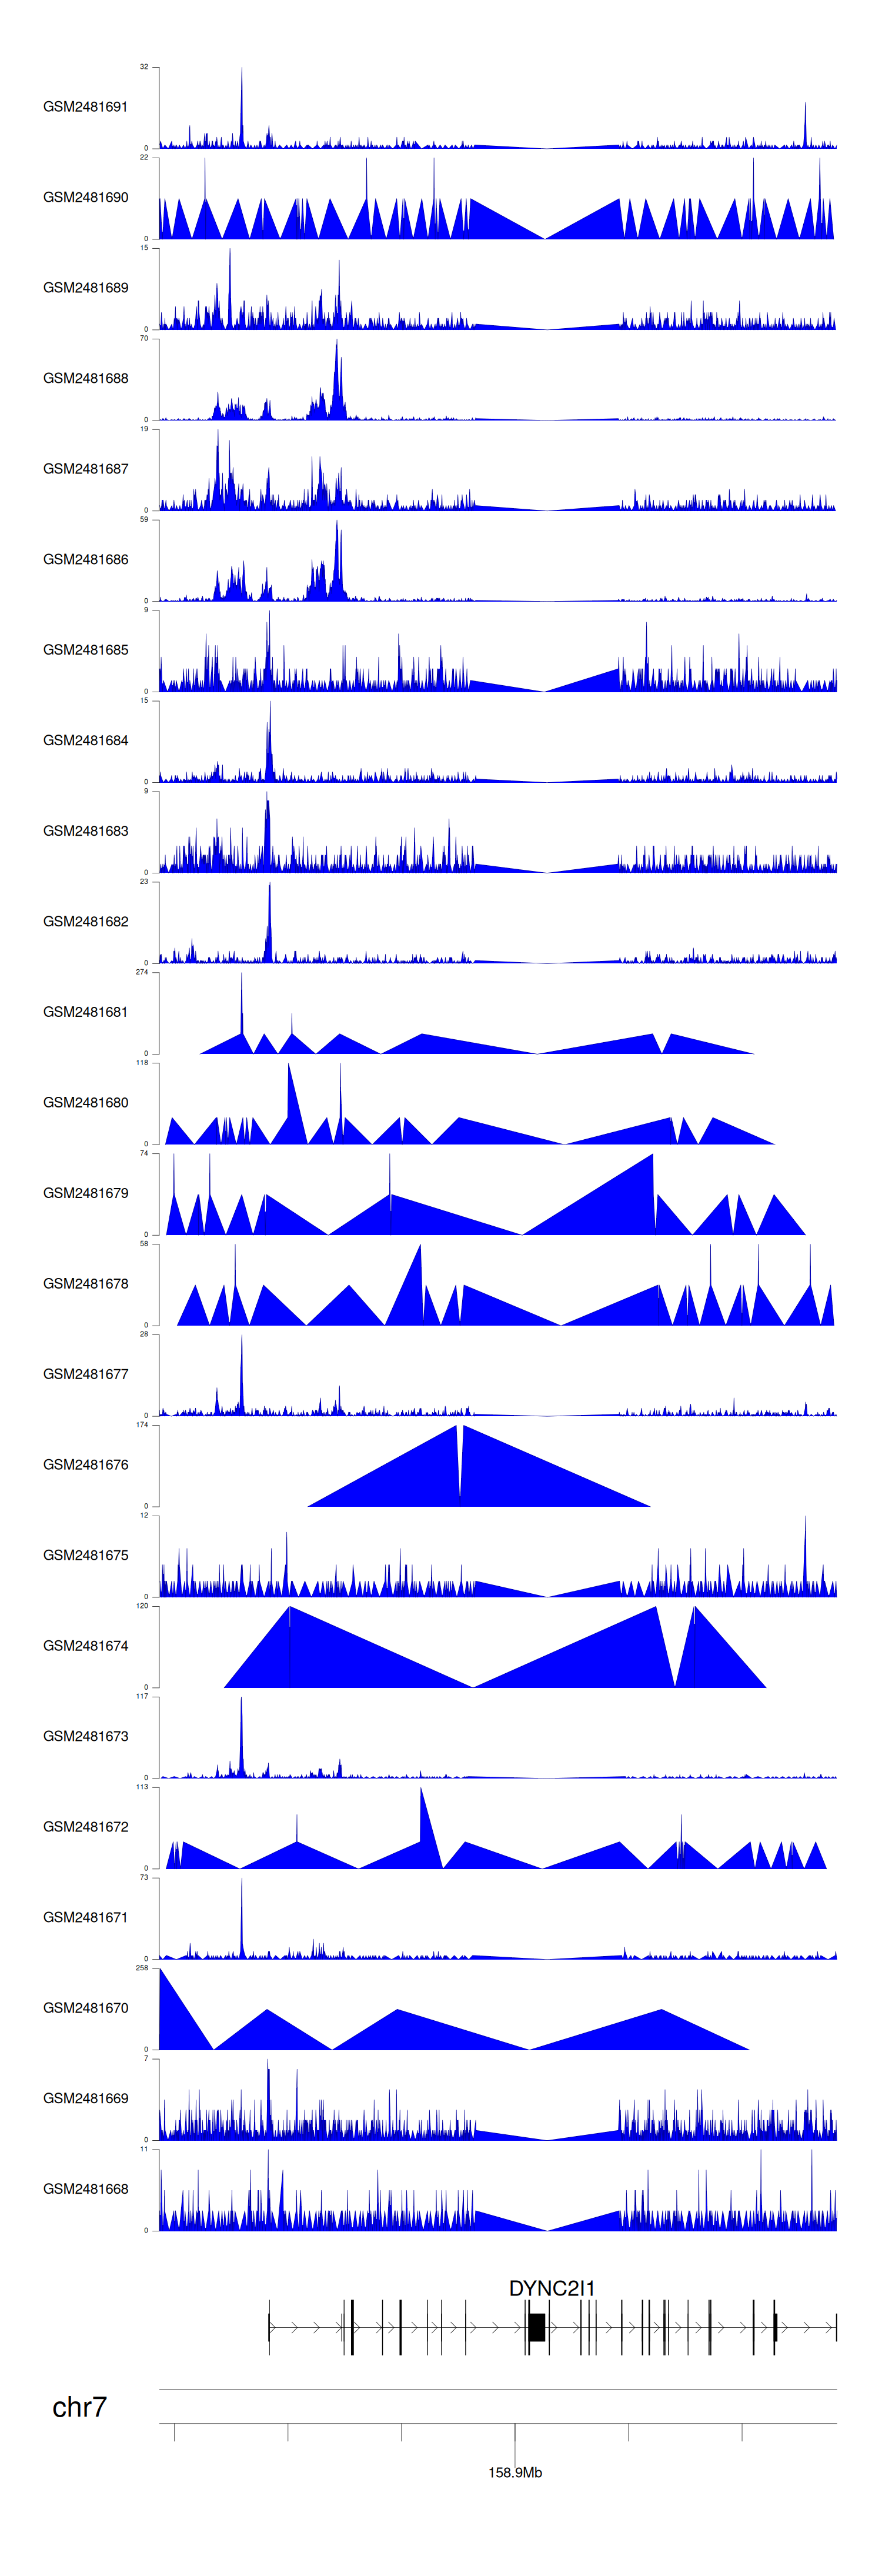
C GSE94732
|
Chip-seq |
24 |
Illumina NextSeq 500 (Homo sapiens);illumina Genome Analyzer IIx (Homo sapiens) |
When the gene can detect a peak in the dataset, a peak plot will be displayed.
> Dataset: GSE94732 - DYNC2I1 peak across samples
|
Peak Plot
|
|
|
