Gene Information
|
Gene Name
|
F2 |
|
Gene ID
|
2147
|
|
Gene Full Name
|
coagulation factor II, thrombin |
|
Gene Alias
|
PT|RPRGL2|THPH1 |
|
Transcripts
|
ENSG00000180210
|
|
Virus
|
HBV |
|
Gene Type
|
protein-coding |
|
HPA Location Info
|
Secreted to blood; 
|
|
Membrane Info
|
Cancer-related genes, Candidate cardiovascular disease genes, Disease related genes, Enzymes, FDA approved drug targets, Human disease related genes, Metabolic proteins, Plasma proteins, Predicted intracellular proteins, Predicted secreted proteins |
|
Uniport_ID
|
P00734
|
|
HGNC ID
|
HGNC:3535
|
|
OMIM ID
|
176930 |
|
Summary
|
This gene encodes the prothrombin protein (also known as coagulation factor II). This protein is proteolytically cleaved in multiple steps to form the activated serine protease thrombin. The activated thrombin enzyme plays an important role in thrombosis and hemostasis by converting fibrinogen to fibrin during blood clot formation, by stimulating platelet aggregation, and by activating additional coagulation factors. Thrombin also plays a role in cell proliferation, tissue repair, and angiogenesis as well as maintaining vascular integrity during development and postnatal life. Peptides derived from the C-terminus of this protein have antimicrobial activity against E. coli and P. aeruginosa. Mutations in this gene lead to various forms of thrombosis and dysprothrombinemia. Rapid increases in cytokine levels following coronavirus infections can dysregulate the coagulation cascade and produce thrombosis, compromised blood supply, and organ failure. [provided by RefSeq, May 2020] |
Target gene [F2] related to VISs 
Integration Table: if previous studies reported that target gene was altered by virus integration events, the overlap between VISs in this literature and Cistrome factors was listed in this section
| DVID |
Chromosome |
HM |
TFBS |
CA |
Sum of Overlapped Records |
Detail |
| 1039061 |
chr11 |
9 |
20 |
0 |
29 |
View |
| 1039062 |
chr11 |
9 |
21 |
0 |
30 |
View |
Target gene [F2] related to Omics data
| Data ID |
Experiment type |
Sample number |
Platform |
|
GSE236281
|
RNA-seq |
12 |
Illumina MiSeq (Homo sapiens) |
|
C GSE35465
|
Chip-seq;RNA-seq |
6 |
Illumina HiSeq 2000 (Homo sapiens) |
|
C GSE68402
|
Chip-seq |
26 |
Illumina MiSeq (Homo sapiens);Illumina HiSeq 2500 (Homo sapiens) |
|
TCGA_LIHC_HBV
|
DNA methylation sequencing;RNA-seq |
97 |
TCGA |
|
C GSE270130
|
Chip-seq |
27 |
Illumina NovaSeq 6000 (Homo sapiens) |
|
GSE224901
|
RNA-seq |
21 |
Illumina NovaSeq 6000 (Homo sapiens) |
|
GSE100400
|
Chip-seq;RNA-seq;4C_cccDNA |
31 |
Illumina NextSeq 500 (Homo sapiens);Illumina NextSeq 500 (Mus musculus) |
|
GSE173897
|
RNA-seq |
95 |
Illumina HiSeq 4000 (Homo sapiens) |
|
GSE262515
|
RNA-seq |
21 |
Illumina HiSeq 2500 (Homo sapiens);Illumina HiSeq 2500 (Mus musculus) |
|
GSE110345
|
RNA-seq |
4 |
Illumina HiSeq 2500 (Homo sapiens) |
|
C GSE131257
|
ATAC-seq;RNA-seq |
19 |
Illumina HiSeq 2500 (Homo sapiens) |
|
GSE94660
|
RNA-seq |
42 |
Illumina HiSeq 2500 (Homo sapiens) |
When the gene can detect a peak in the dataset, a peak plot will be displayed.
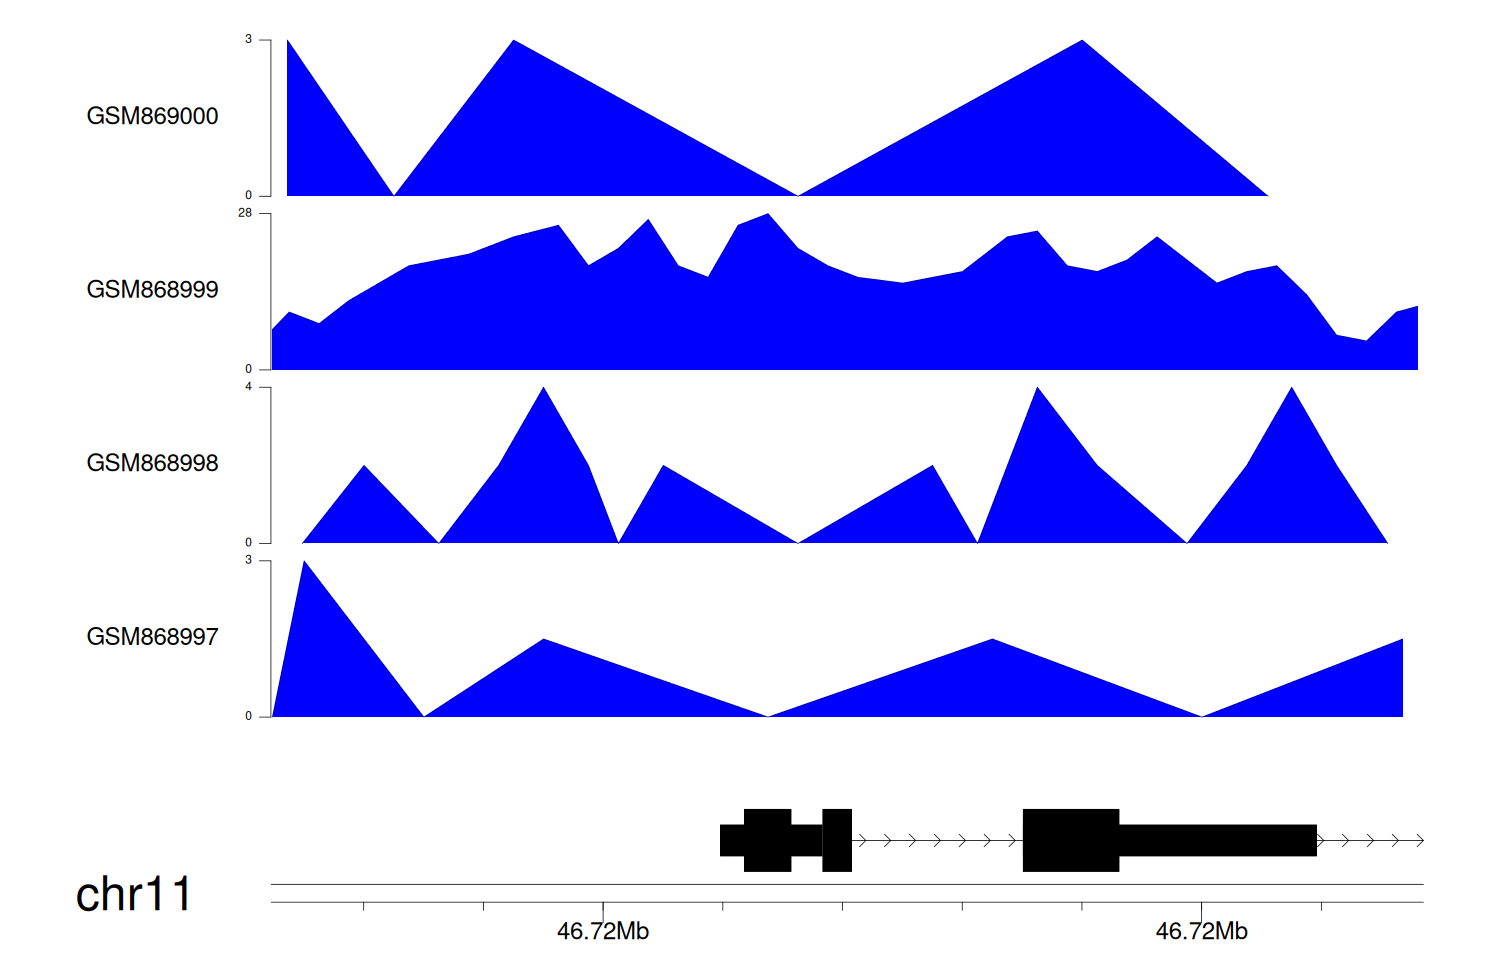
> Dataset: GSE35465 - F2 peak across samples
|
Peak Plot
|
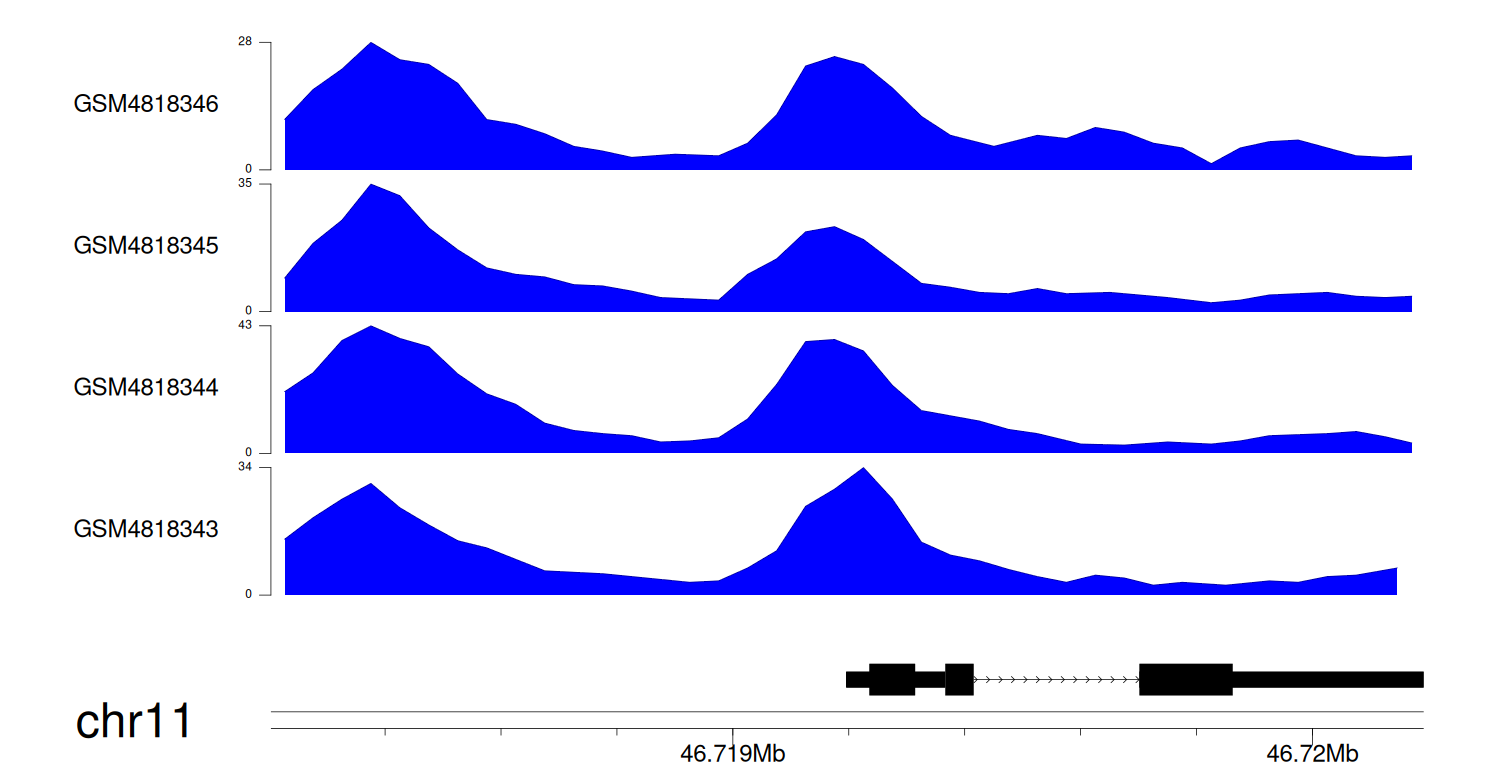
> Dataset: GSE68402 - F2 peak across samples
|
Peak Plot
|
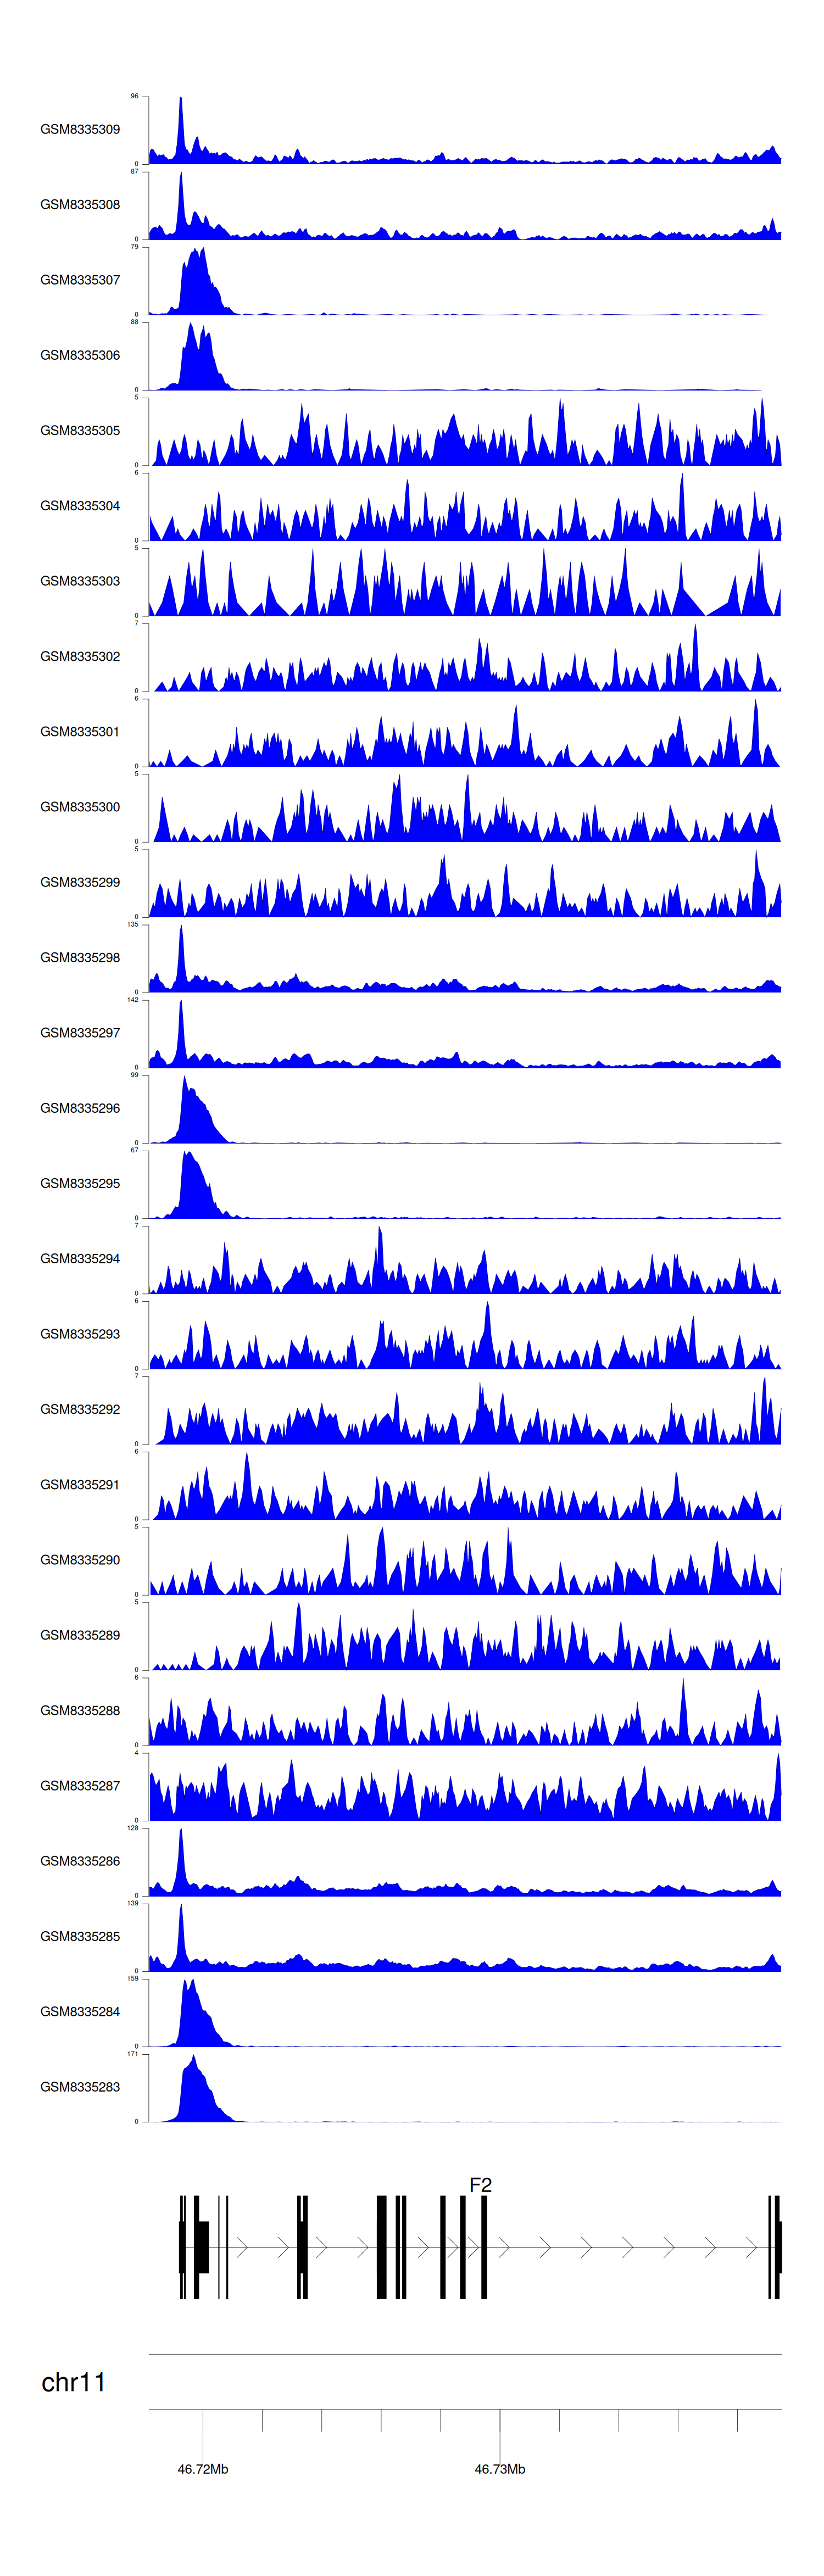
> Dataset: GSE270130 - F2 peak across samples
|
Peak Plot
|
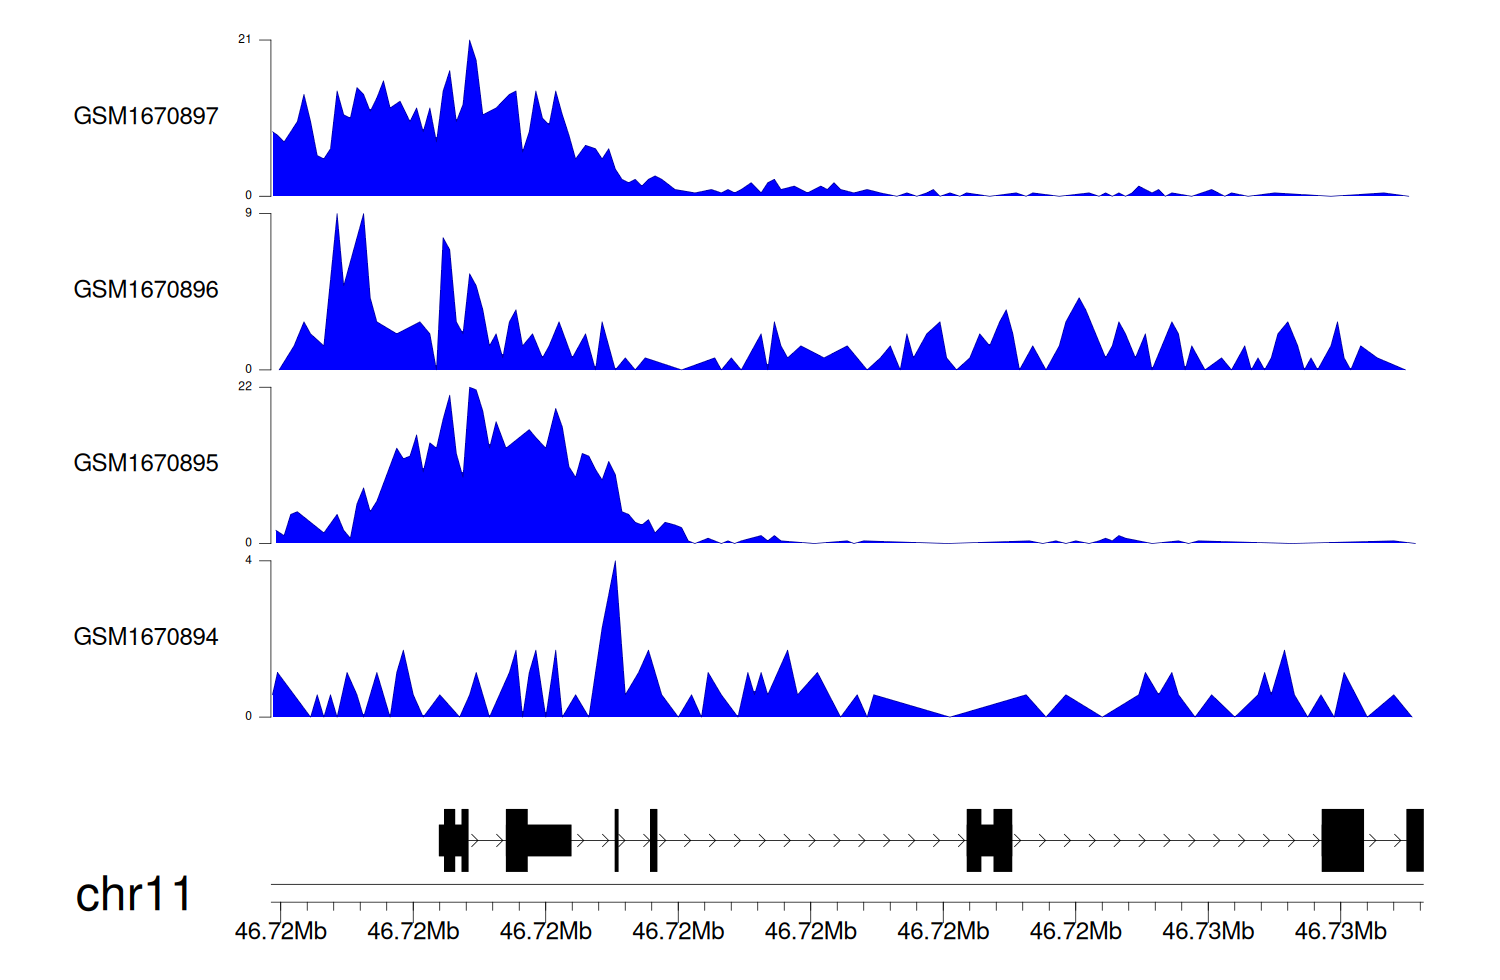
> Dataset: GSE131257 - F2 peak across samples
|
Peak Plot
|
|
|
