Gene Information
|
Gene Name
|
FANCC |
|
Gene ID
|
2176
|
|
Gene Full Name
|
FA complementation group C |
|
Gene Alias
|
FA3|FAC|FACC |
|
Transcripts
|
ENSG00000158169
|
|
Virus
|
HBV |
|
Gene Type
|
protein-coding |
|
HPA Location Info
|
Nucleoplasm; 
|
|
Membrane Info
|
Cancer-related genes, Disease related genes, Human disease related genes, Plasma proteins, Predicted intracellular proteins |
|
Uniport_ID
|
Q00597
|
|
HGNC ID
|
HGNC:3584
|
|
OMIM ID
|
613899 |
|
Summary
|
The Fanconi anemia complementation group (FANC) currently includes FANCA, FANCB, FANCC, FANCD1 (also called BRCA2), FANCD2, FANCE, FANCF, FANCG, FANCI, FANCJ (also called BRIP1), FANCL, FANCM and FANCN (also called PALB2). The previously defined group FANCH is the same as FANCA. Fanconi anemia is a genetically heterogeneous recessive disorder characterized by cytogenetic instability, hypersensitivity to DNA crosslinking agents, increased chromosomal breakage, and defective DNA repair. The members of the Fanconi anemia complementation group do not share sequence similarity; they are related by their assembly into a common nuclear protein complex. This gene encodes the protein for complementation group C. [provided by RefSeq, Jul 2008] |
Target gene [FANCC] related to VISs 
Integration Table: if previous studies reported that target gene was altered by virus integration events, the overlap between VISs in this literature and Cistrome factors was listed in this section
| DVID |
Chromosome |
HM |
TFBS |
CA |
Sum of Overlapped Records |
Detail |
| 1011660 |
chr9 |
6 |
2 |
0 |
8 |
View |
| 1012140 |
chr9 |
5 |
2 |
0 |
7 |
View |
| 1043468 |
chr9 |
12 |
5 |
0 |
17 |
View |
Target gene [FANCC] related to Omics data
| Data ID |
Experiment type |
Sample number |
Platform |
|
GSE236281
|
RNA-seq |
12 |
Illumina MiSeq (Homo sapiens) |
|
C GSE35465
|
Chip-seq;RNA-seq |
6 |
Illumina HiSeq 2000 (Homo sapiens) |
|
C GSE68402
|
Chip-seq |
26 |
Illumina MiSeq (Homo sapiens);Illumina HiSeq 2500 (Homo sapiens) |
|
TCGA_LIHC_HBV
|
DNA methylation sequencing;RNA-seq |
97 |
TCGA |
|
C GSE270130
|
Chip-seq |
27 |
Illumina NovaSeq 6000 (Homo sapiens) |
|
GSE224901
|
RNA-seq |
21 |
Illumina NovaSeq 6000 (Homo sapiens) |
|
GSE100400
|
Chip-seq;RNA-seq;4C_cccDNA |
31 |
Illumina NextSeq 500 (Homo sapiens);Illumina NextSeq 500 (Mus musculus) |
|
GSE173897
|
RNA-seq |
95 |
Illumina HiSeq 4000 (Homo sapiens) |
|
GSE262515
|
RNA-seq |
21 |
Illumina HiSeq 2500 (Homo sapiens);Illumina HiSeq 2500 (Mus musculus) |
|
GSE110345
|
RNA-seq |
4 |
Illumina HiSeq 2500 (Homo sapiens) |
|
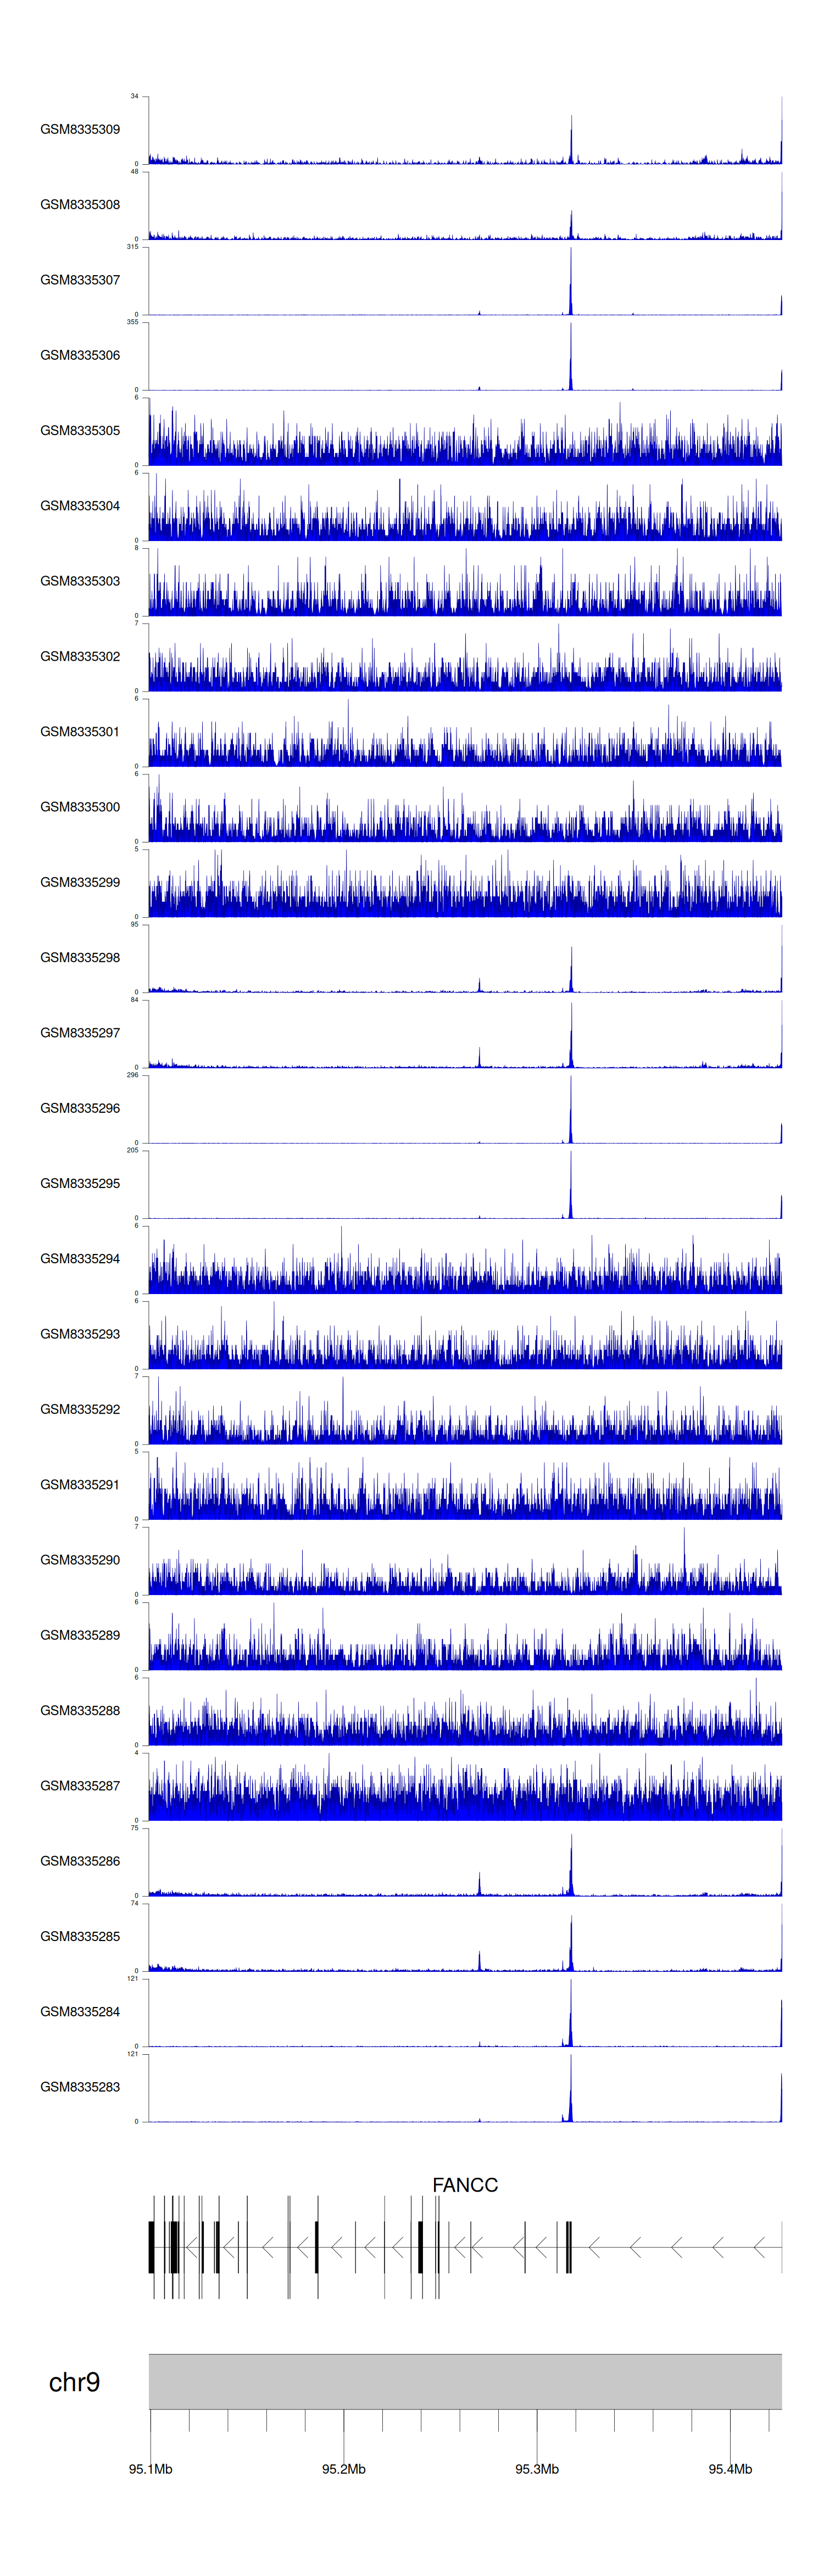
C GSE131257
|
ATAC-seq;RNA-seq |
19 |
Illumina HiSeq 2500 (Homo sapiens) |
|
GSE94660
|
RNA-seq |
42 |
Illumina HiSeq 2500 (Homo sapiens) |
When the gene can detect a peak in the dataset, a peak plot will be displayed.
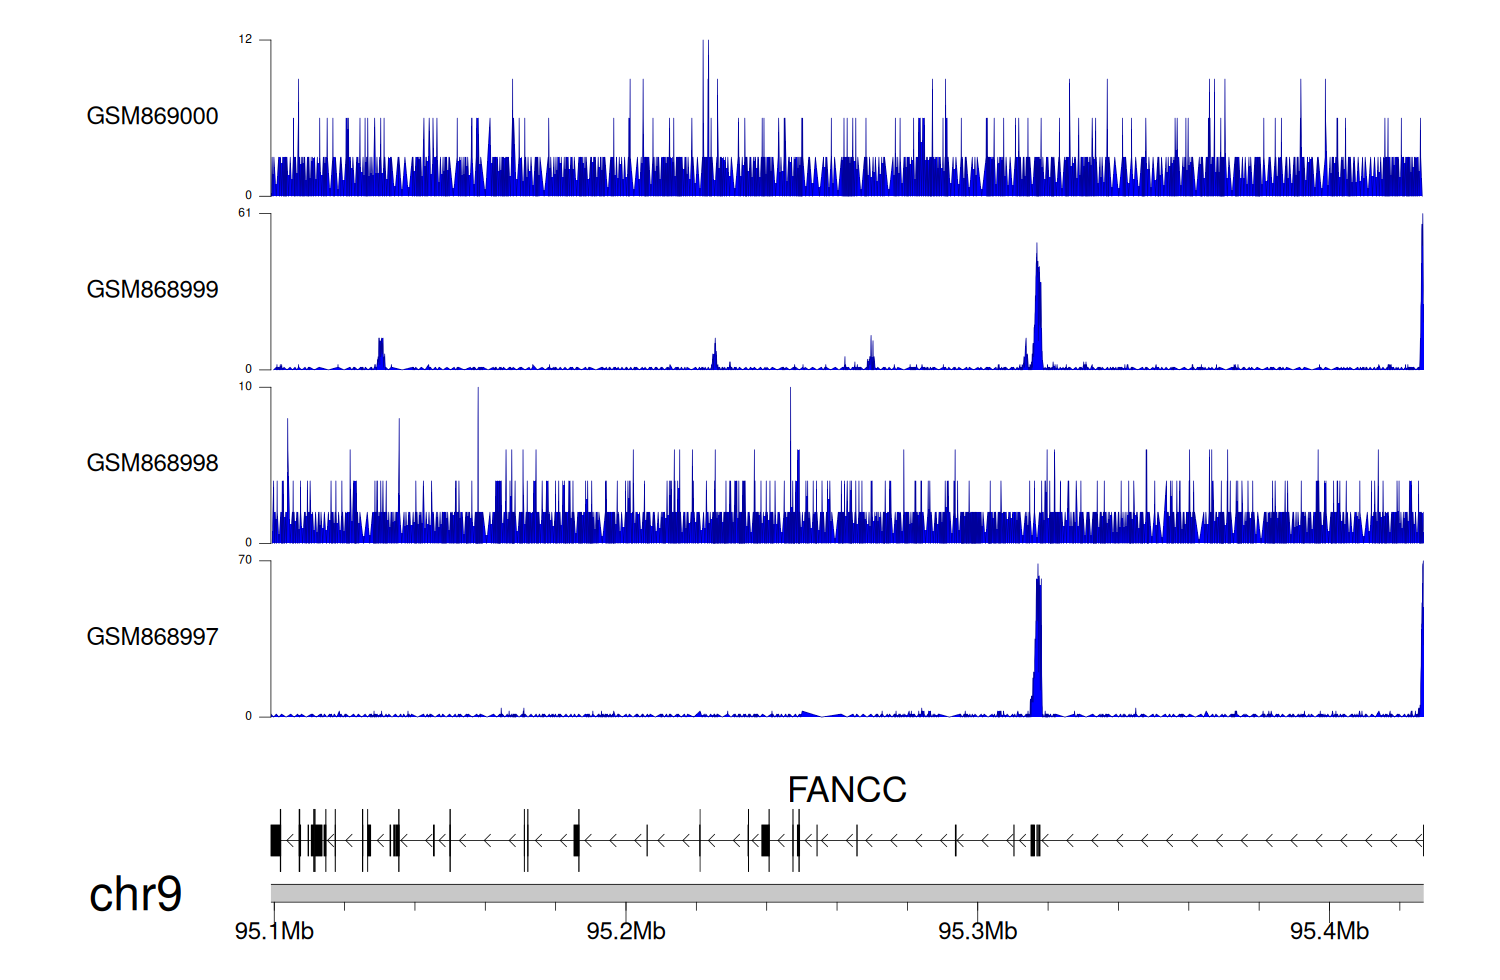
> Dataset: GSE35465 - FANCC peak across samples
|
Peak Plot
|
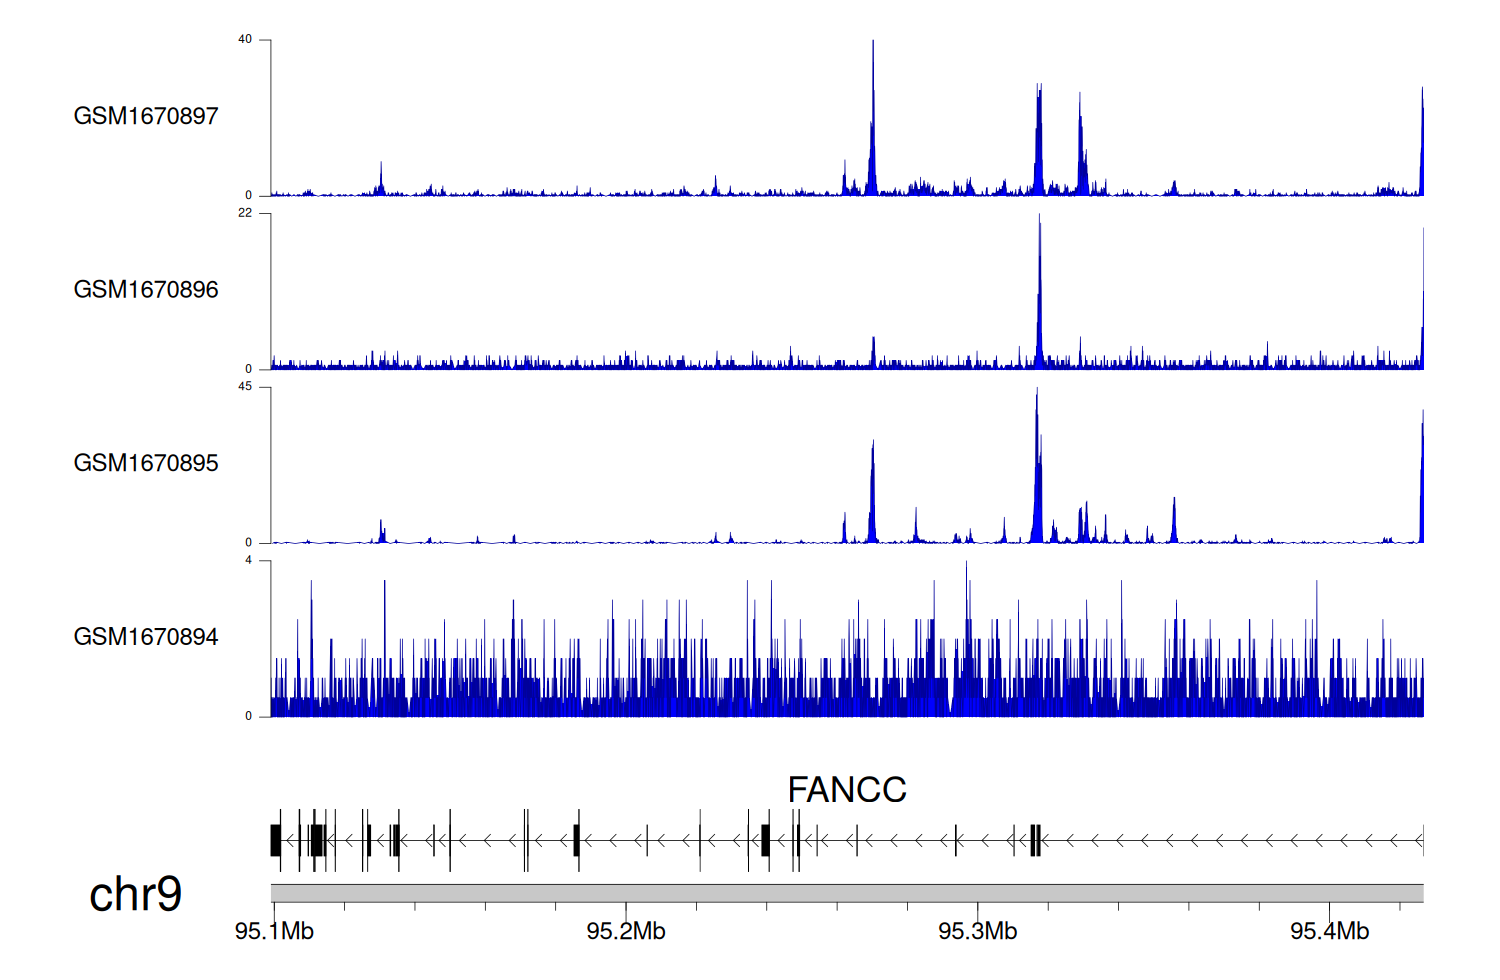
> Dataset: GSE68402 - FANCC peak across samples
|
Peak Plot
|
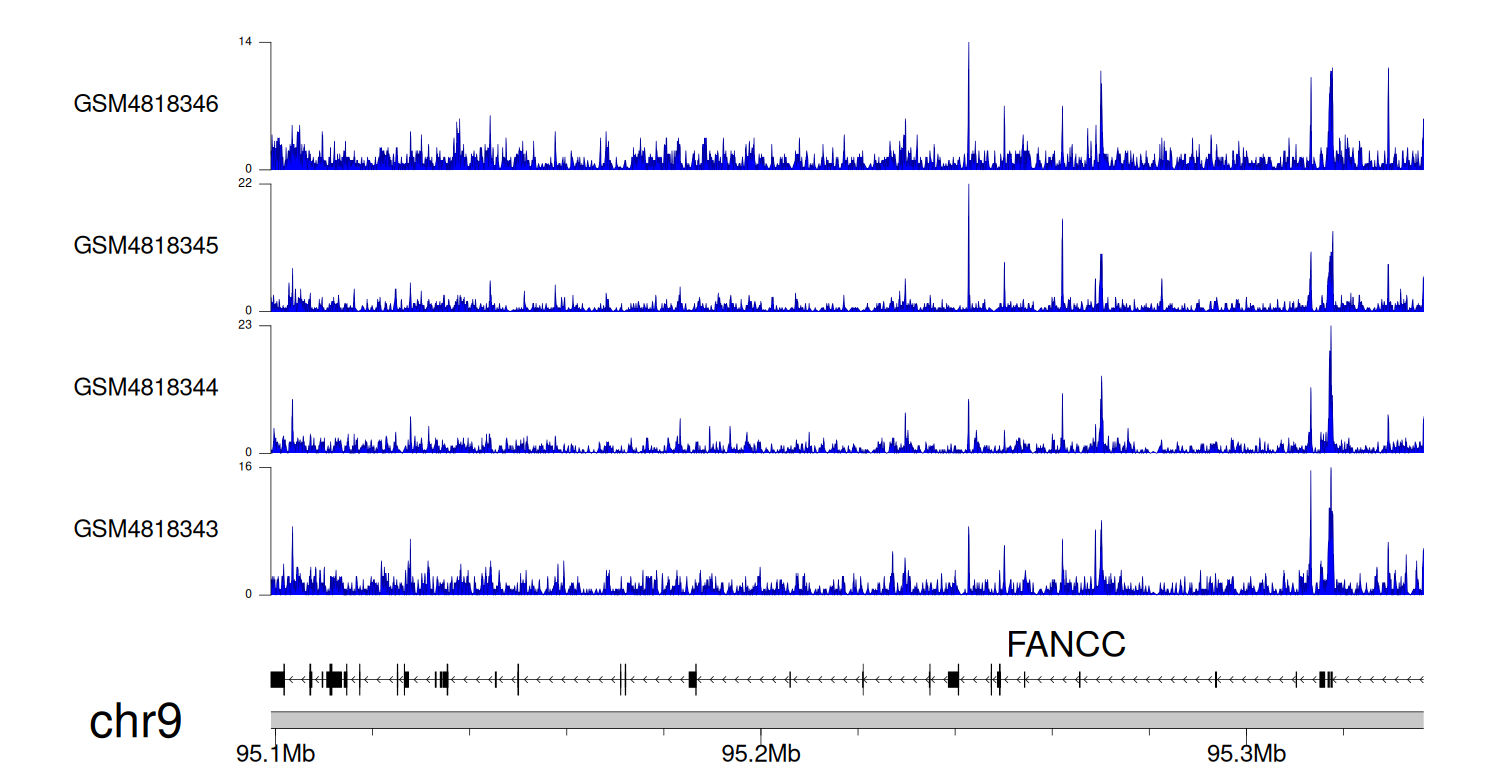
> Dataset: GSE270130 - FANCC peak across samples
|
Peak Plot
|
> Dataset: GSE131257 - FANCC peak across samples
|
Peak Plot
|
|
|
