Gene Information
|
Gene Name
|
FBXO15 |
|
Gene ID
|
201456
|
|
Gene Full Name
|
F-box protein 15 |
|
Gene Alias
|
FBX15 |
|
Transcripts
|
ENSG00000141665
|
|
Virus
|
HBV |
|
Gene Type
|
protein-coding |
|
HPA Location Info
|

|
|
Membrane Info
|
Predicted intracellular proteins |
|
Uniport_ID
|
Q8NCQ5
|
|
HGNC ID
|
HGNC:13617
|
|
OMIM ID
|
609093 |
|
Summary
|
Members of the F-box protein family, such as FBXO15, are characterized by an approximately 40-amino acid F-box motif. SCF complexes, formed by SKP1 (MIM 601434), cullin (see CUL1; MIM 603134), and F-box proteins, act as protein-ubiquitin ligases. F-box proteins interact with SKP1 through the F box, and they interact with ubiquitination targets through other protein interaction domains (Jin et al., 2004 [PubMed 15520277]).[supplied by OMIM, Mar 2008] |
Target gene [FBXO15] related to VISs 
Integration Table: if previous studies reported that target gene was altered by virus integration events, the overlap between VISs in this literature and Cistrome factors was listed in this section
Target gene [FBXO15] related to Omics data
| Data ID |
Experiment type |
Sample number |
Platform |
|
GSE236281
|
RNA-seq |
12 |
Illumina MiSeq (Homo sapiens) |
|
C GSE35465
|
Chip-seq;RNA-seq |
6 |
Illumina HiSeq 2000 (Homo sapiens) |
|
C GSE68402
|
Chip-seq |
26 |
Illumina MiSeq (Homo sapiens);Illumina HiSeq 2500 (Homo sapiens) |
|
TCGA_LIHC_HBV
|
DNA methylation sequencing;RNA-seq |
97 |
TCGA |
|
C GSE270130
|
Chip-seq |
27 |
Illumina NovaSeq 6000 (Homo sapiens) |
|
GSE224901
|
RNA-seq |
21 |
Illumina NovaSeq 6000 (Homo sapiens) |
|
GSE100400
|
Chip-seq;RNA-seq;4C_cccDNA |
31 |
Illumina NextSeq 500 (Homo sapiens);Illumina NextSeq 500 (Mus musculus) |
|
GSE173897
|
RNA-seq |
95 |
Illumina HiSeq 4000 (Homo sapiens) |
|
GSE262515
|
RNA-seq |
21 |
Illumina HiSeq 2500 (Homo sapiens);Illumina HiSeq 2500 (Mus musculus) |
|
GSE110345
|
RNA-seq |
4 |
Illumina HiSeq 2500 (Homo sapiens) |
|
C GSE131257
|
ATAC-seq;RNA-seq |
19 |
Illumina HiSeq 2500 (Homo sapiens) |
|
GSE94660
|
RNA-seq |
42 |
Illumina HiSeq 2500 (Homo sapiens) |
When the gene can detect a peak in the dataset, a peak plot will be displayed.
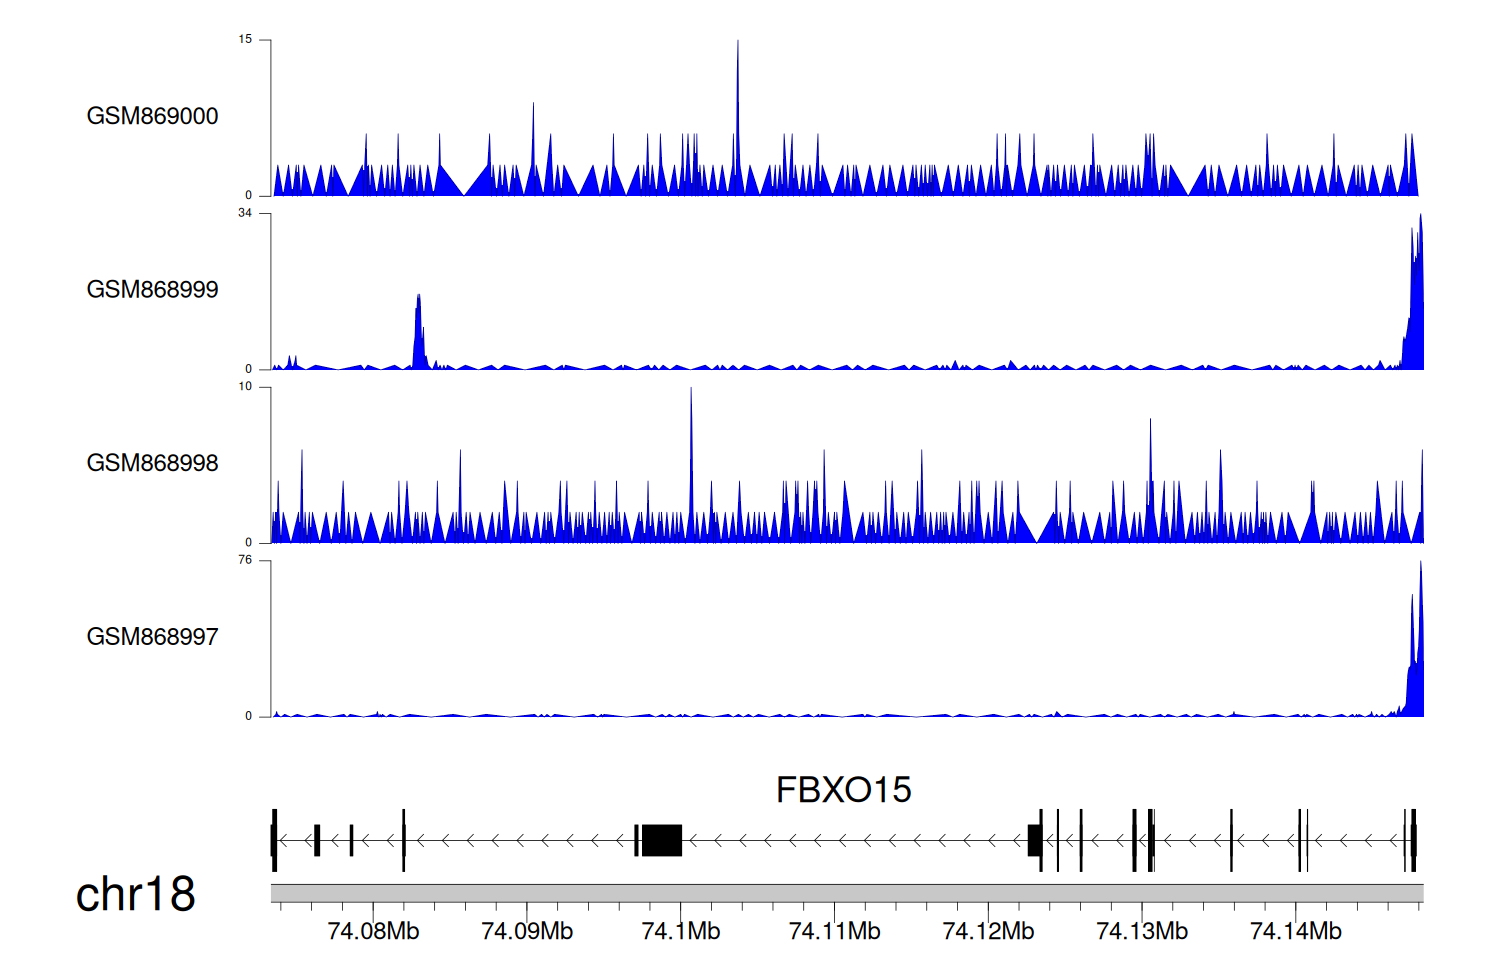
> Dataset: GSE35465 - FBXO15 peak across samples
|
Peak Plot
|
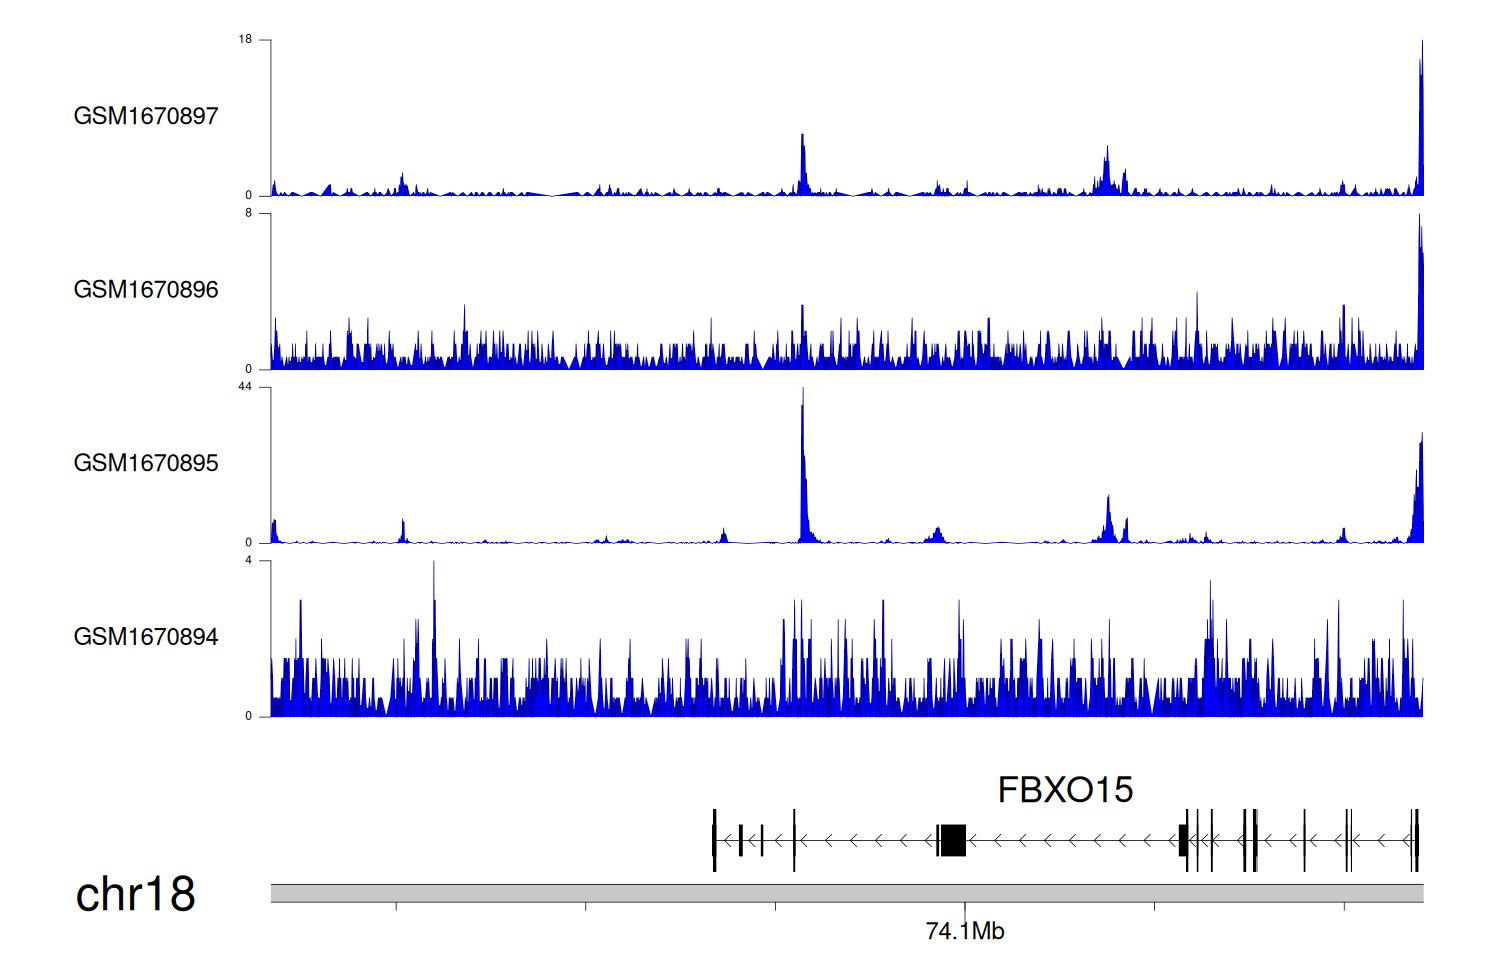
> Dataset: GSE68402 - FBXO15 peak across samples
|
Peak Plot
|
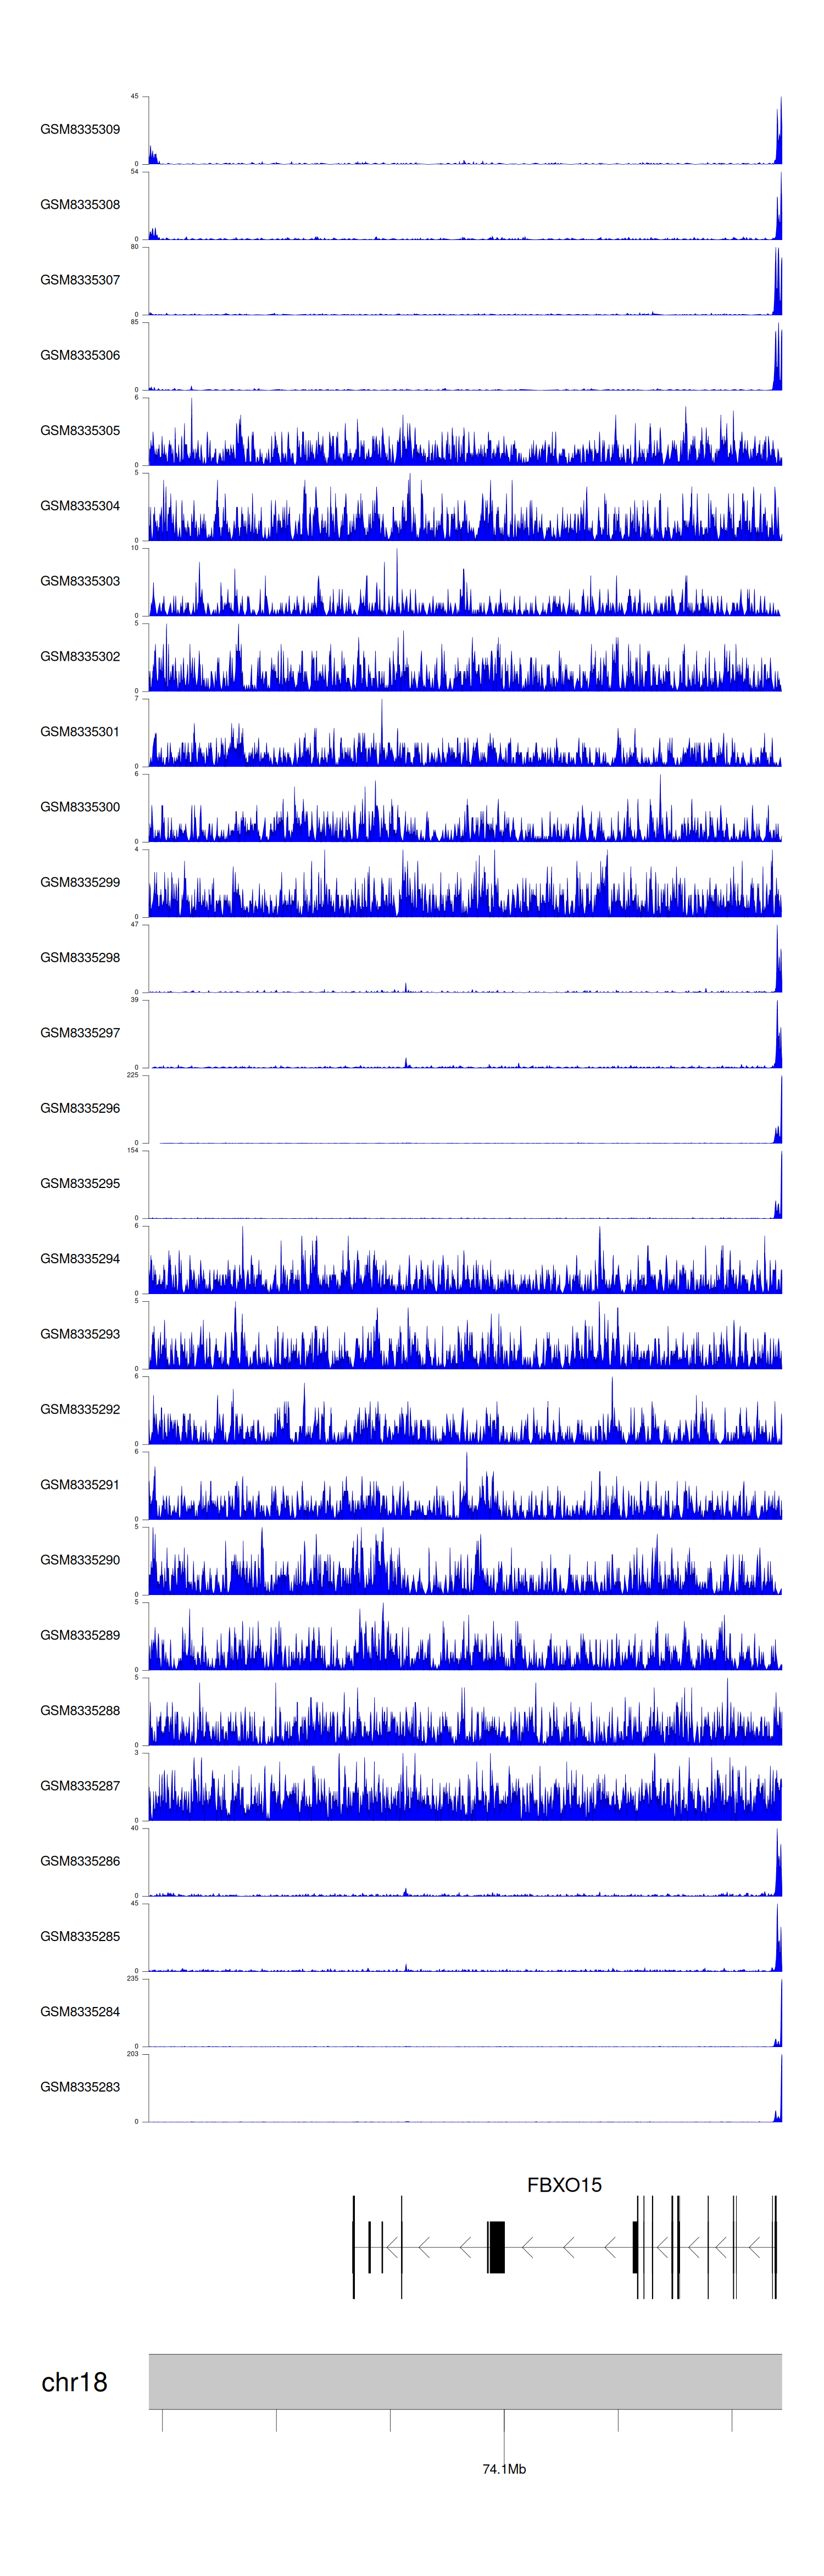
> Dataset: GSE270130 - FBXO15 peak across samples
|
Peak Plot
|
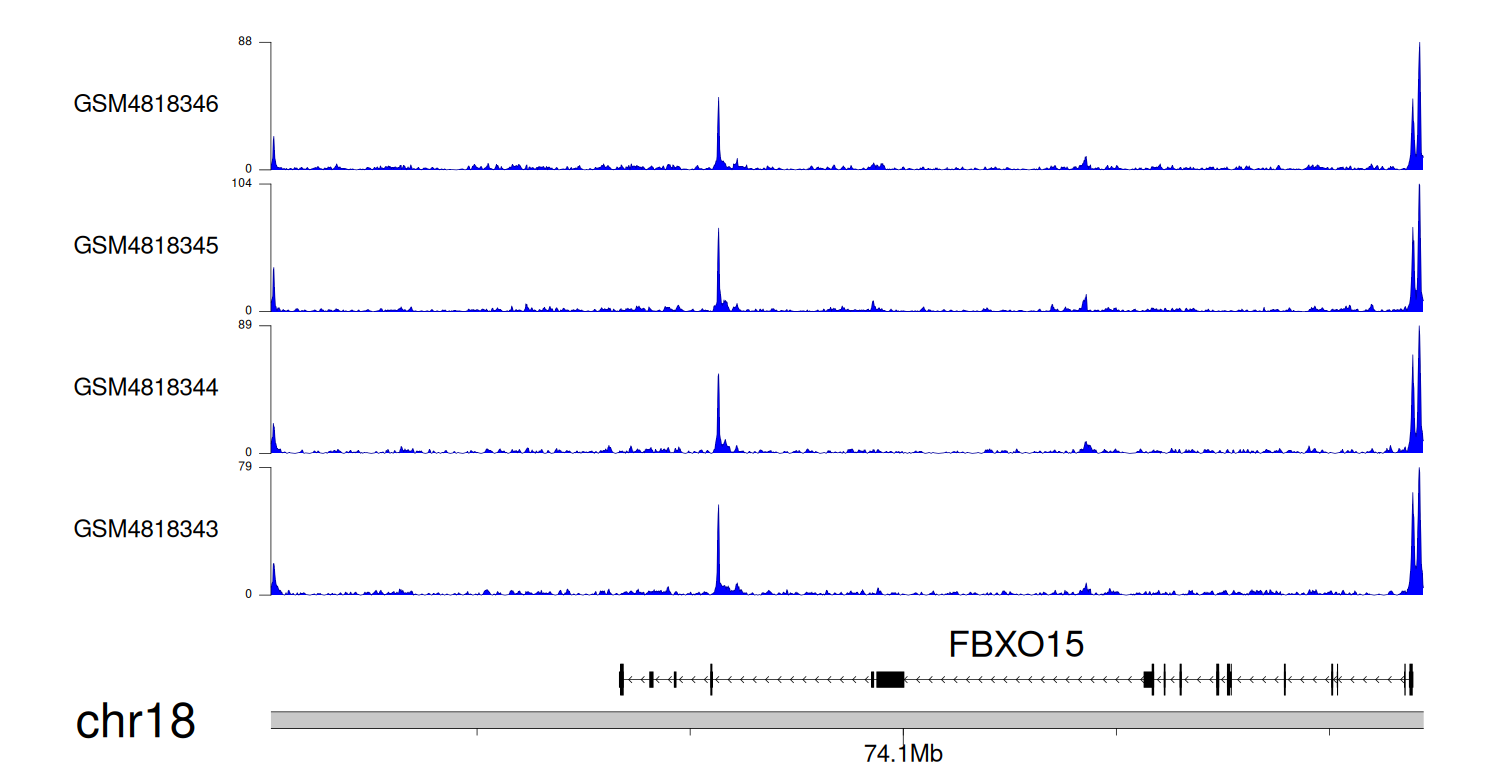
> Dataset: GSE131257 - FBXO15 peak across samples
|
Peak Plot
|
|
|
