Gene Information
|
Gene Name
|
GARS1 |
|
Gene ID
|
2617
|
|
Gene Full Name
|
glycyl-tRNA synthetase 1 |
|
Gene Alias
|
CMT2D|DSMAV|GARS|GlyRS|HMN5|HMN5A|HMND5|SMAD1|SMAJI |
|
Transcripts
|
ENSG00000106105
|
|
Virus
|
HPV |
|
Gene Type
|
protein-coding |
|
HPA Location Info
|
Cytosol;Intracellular and membrane; 
|
|
Membrane Info
|
Disease related genes, Enzymes, Human disease related genes, Metabolic proteins, Plasma proteins, Potential drug targets, Predicted intracellular proteins |
|
Uniport_ID
|
P41250
|
|
HGNC ID
|
HGNC:4162
|
|
OMIM ID
|
600287 |
|
Summary
|
This gene encodes glycyl-tRNA synthetase, one of the aminoacyl-tRNA synthetases that charge tRNAs with their cognate amino acids. The encoded enzyme is an (alpha)2 dimer which belongs to the class II family of tRNA synthetases. It has been shown to be a target of autoantibodies in the human autoimmune diseases, polymyositis or dermatomyositis. Two transcript variants encoding different isoforms have been found for this gene. [provided by RefSeq, Oct 2015] |
Target gene [GARS1] related to VISs 
Integration Table: if previous studies reported that target gene was altered by virus integration events, the overlap between VISs in this literature and Cistrome factors was listed in this section
| DVID |
Chromosome |
HM |
TFBS |
CA |
Sum of Overlapped Records |
Detail |
| 5000863 |
chr7 |
64 |
11 |
0 |
75 |
View |
| 5005298 |
chr7 |
2281 |
87 |
76 |
2444 |
View |
| 5011840 |
chr7 |
43 |
1 |
0 |
44 |
View |
Target gene [GARS1] related to Omics data
| Data ID |
Experiment type |
Sample number |
Platform |
|
C GSE183048
|
Chip-seq |
24 |
Illumina HiSeq 4000 (Homo sapiens) |
|
GSE181805
|
Expression array |
25 |
[HTA-2_0] Affymetrix Human Transcriptome Array 2.0 [transcript (gene) version] |
|
GSE140662
|
Expression array |
8 |
[HTA-2_0] Affymetrix Human Transcriptome Array 2.0 [transcript (gene) version] |
|
TCGA_CESC
|
DNA methylation sequencing;RNA-seq |
288 |
TCGA |
|
C GSE143026
|
ATAC-seq;Chip-seq;RNA-seq |
30 |
Illumina HiSeq 2500 (Homo sapiens) |
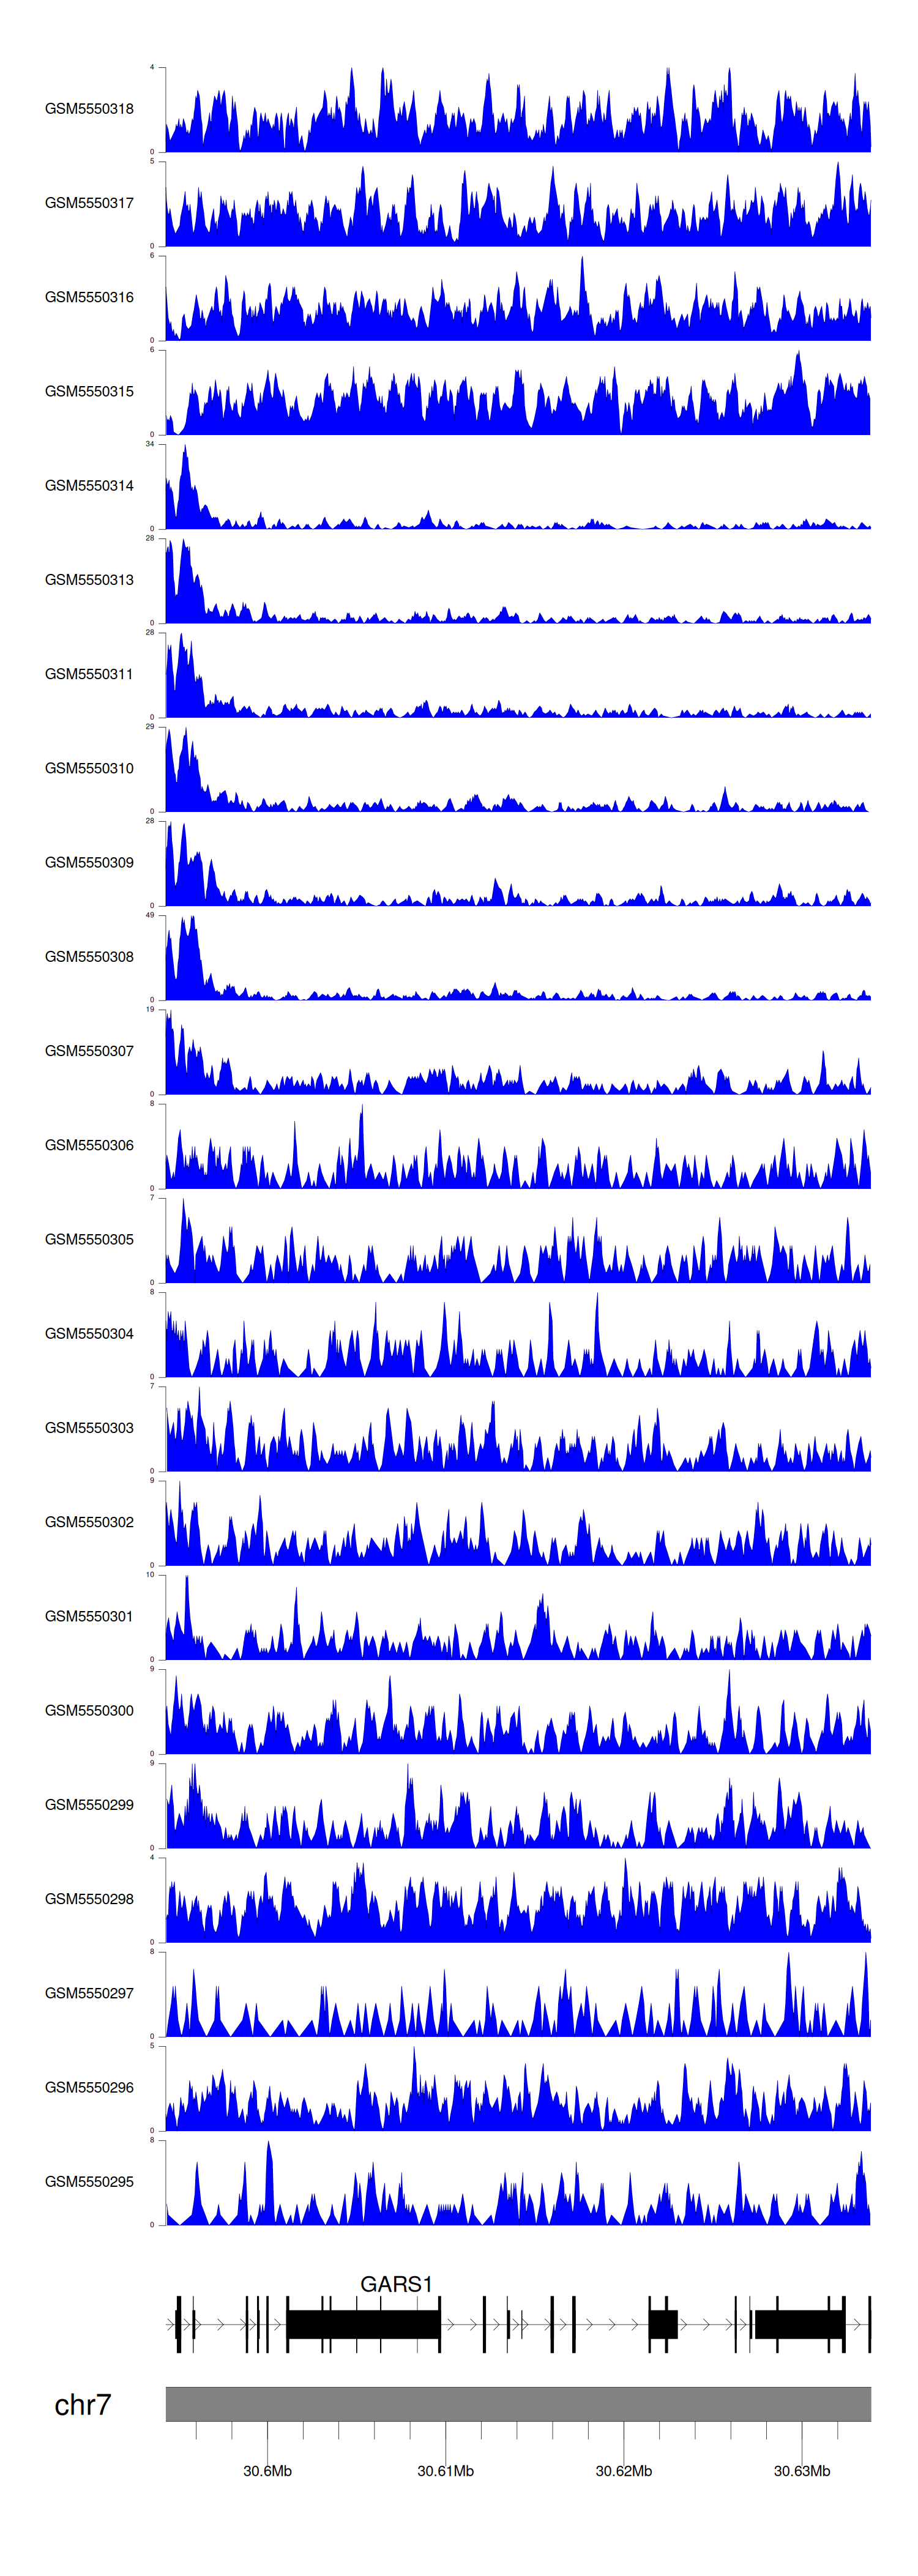
When the gene can detect a peak in the dataset, a peak plot will be displayed.
> Dataset: GSE183048 - GARS1 peak across samples
|
Peak Plot
|
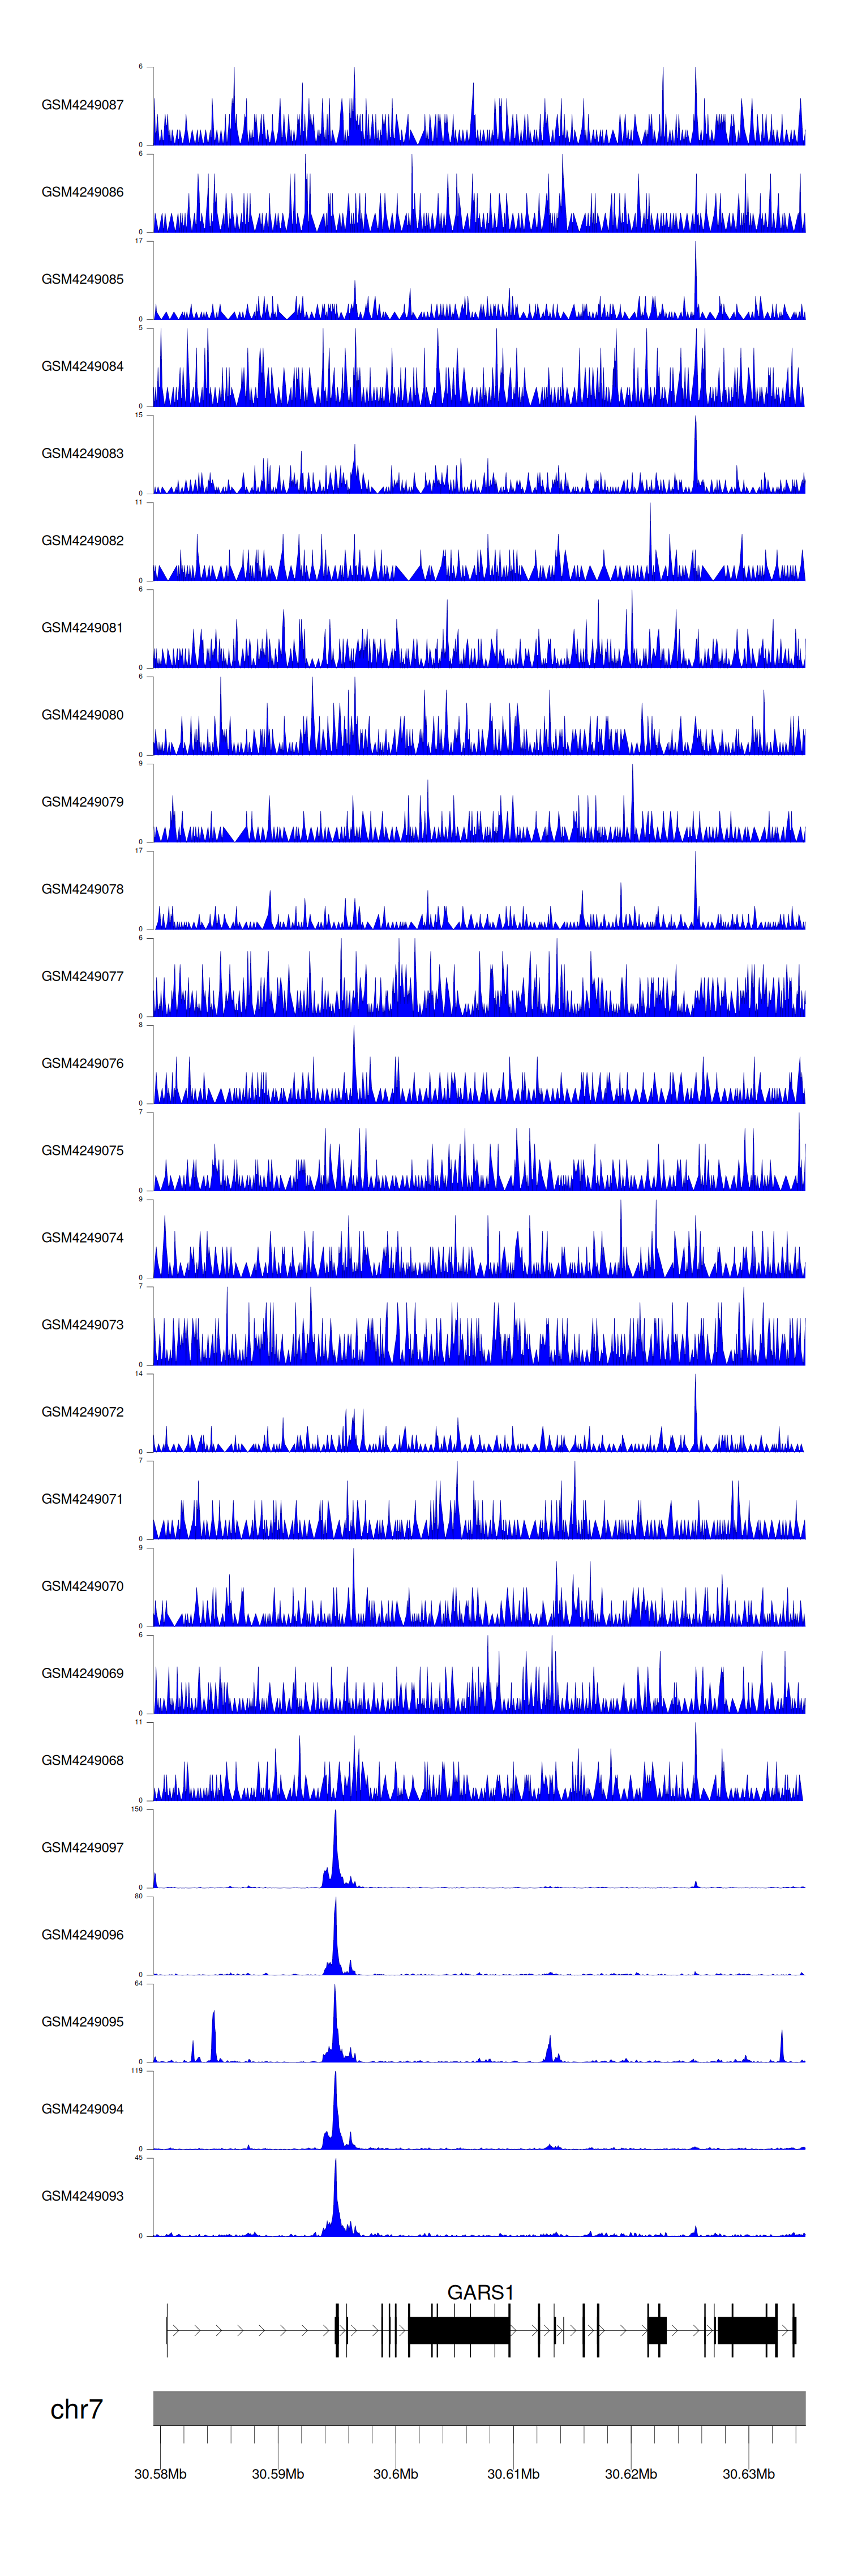
> Dataset: GSE143026 - GARS1 peak across samples
|
Peak Plot
|
|
|
