Gene Information
|
Gene Name
|
GBA1 |
|
Gene ID
|
2629
|
|
Gene Full Name
|
glucosylceramidase beta 1 |
|
Gene Alias
|
GBA|GCB|GLUC |
|
Transcripts
|
ENSG00000177628
|
|
Virus
|
HBV |
|
Gene Type
|
protein-coding |
|
HPA Location Info
|
Intracellular and membrane; 
|
|
Membrane Info
|
Disease related genes, Enzymes, Human disease related genes, Metabolic proteins, Potential drug targets, Predicted intracellular proteins |
|
Uniport_ID
|
P04062
|
|
HGNC ID
|
HGNC:4177
|
|
OMIM ID
|
606463 |
|
Summary
|
This gene encodes a lysosomal membrane protein that cleaves the beta-glucosidic linkage of glycosylceramide, an intermediate in glycolipid metabolism. Mutations in this gene cause Gaucher disease, a lysosomal storage disease characterized by an accumulation of glucocerebrosides. A related pseudogene is approximately 12 kb downstream of this gene on chromosome 1. Alternative splicing results in multiple transcript variants. [provided by RefSeq, Jan 2010] |
Target gene [GBA1] related to VISs 
Integration Table: if previous studies reported that target gene was altered by virus integration events, the overlap between VISs in this literature and Cistrome factors was listed in this section
| DVID |
Chromosome |
HM |
TFBS |
CA |
Sum of Overlapped Records |
Detail |
| 1001932 |
chr1 |
130 |
247 |
33 |
410 |
View |
Target gene [GBA1] related to Omics data
| Data ID |
Experiment type |
Sample number |
Platform |
|
C GSE35465
|
Chip-seq;RNA-seq |
6 |
Illumina HiSeq 2000 (Homo sapiens) |
|
C GSE68402
|
Chip-seq |
26 |
Illumina MiSeq (Homo sapiens);Illumina HiSeq 2500 (Homo sapiens) |
|
C GSE270130
|
Chip-seq |
27 |
Illumina NovaSeq 6000 (Homo sapiens) |
|
GSE224901
|
RNA-seq |
21 |
Illumina NovaSeq 6000 (Homo sapiens) |
|
GSE100400
|
Chip-seq;RNA-seq;4C_cccDNA |
31 |
Illumina NextSeq 500 (Homo sapiens);Illumina NextSeq 500 (Mus musculus) |
|
GSE173897
|
RNA-seq |
95 |
Illumina HiSeq 4000 (Homo sapiens) |
|
E GSE94660
|
RNA-seq |
42 |
Illumina HiSeq 2500 (Homo sapiens) |
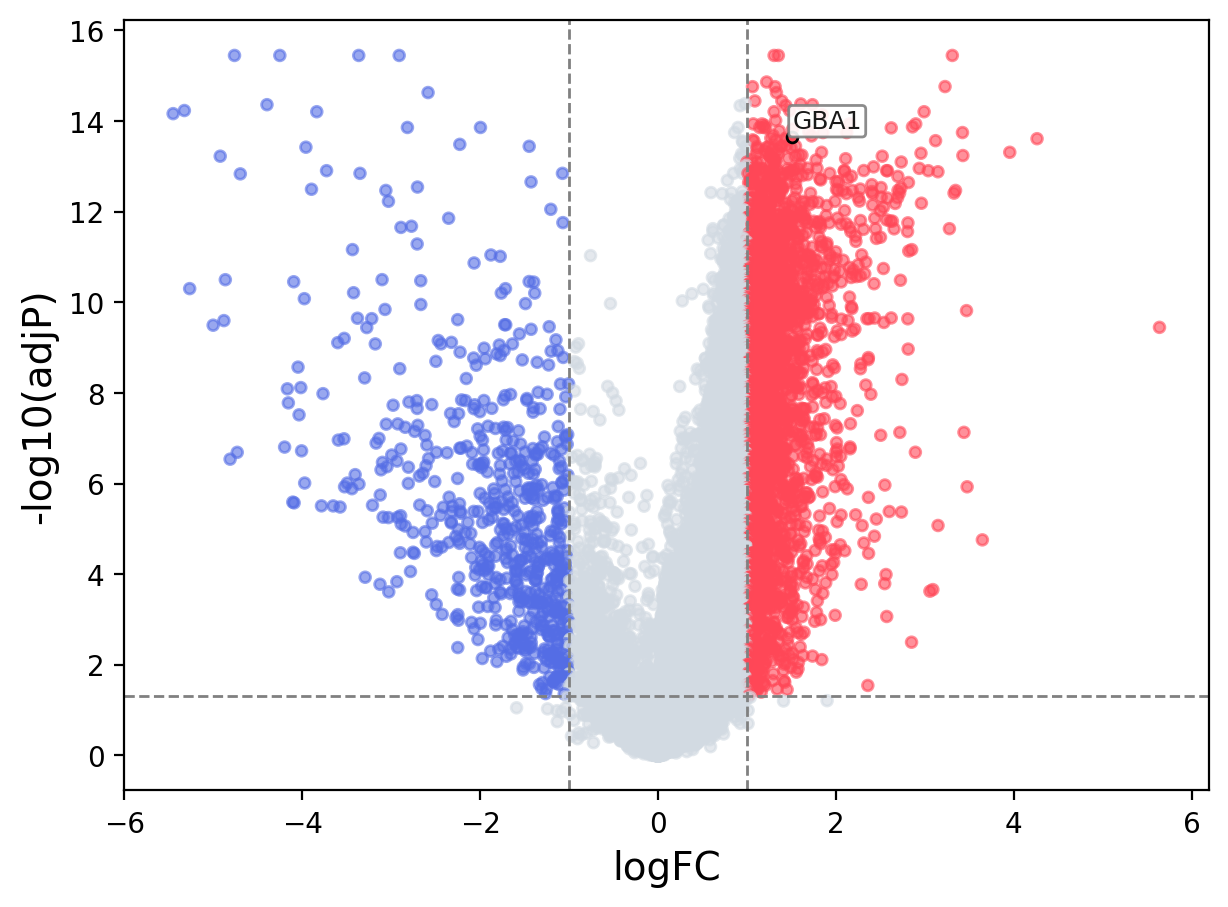
When the query gene is differentially changed in the dataset, a volcano/bar plot will be displayed.
> Dataset: GSE94660 - GBA1 expression across samples
|
Volcano Plot
|
Bar Plot
|
|
|
