Gene Information
|
Gene Name
|
GNAT1 |
|
Gene ID
|
2779
|
|
Gene Full Name
|
G protein subunit alpha transducin 1 |
|
Gene Alias
|
CSNB1G|CSNBAD3|GBT1|GNATR|HG1F |
|
Transcripts
|
ENSG00000114349
|
|
Virus
|
HBV |
|
Gene Type
|
protein-coding |
|
HPA Location Info
|
Mid piece, Principal piece, End piece; 
|
|
Membrane Info
|
Disease related genes, Human disease related genes, Predicted intracellular proteins |
|
Uniport_ID
|
P11488
|
|
HGNC ID
|
HGNC:4393
|
|
OMIM ID
|
139330 |
|
Summary
|
Transducin is a 3-subunit guanine nucleotide-binding protein (G protein) which stimulates the coupling of rhodopsin and cGMP-phoshodiesterase during visual impulses. The transducin alpha subunits in rods and cones are encoded by separate genes. This gene encodes the alpha subunit in rods. This gene is also expressed in other cells, and has been implicated in bitter taste transduction in rat taste cells. Mutations in this gene result in autosomal dominant congenital stationary night blindness. Multiple alternatively spliced variants, encoding the same protein, have been identified. [provided by RefSeq, Feb 2009] |
Target gene [GNAT1] related to VISs 
Integration Table: if previous studies reported that target gene was altered by virus integration events, the overlap between VISs in this literature and Cistrome factors was listed in this section
| DVID |
Chromosome |
HM |
TFBS |
CA |
Sum of Overlapped Records |
Detail |
| 1022303 |
chr3 |
9 |
11 |
0 |
20 |
View |
| 1022304 |
chr3 |
9 |
11 |
0 |
20 |
View |
| 1042754 |
chr3 |
16 |
18 |
0 |
34 |
View |
Target gene [GNAT1] related to Omics data
| Data ID |
Experiment type |
Sample number |
Platform |
|
GSE236281
|
RNA-seq |
12 |
Illumina MiSeq (Homo sapiens) |
|
C GSE35465
|
Chip-seq;RNA-seq |
6 |
Illumina HiSeq 2000 (Homo sapiens) |
|
C GSE68402
|
Chip-seq |
26 |
Illumina MiSeq (Homo sapiens);Illumina HiSeq 2500 (Homo sapiens) |
|
TCGA_LIHC_HBV
|
DNA methylation sequencing;RNA-seq |
97 |
TCGA |
|
C GSE270130
|
Chip-seq |
27 |
Illumina NovaSeq 6000 (Homo sapiens) |
|
GSE224901
|
RNA-seq |
21 |
Illumina NovaSeq 6000 (Homo sapiens) |
|
GSE100400
|
Chip-seq;RNA-seq;4C_cccDNA |
31 |
Illumina NextSeq 500 (Homo sapiens);Illumina NextSeq 500 (Mus musculus) |
|
GSE173897
|
RNA-seq |
95 |
Illumina HiSeq 4000 (Homo sapiens) |
|
GSE262515
|
RNA-seq |
21 |
Illumina HiSeq 2500 (Homo sapiens);Illumina HiSeq 2500 (Mus musculus) |
|
GSE110345
|
RNA-seq |
4 |
Illumina HiSeq 2500 (Homo sapiens) |
|
C GSE131257
|
ATAC-seq;RNA-seq |
19 |
Illumina HiSeq 2500 (Homo sapiens) |
|
GSE94660
|
RNA-seq |
42 |
Illumina HiSeq 2500 (Homo sapiens) |
When the gene can detect a peak in the dataset, a peak plot will be displayed.
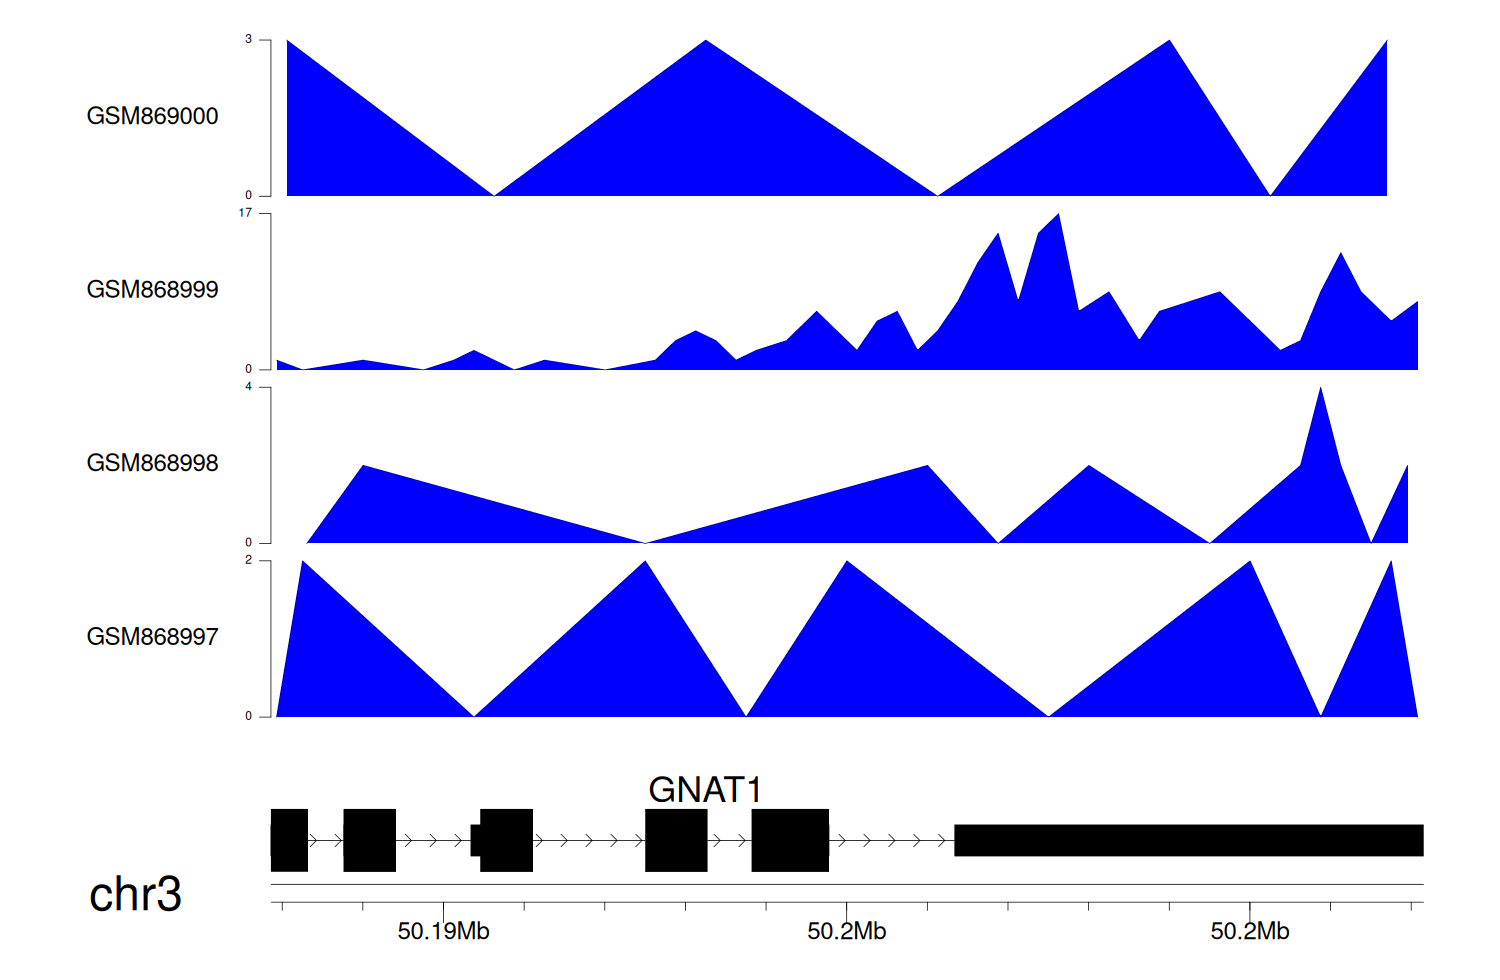
> Dataset: GSE35465 - GNAT1 peak across samples
|
Peak Plot
|
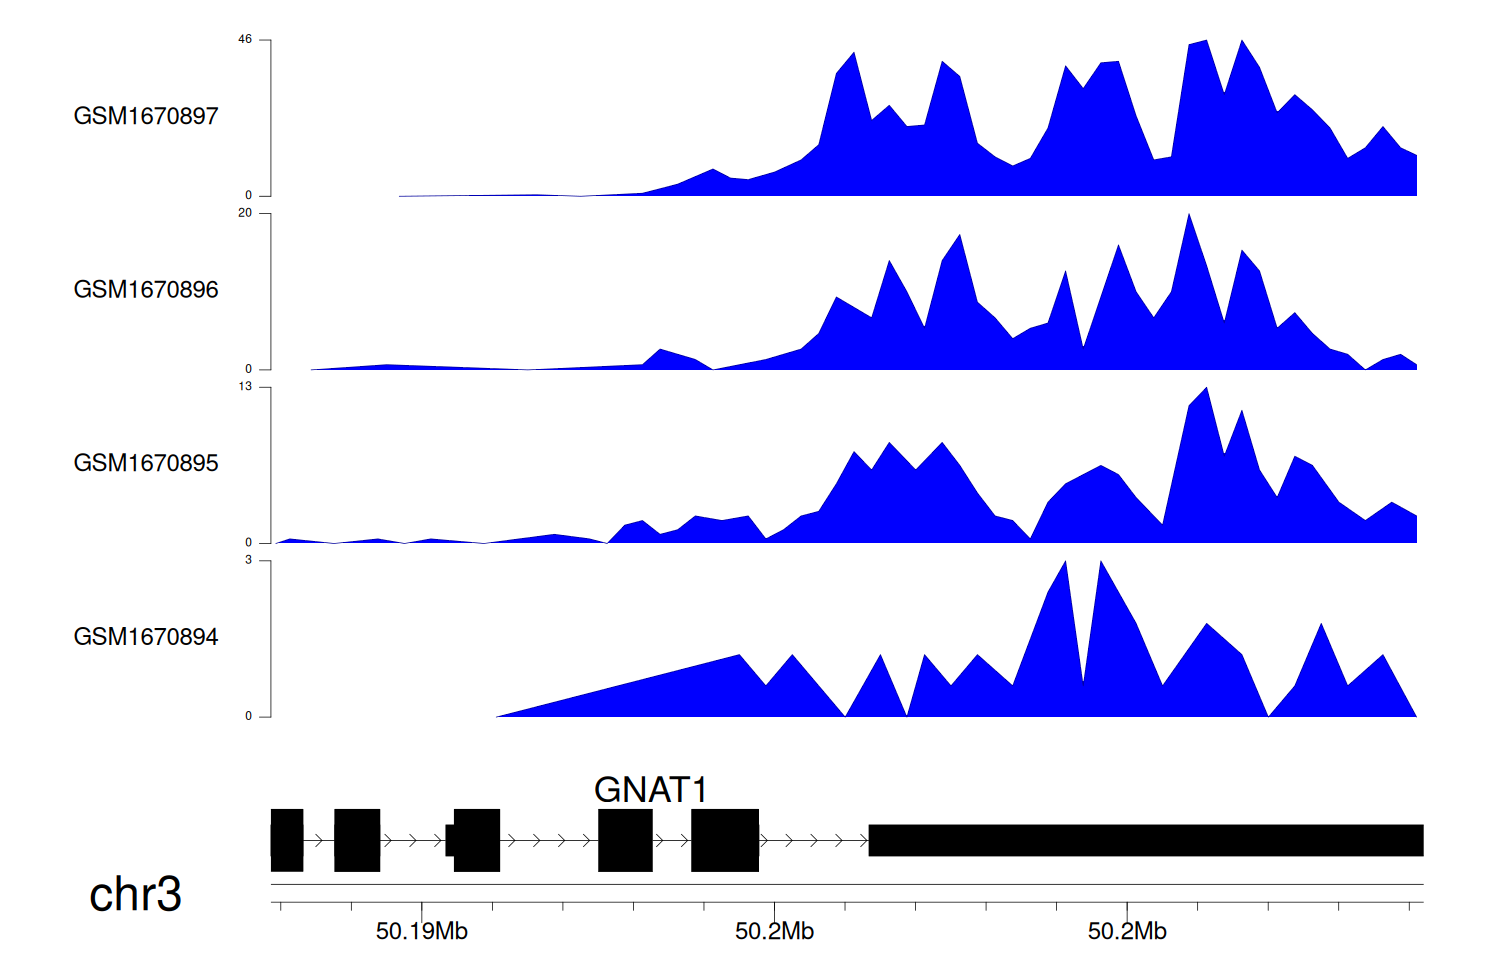
> Dataset: GSE68402 - GNAT1 peak across samples
|
Peak Plot
|
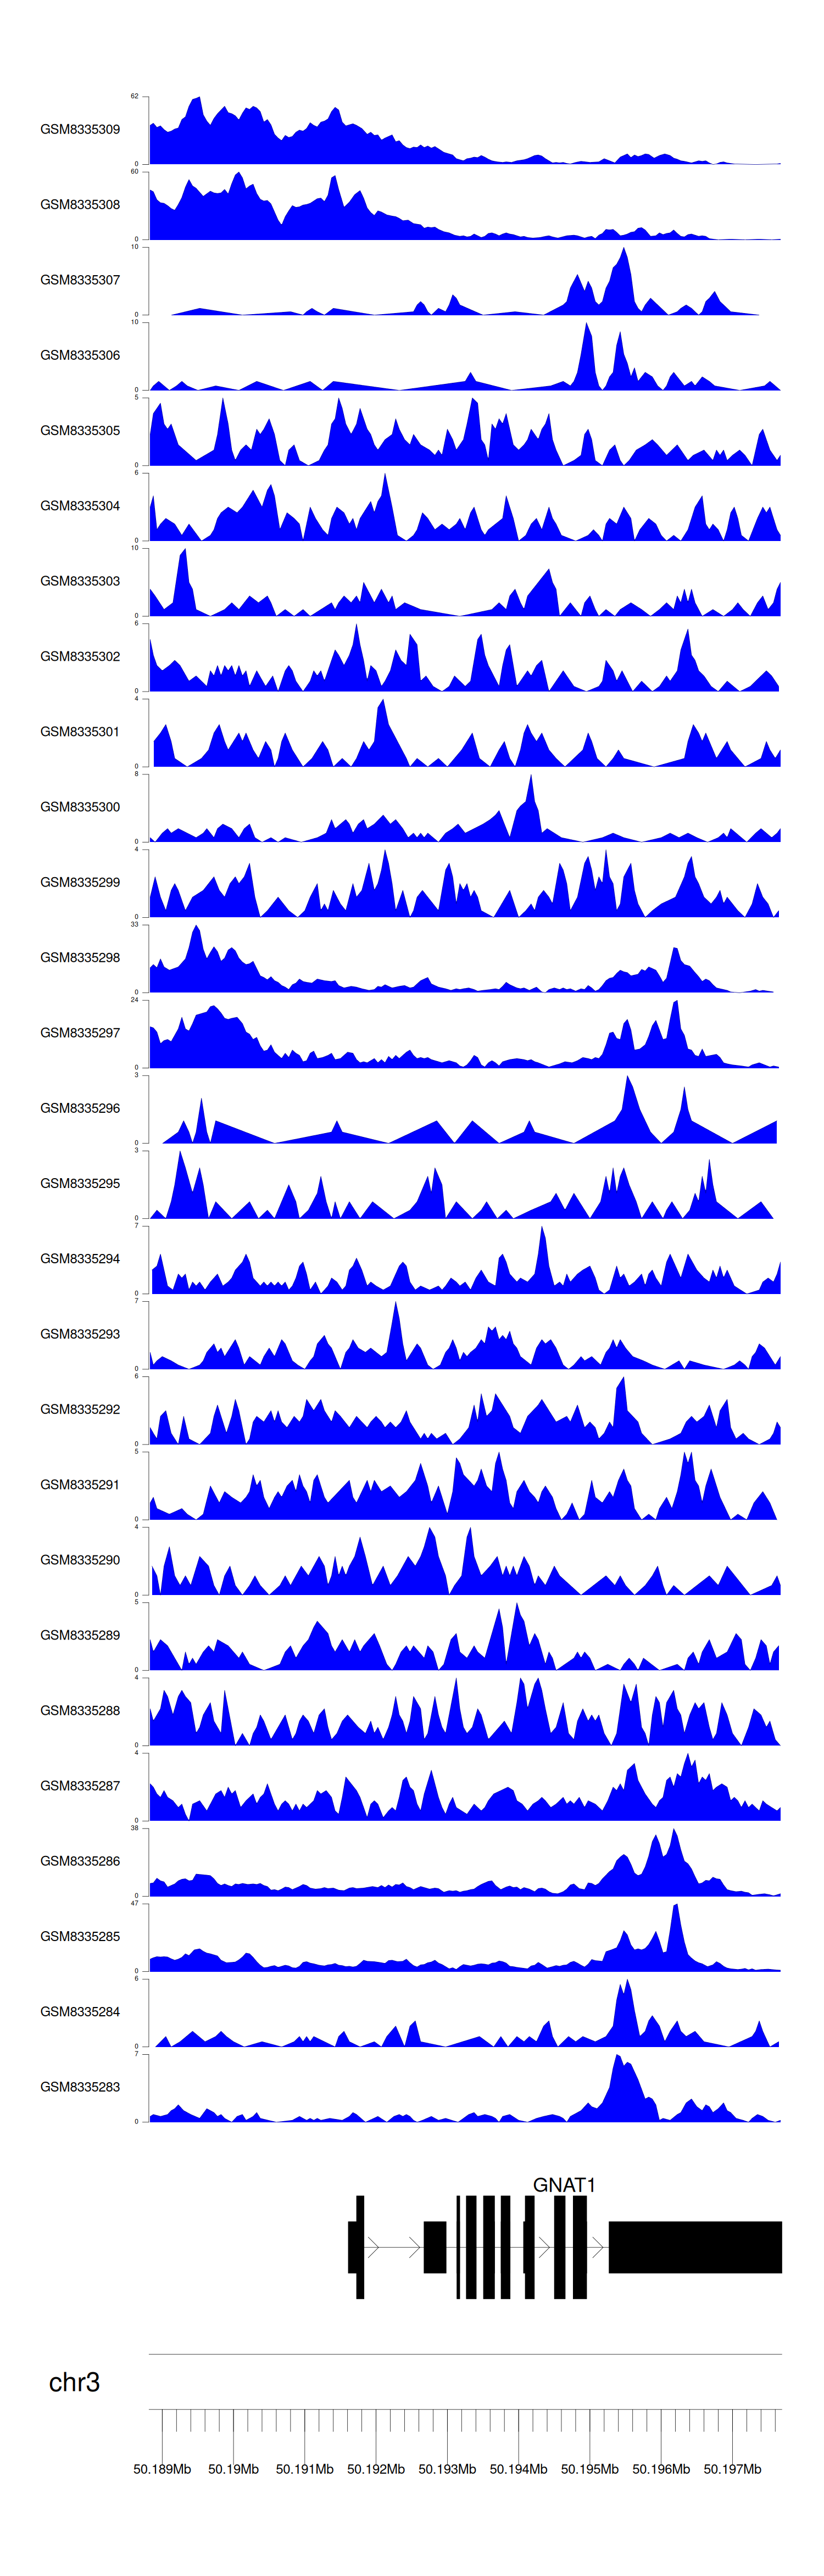
> Dataset: GSE270130 - GNAT1 peak across samples
|
Peak Plot
|
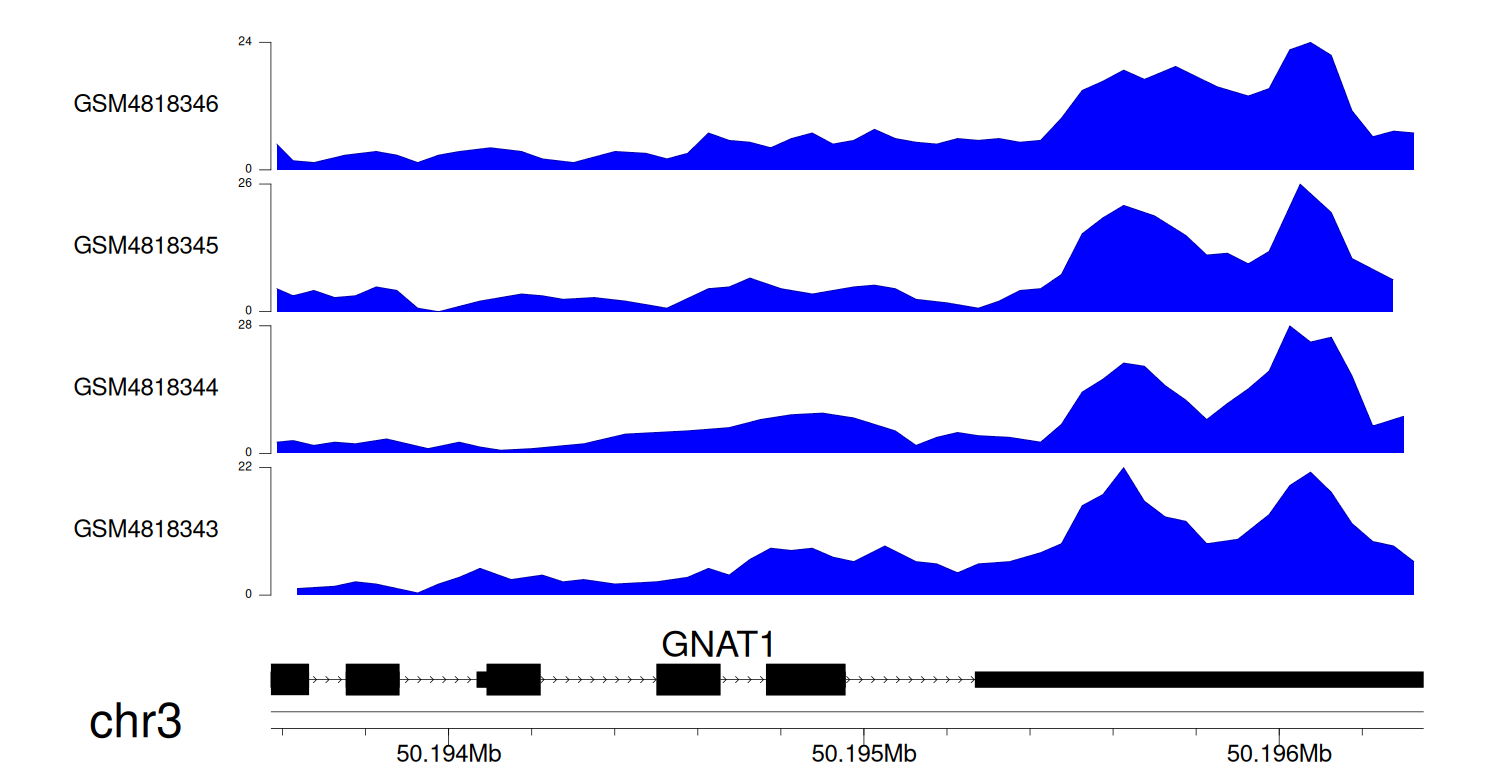
> Dataset: GSE131257 - GNAT1 peak across samples
|
Peak Plot
|
|
|
