Gene Information
|
Gene Name
|
GOLGA5 |
|
Gene ID
|
9950
|
|
Gene Full Name
|
golgin A5 |
|
Gene Alias
|
GOLIM5|RFG5|ret-II |
|
Transcripts
|
ENSG00000066455
|
|
Virus
|
HBV |
|
Gene Type
|
protein-coding |
|
HPA Location Info
|
Golgi apparatus; 
|
|
Membrane Info
|
Cancer-related genes, Disease related genes, Potential drug targets, Predicted intracellular proteins, Predicted membrane proteins, Transporters |
|
Uniport_ID
|
Q8TBA6
|
|
HGNC ID
|
HGNC:4428
|
|
OMIM ID
|
606918 |
|
Summary
|
The Golgi apparatus, which participates in glycosylation and transport of proteins and lipids in the secretory pathway, consists of a series of stacked cisternae (flattened membrane sacs). Interactions between the Golgi and microtubules are thought to be important for the reorganization of the Golgi after it fragments during mitosis. This gene encodes one of the golgins, a family of proteins localized to the Golgi. This protein is a coiled-coil membrane protein that has been postulated to play a role in vesicle tethering and docking. Translocations involving this gene and the ret proto-oncogene have been found in tumor tissues; the chimeric sequences have been designated RET-II and PTC5. A pseudogene of this gene is located on the short arm of chromosome 5. [provided by RefSeq, Jul 2013] |
Target gene [GOLGA5] related to VISs 
Integration Table: if previous studies reported that target gene was altered by virus integration events, the overlap between VISs in this literature and Cistrome factors was listed in this section
| DVID |
Chromosome |
HM |
TFBS |
CA |
Sum of Overlapped Records |
Detail |
| 1024771 |
chr14 |
29 |
0 |
0 |
29 |
View |
| 1039406 |
chr14 |
12 |
0 |
0 |
12 |
View |
| 1039407 |
chr14 |
24 |
7 |
0 |
31 |
View |
| 1039408 |
chr14 |
24 |
7 |
0 |
31 |
View |
| 1039409 |
chr14 |
25 |
7 |
0 |
32 |
View |
| 1039410 |
chr14 |
25 |
7 |
0 |
32 |
View |
| 1039411 |
chr14 |
25 |
7 |
0 |
32 |
View |
| 1039412 |
chr14 |
25 |
7 |
0 |
32 |
View |
Target gene [GOLGA5] related to Omics data
| Data ID |
Experiment type |
Sample number |
Platform |
|
GSE236281
|
RNA-seq |
12 |
Illumina MiSeq (Homo sapiens) |
|
C GSE35465
|
Chip-seq;RNA-seq |
6 |
Illumina HiSeq 2000 (Homo sapiens) |
|
C GSE68402
|
Chip-seq |
26 |
Illumina MiSeq (Homo sapiens);Illumina HiSeq 2500 (Homo sapiens) |
|
TCGA_LIHC_HBV
|
DNA methylation sequencing;RNA-seq |
97 |
TCGA |
|
C GSE270130
|
Chip-seq |
27 |
Illumina NovaSeq 6000 (Homo sapiens) |
|
GSE224901
|
RNA-seq |
21 |
Illumina NovaSeq 6000 (Homo sapiens) |
|
GSE100400
|
Chip-seq;RNA-seq;4C_cccDNA |
31 |
Illumina NextSeq 500 (Homo sapiens);Illumina NextSeq 500 (Mus musculus) |
|
GSE173897
|
RNA-seq |
95 |
Illumina HiSeq 4000 (Homo sapiens) |
|
GSE262515
|
RNA-seq |
21 |
Illumina HiSeq 2500 (Homo sapiens);Illumina HiSeq 2500 (Mus musculus) |
|
GSE110345
|
RNA-seq |
4 |
Illumina HiSeq 2500 (Homo sapiens) |
|
C GSE131257
|
ATAC-seq;RNA-seq |
19 |
Illumina HiSeq 2500 (Homo sapiens) |
|
GSE94660
|
RNA-seq |
42 |
Illumina HiSeq 2500 (Homo sapiens) |
When the gene can detect a peak in the dataset, a peak plot will be displayed.
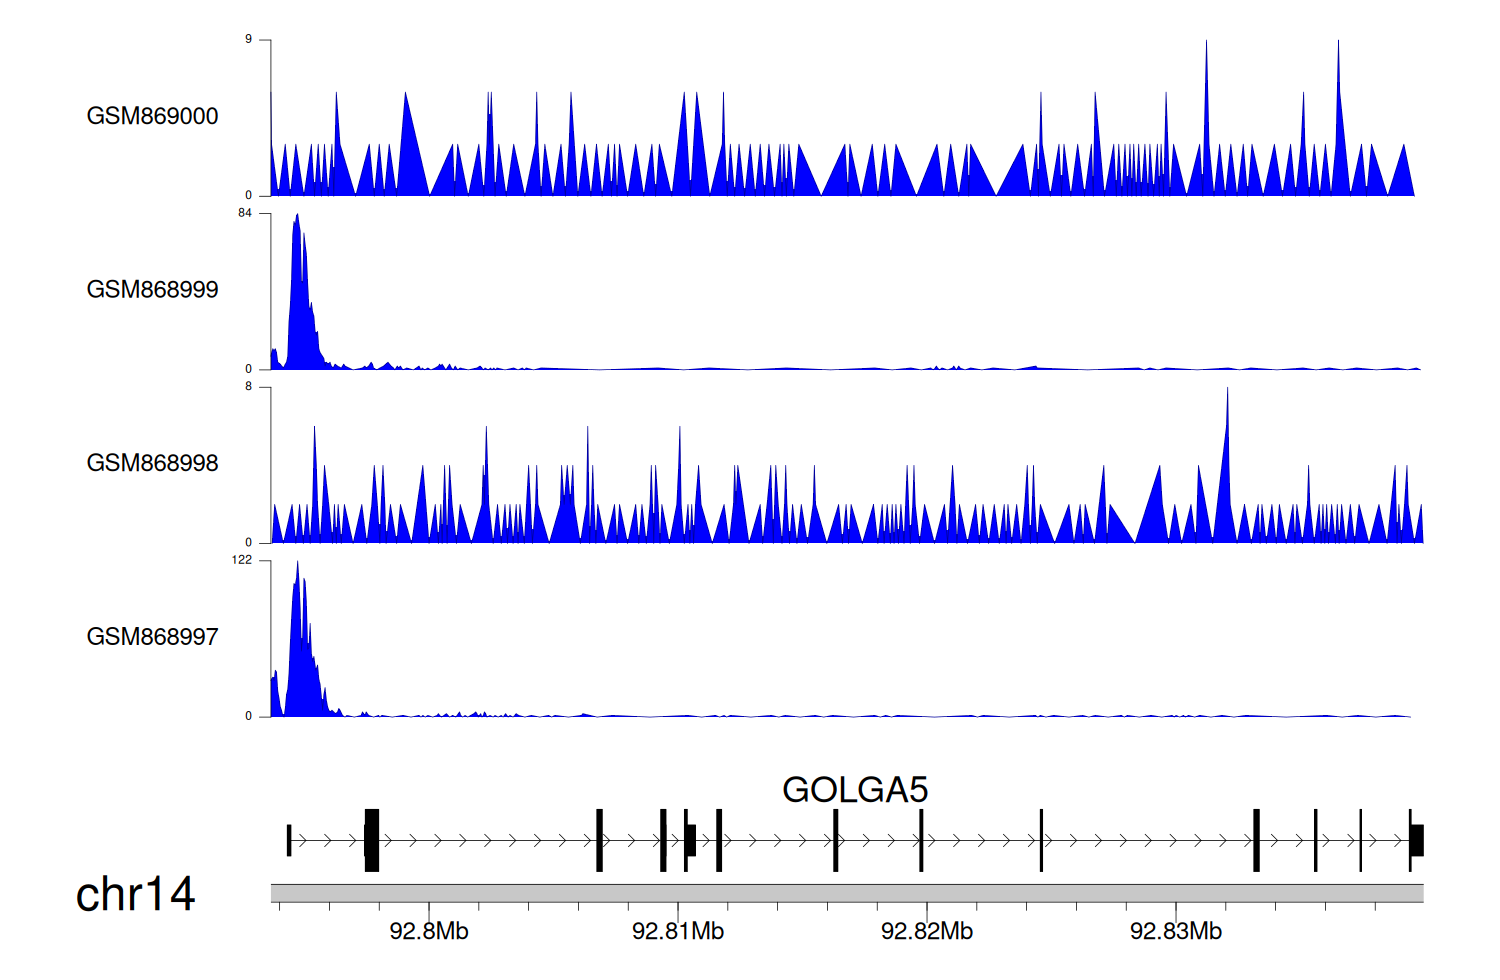
> Dataset: GSE35465 - GOLGA5 peak across samples
|
Peak Plot
|
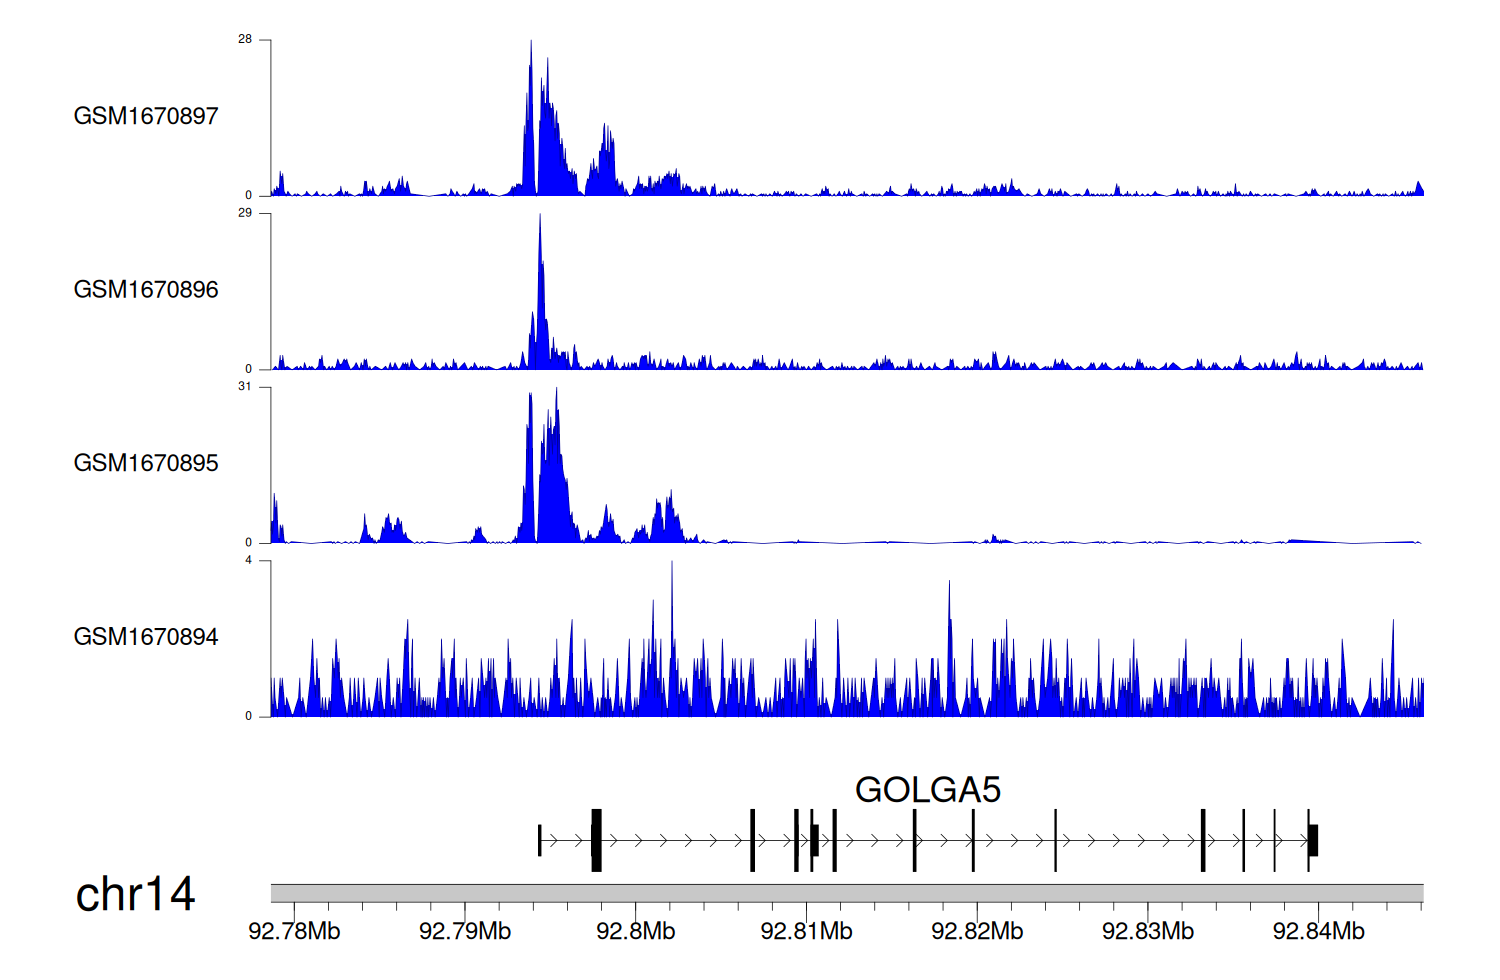
> Dataset: GSE68402 - GOLGA5 peak across samples
|
Peak Plot
|
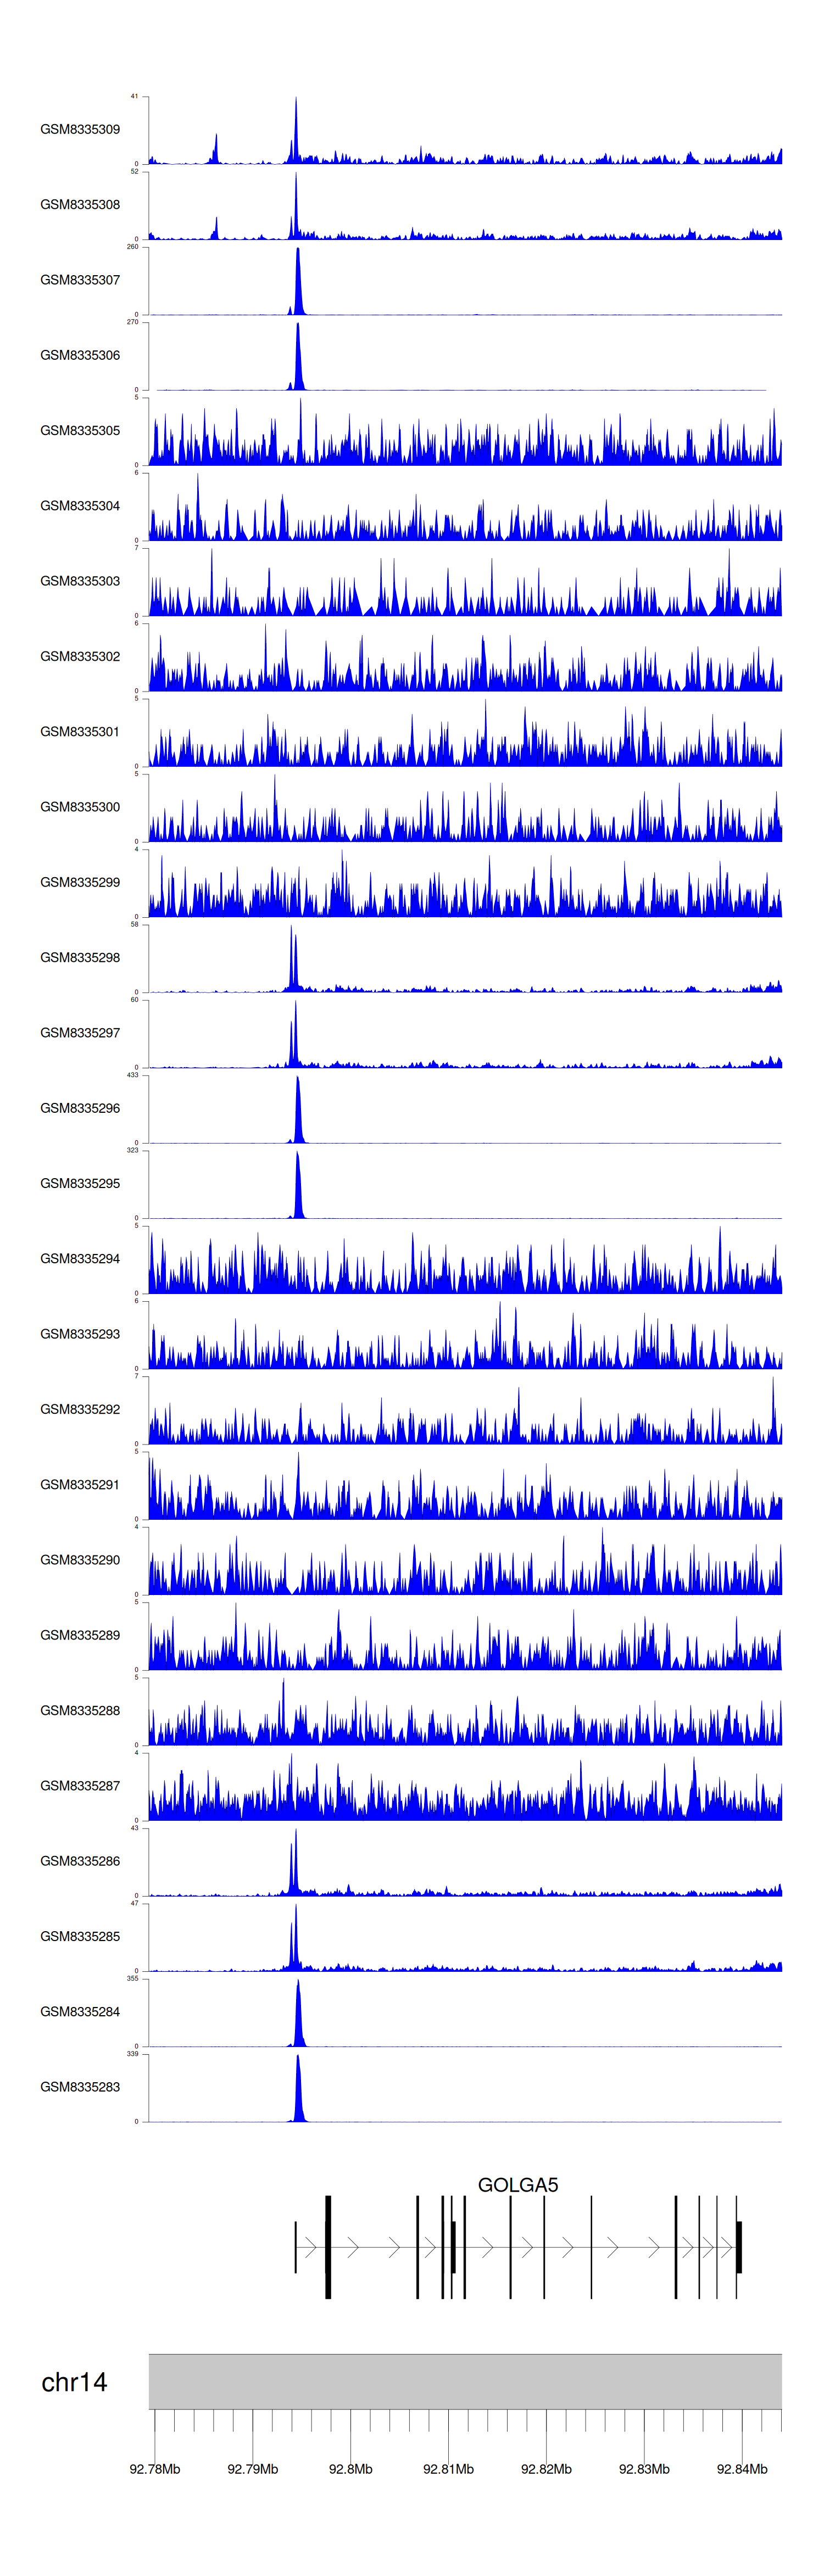
> Dataset: GSE270130 - GOLGA5 peak across samples
|
Peak Plot
|
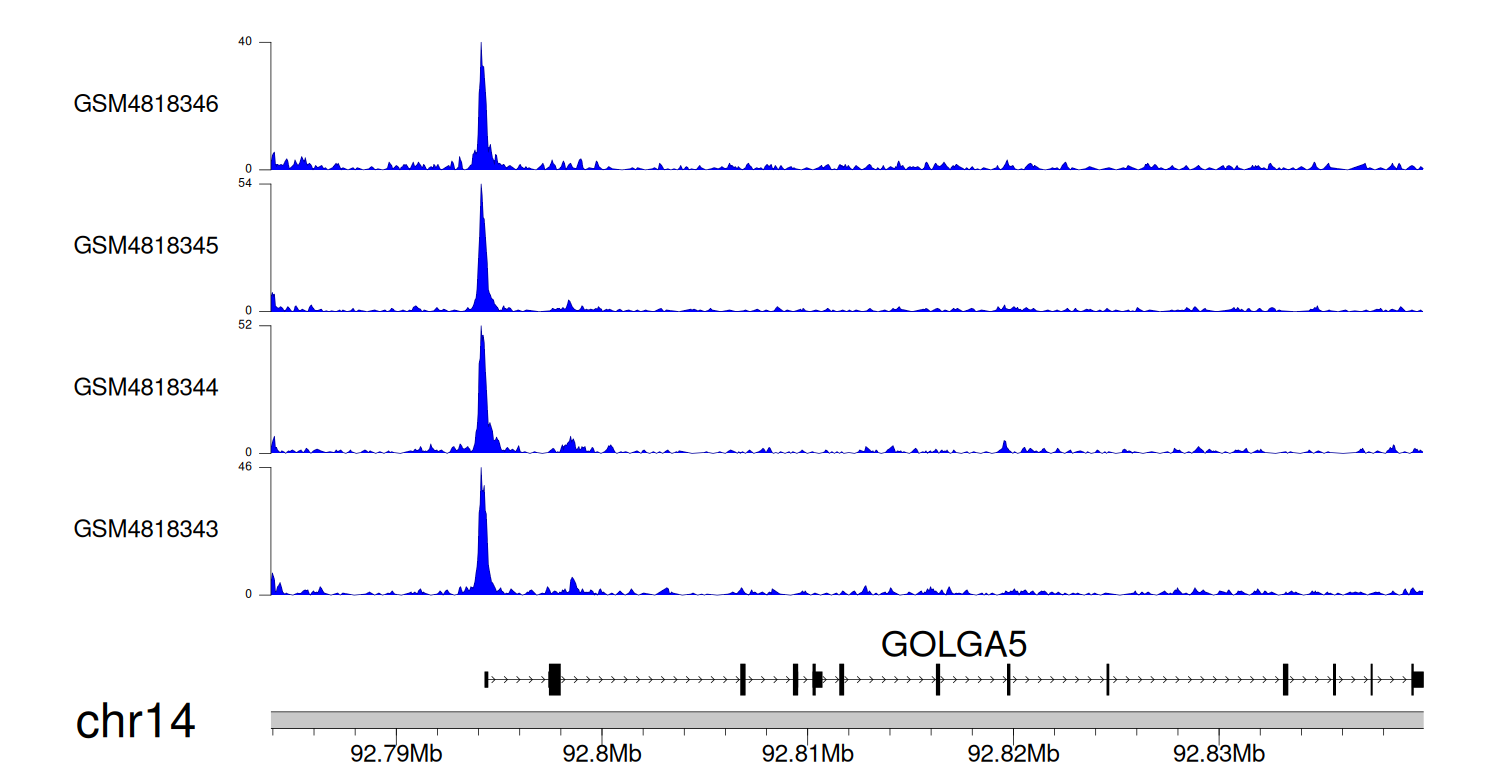
> Dataset: GSE131257 - GOLGA5 peak across samples
|
Peak Plot
|
|
|
