Gene Information
|
Gene Name
|
GPR27 |
|
Gene ID
|
2850
|
|
Gene Full Name
|
G protein-coupled receptor 27 |
|
Gene Alias
|
SREB1 |
|
Transcripts
|
ENSG00000170837
|
|
Virus
|
HBV |
|
Gene Type
|
protein-coding |
|
HPA Location Info
|
Nucleoplasm;Plasma membrane, Actin filaments, Cytosol; 
|
|
Membrane Info
|
G-protein coupled receptors, Predicted membrane proteins |
|
Uniport_ID
|
Q9NS67
|
|
HGNC ID
|
HGNC:4482
|
|
OMIM ID
|
605187 |
|
Summary
|
GPR27 is a member of the G protein-coupled receptors (GPCRs), a large family of receptors that have a similar structure characterized by 7 transmembrane domains. Activation of GPCRs by extracellular stimuli such as neurotransmitters, hormones, or light induces an intracellular signaling cascade mediated by heterotrimeric GTP-binding proteins, or G proteins.[supplied by OMIM, May 2010] |
Target gene [GPR27] related to VISs 
Integration Table: if previous studies reported that target gene was altered by virus integration events, the overlap between VISs in this literature and Cistrome factors was listed in this section
| DVID |
Chromosome |
HM |
TFBS |
CA |
Sum of Overlapped Records |
Detail |
| 1003040 |
chr3 |
157 |
12 |
2 |
171 |
View |
Target gene [GPR27] related to Omics data
| Data ID |
Experiment type |
Sample number |
Platform |
|
GSE236281
|
RNA-seq |
12 |
Illumina MiSeq (Homo sapiens) |
|
TCGA_LIHC_HBV
|
DNA methylation sequencing;RNA-seq |
97 |
TCGA |
|
C GSE270130
|
Chip-seq |
27 |
Illumina NovaSeq 6000 (Homo sapiens) |
|
GSE224901
|
RNA-seq |
21 |
Illumina NovaSeq 6000 (Homo sapiens) |
|
GSE100400
|
Chip-seq;RNA-seq;4C_cccDNA |
31 |
Illumina NextSeq 500 (Homo sapiens);Illumina NextSeq 500 (Mus musculus) |
|
GSE173897
|
RNA-seq |
95 |
Illumina HiSeq 4000 (Homo sapiens) |
|
GSE262515
|
RNA-seq |
21 |
Illumina HiSeq 2500 (Homo sapiens);Illumina HiSeq 2500 (Mus musculus) |
|
GSE110345
|
RNA-seq |
4 |
Illumina HiSeq 2500 (Homo sapiens) |
|
GSE131257
|
ATAC-seq;RNA-seq |
19 |
Illumina HiSeq 2500 (Homo sapiens) |
|
GSE94660
|
RNA-seq |
42 |
Illumina HiSeq 2500 (Homo sapiens) |
When the gene can detect a peak in the dataset, a peak plot will be displayed.
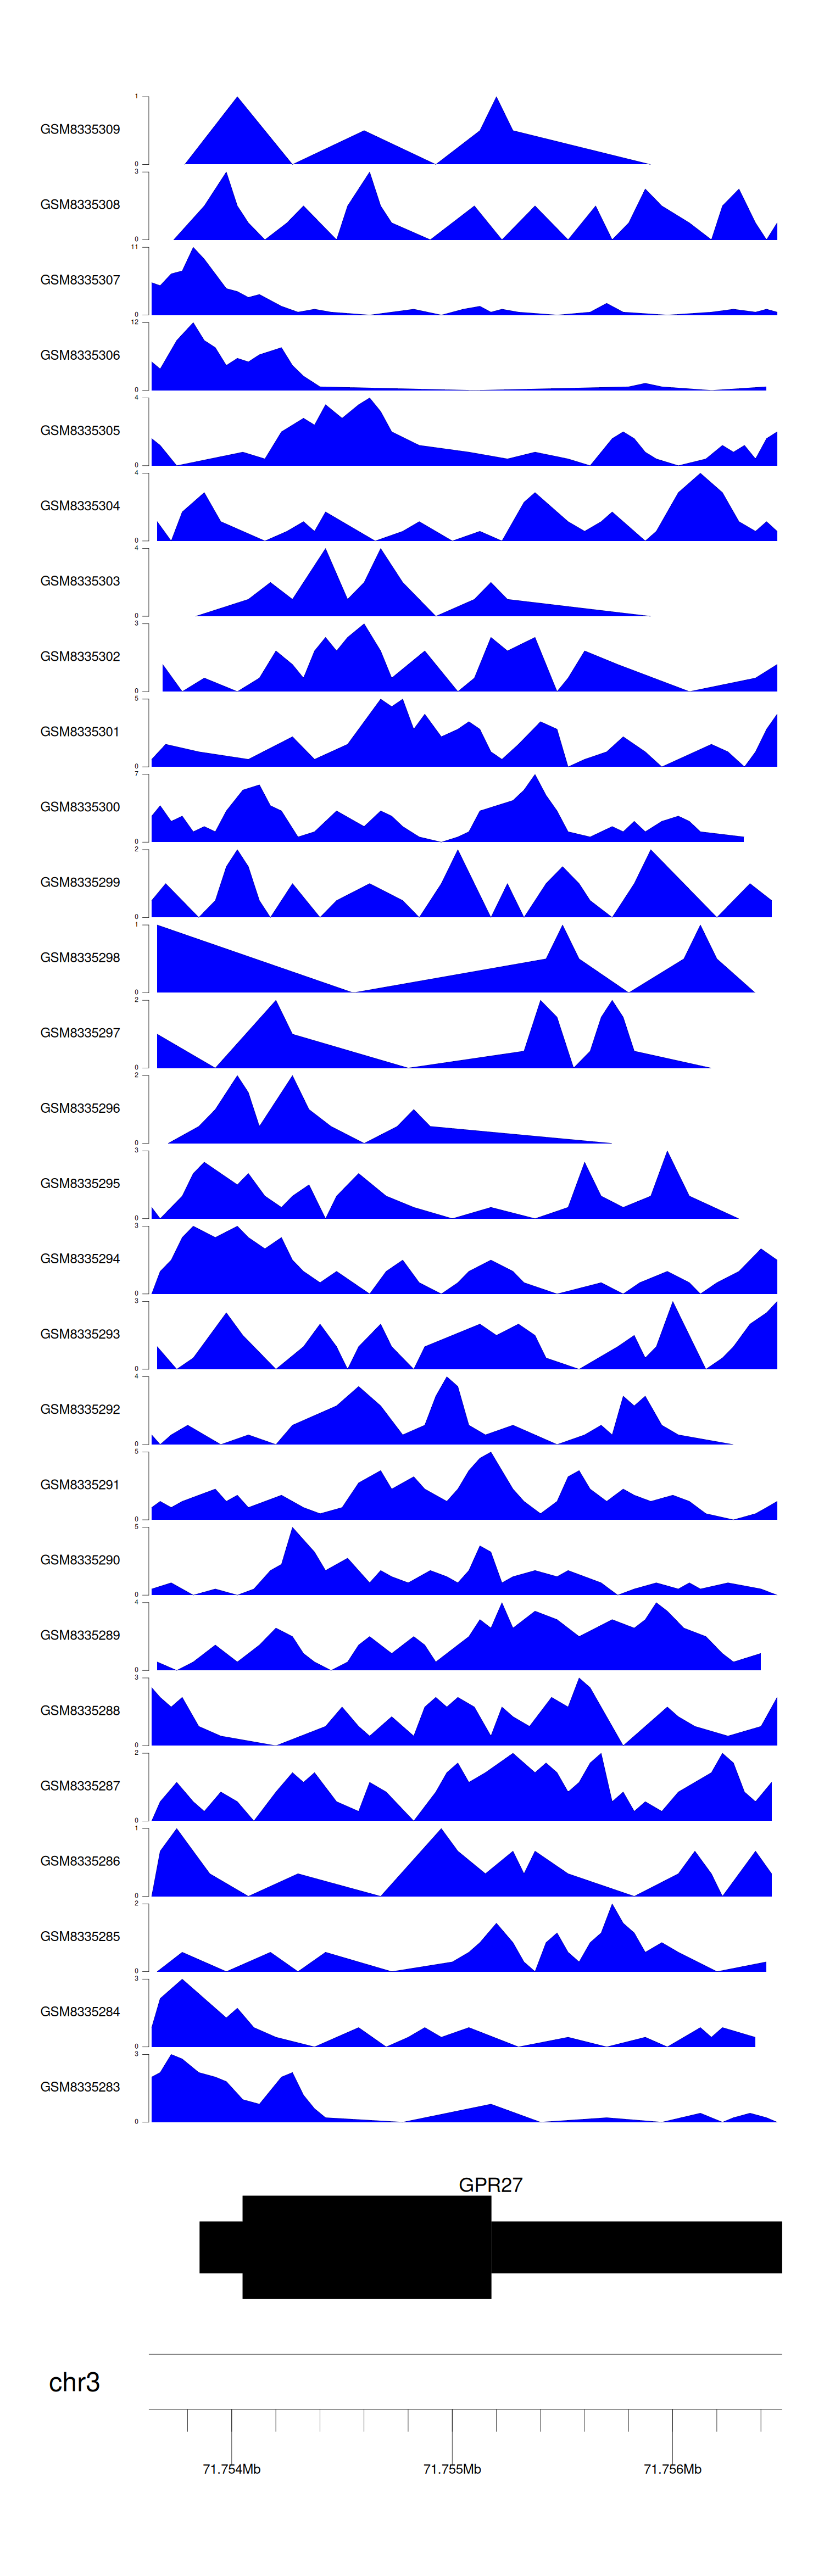
> Dataset: GSE270130 - GPR27 peak across samples
|
Peak Plot
|
|
|
