Gene Information
|
Gene Name
|
H3C3 |
|
Gene ID
|
8352
|
|
Gene Full Name
|
H3 clustered histone 3 |
|
Gene Alias
|
H3.1|H3/c|H3C1|H3C10|H3C11|H3C12|H3C2|H3C4|H3C6|H3C7|H3C8|H3FC|HIST1H3C |
|
Transcripts
|
ENSG00000287080
|
|
Virus
|
HTLV1 |
|
Gene Type
|
protein-coding |
|
HPA Location Info
|
Nucleoplasm;Acrosome, Principal piece; 
|
|
Membrane Info
|
Disease related genes, Predicted intracellular proteins |
|
Uniport_ID
|
P68431
|
|
HGNC ID
|
HGNC:4768
|
|
OMIM ID
|
602812 |
|
Summary
|
Histones are basic nuclear proteins that are responsible for the nucleosome structure of the chromosomal fiber in eukaryotes. Two molecules of each of the four core histones (H2A, H2B, H3, and H4) form an octamer, around which approximately 146 bp of DNA is wrapped in repeating units, called nucleosomes. The linker histone, H1, interacts with linker DNA between nucleosomes and functions in the compaction of chromatin into higher order structures. This gene is intronless and encodes a replication-dependent histone that is a member of the histone H3 family. Transcripts from this gene lack polyA tails but instead contain a palindromic termination element. This gene is found in the large histone gene cluster on chromosome 6. [provided by RefSeq, Aug 2015] |
Target gene [H3C3] related to VISs 
Integration Table: if previous studies reported that target gene was altered by virus integration events, the overlap between VISs in this literature and Cistrome factors was listed in this section
| DVID |
Chromosome |
HM |
TFBS |
CA |
Sum of Overlapped Records |
Detail |
| 6000575 |
chr6 |
518 |
672 |
24 |
1214 |
View |
Target gene [H3C3] related to Omics data
| Data ID |
Experiment type |
Sample number |
Platform |
|
GSE52244
|
Expression array |
15 |
[HuEx-1_0-st] Affymetrix Human Exon 1.0 ST Array [probe set (exon) version] |
|
C GSE94732
|
Chip-seq |
24 |
Illumina NextSeq 500 (Homo sapiens);illumina Genome Analyzer IIx (Homo sapiens) |
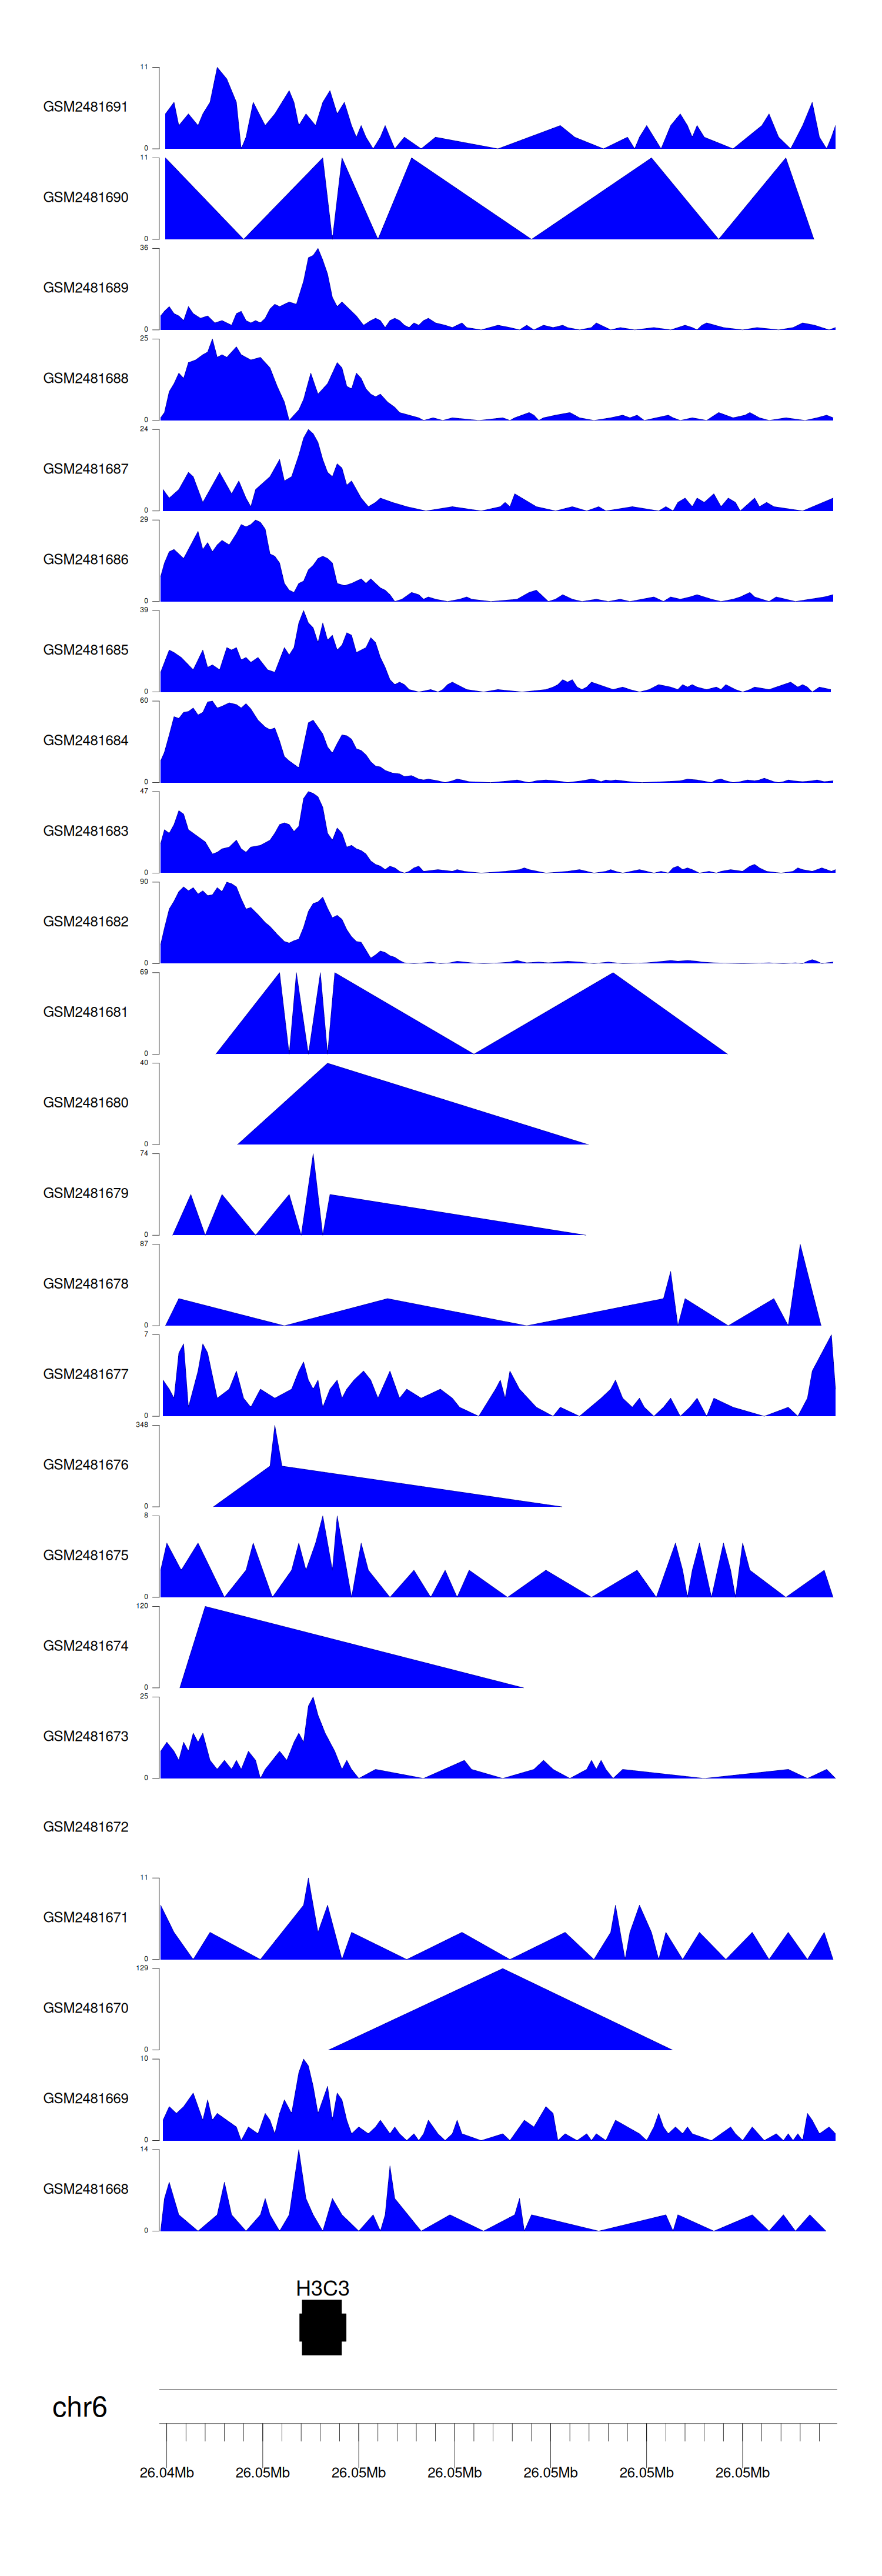
When the gene can detect a peak in the dataset, a peak plot will be displayed.
> Dataset: GSE94732 - H3C3 peak across samples
|
Peak Plot
|
|
|
