Gene Information
|
Gene Name
|
HABP2 |
|
Gene ID
|
3026
|
|
Gene Full Name
|
hyaluronan binding protein 2 |
|
Gene Alias
|
FSAP|HABP|HGFAL|NMTC5|PHBP |
|
Transcripts
|
ENSG00000148702
|
|
Virus
|
HBV |
|
Gene Type
|
protein-coding |
|
HPA Location Info
|
Secreted to blood; 
|
|
Membrane Info
|
Candidate cardiovascular disease genes, Disease related genes, Enzymes, Human disease related genes, Plasma proteins, Potential drug targets, Predicted intracellular proteins, Predicted secreted proteins |
|
Uniport_ID
|
Q14520
|
|
HGNC ID
|
HGNC:4798
|
|
OMIM ID
|
603924 |
|
Summary
|
This gene encodes a member of the peptidase S1 family of serine proteases. The encoded preproprotein is secreted by hepatocytes and proteolytically processed to generate heavy and light chains that form the mature heterodimer. Further autoproteolysis leads to smaller, inactive peptides. This extracellular protease binds hyaluronic acid and may play a role in the coagulation and fibrinolysis systems. Mutations in this gene are associated with nonmedullary thyroid cancer and susceptibility to venous thromboembolism. Alternative splicing results in multiple transcript variants, at least one of which encodes a preproprotein that is proteolytically processed. [provided by RefSeq, Jan 2016] |
Target gene [HABP2] related to VISs 
Integration Table: if previous studies reported that target gene was altered by virus integration events, the overlap between VISs in this literature and Cistrome factors was listed in this section
| DVID |
Chromosome |
HM |
TFBS |
CA |
Sum of Overlapped Records |
Detail |
| 1002613 |
chr10 |
98 |
39 |
100 |
237 |
View |
| 1015563 |
chr10 |
2 |
0 |
0 |
2 |
View |
Target gene [HABP2] related to Omics data
| Data ID |
Experiment type |
Sample number |
Platform |
|
GSE236281
|
RNA-seq |
12 |
Illumina MiSeq (Homo sapiens) |
|
C GSE35465
|
Chip-seq;RNA-seq |
6 |
Illumina HiSeq 2000 (Homo sapiens) |
|
GSE199850
|
scRNA-seq |
1 |
HiSeq X Ten (Homo sapiens) |
|
C GSE68402
|
Chip-seq |
26 |
Illumina MiSeq (Homo sapiens);Illumina HiSeq 2500 (Homo sapiens) |
|
TCGA_LIHC_HBV
|
DNA methylation sequencing;RNA-seq |
97 |
TCGA |
|
C GSE270130
|
Chip-seq |
27 |
Illumina NovaSeq 6000 (Homo sapiens) |
|
GSE224901
|
RNA-seq |
21 |
Illumina NovaSeq 6000 (Homo sapiens) |
|
GSE100400
|
Chip-seq;RNA-seq;4C_cccDNA |
31 |
Illumina NextSeq 500 (Homo sapiens);Illumina NextSeq 500 (Mus musculus) |
|
GSE173897
|
RNA-seq |
95 |
Illumina HiSeq 4000 (Homo sapiens) |
|
GSE262515
|
RNA-seq |
21 |
Illumina HiSeq 2500 (Homo sapiens);Illumina HiSeq 2500 (Mus musculus) |
|
GSE110345
|
RNA-seq |
4 |
Illumina HiSeq 2500 (Homo sapiens) |
|
C GSE131257
|
ATAC-seq;RNA-seq |
19 |
Illumina HiSeq 2500 (Homo sapiens) |
|
GSE94660
|
RNA-seq |
42 |
Illumina HiSeq 2500 (Homo sapiens) |
When the gene can detect a peak in the dataset, a peak plot will be displayed.
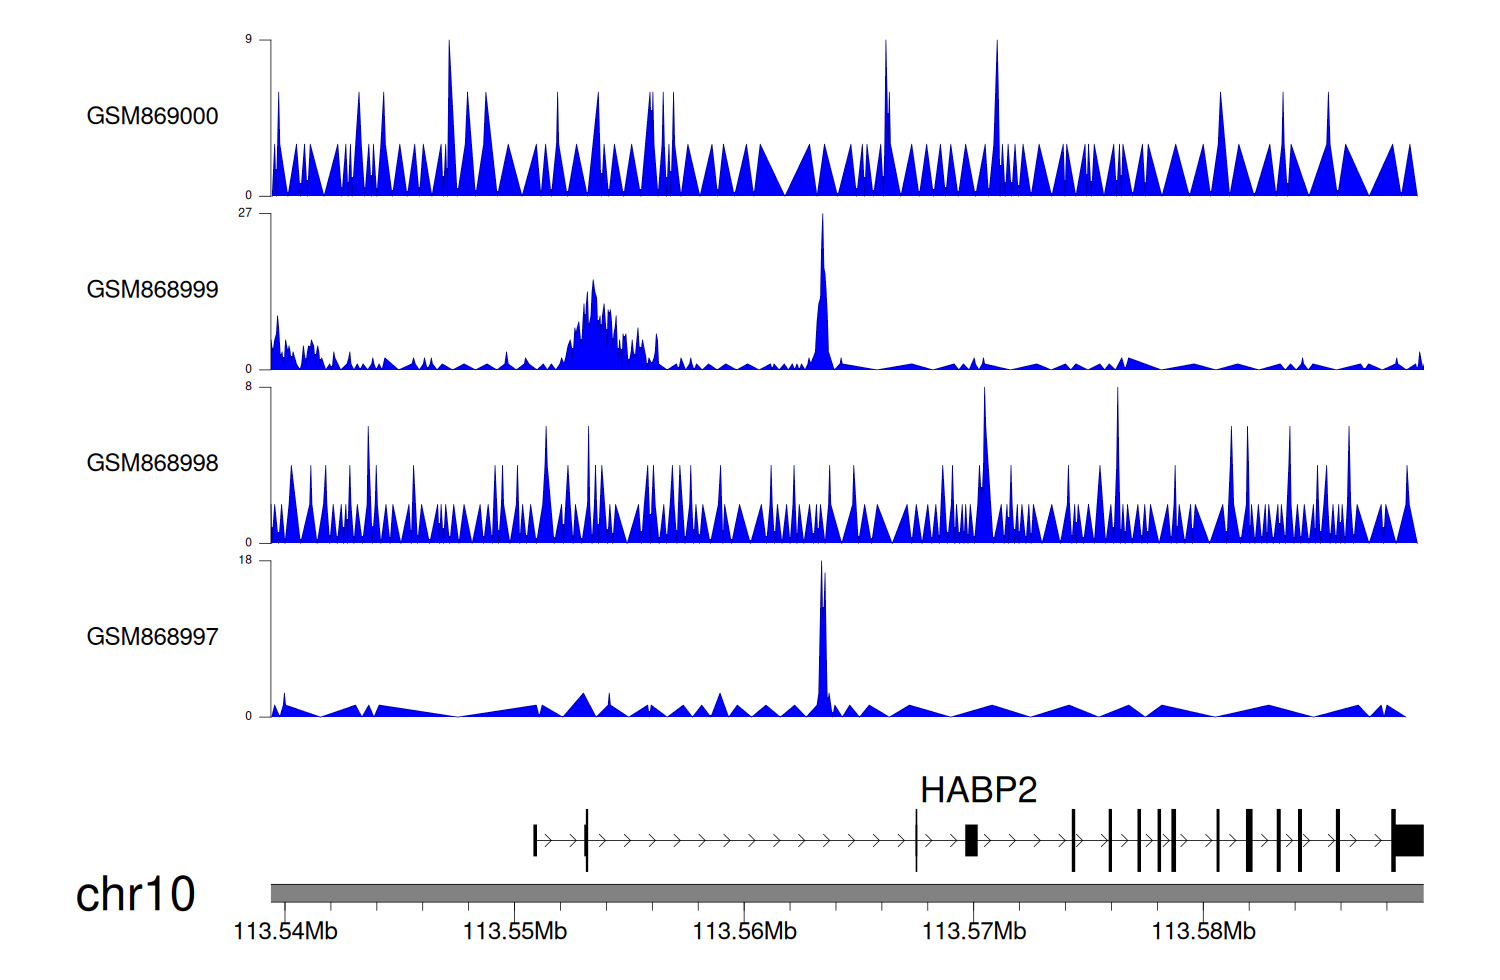
> Dataset: GSE35465 - HABP2 peak across samples
|
Peak Plot
|
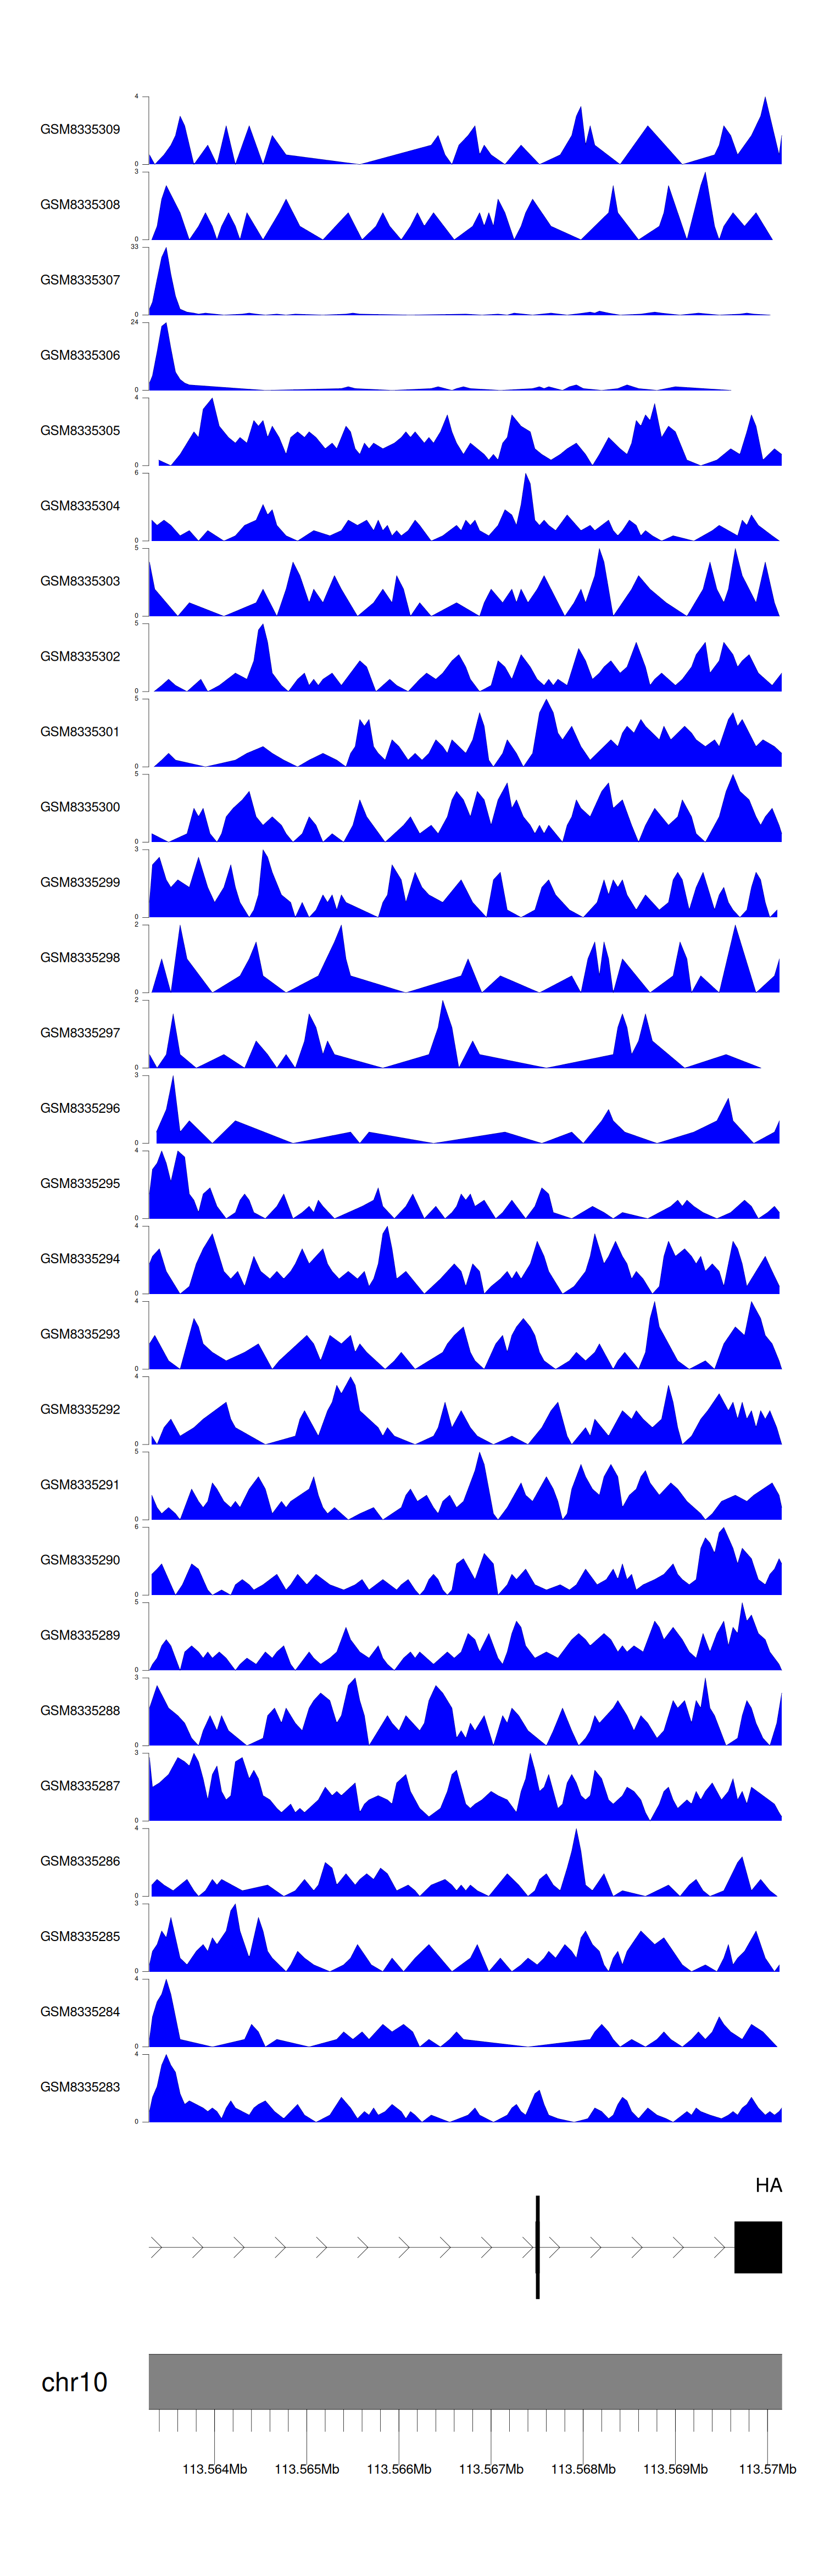
> Dataset: GSE68402 - HABP2 peak across samples
|
Peak Plot
|
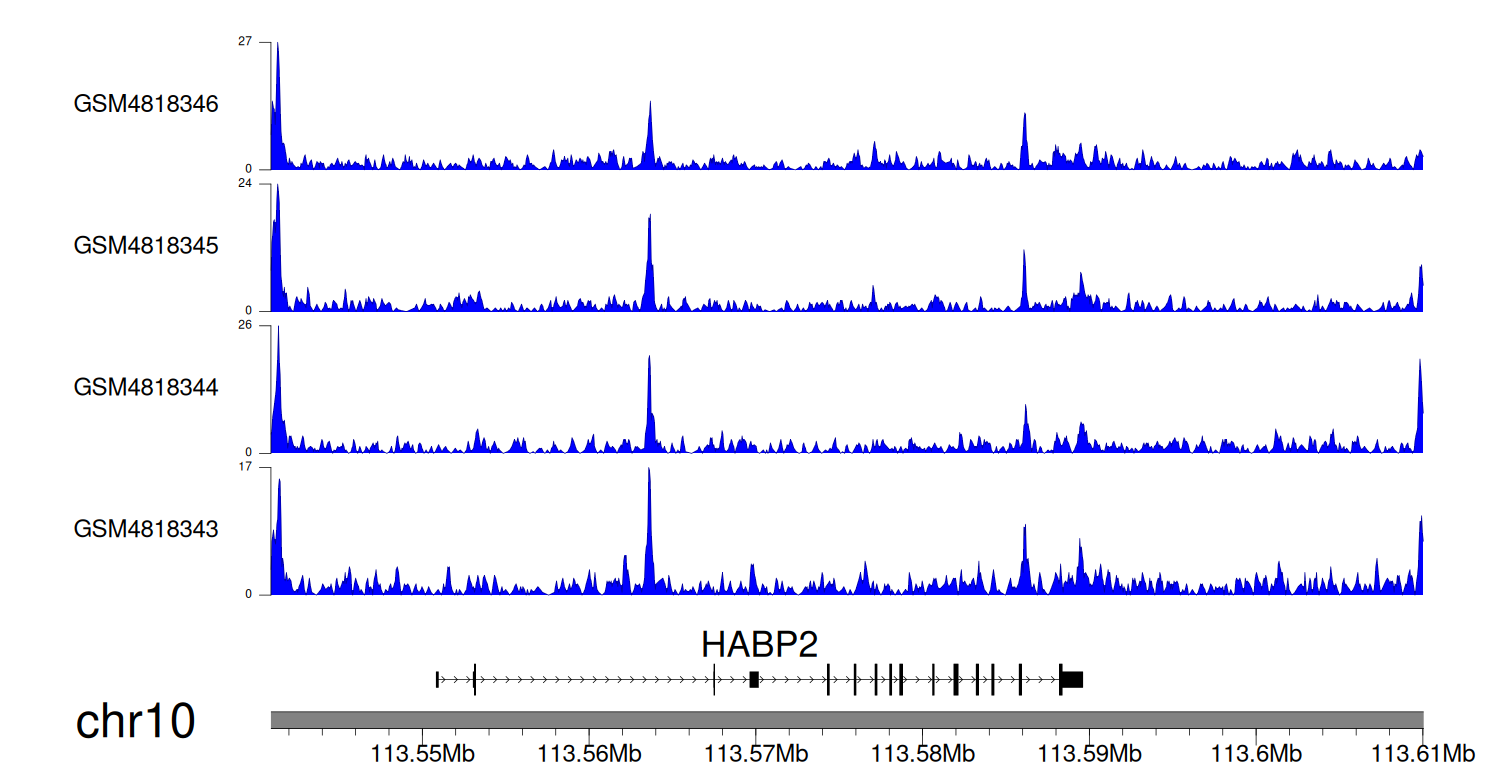
> Dataset: GSE270130 - HABP2 peak across samples
|
Peak Plot
|
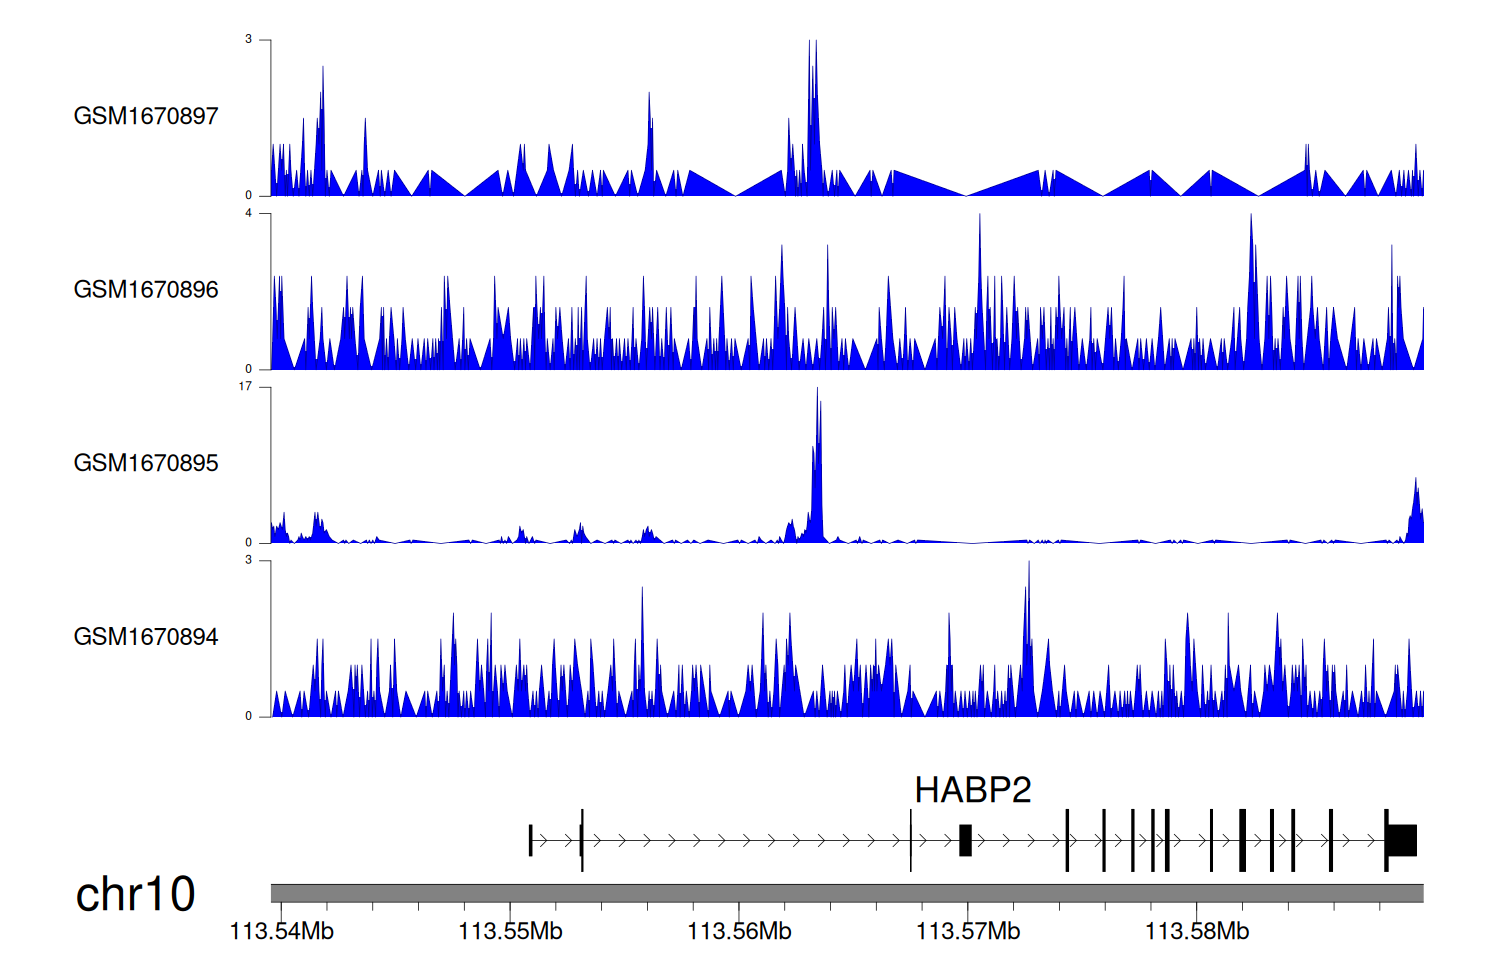
> Dataset: GSE131257 - HABP2 peak across samples
|
Peak Plot
|
|
|
