Gene Information
|
Gene Name
|
HARS1 |
|
Gene ID
|
3035
|
|
Gene Full Name
|
histidyl-tRNA synthetase 1 |
|
Gene Alias
|
CMT2W|HARS|HRS|USH3B |
|
Transcripts
|
ENSG00000170445
|
|
Virus
|
HTLV1 |
|
Gene Type
|
protein-coding |
|
HPA Location Info
|
Cytosol; 
|
|
Membrane Info
|
Disease related genes, Enzymes, Human disease related genes, Metabolic proteins, Plasma proteins, Potential drug targets, Predicted intracellular proteins |
|
Uniport_ID
|
P12081
|
|
HGNC ID
|
HGNC:4816
|
|
OMIM ID
|
142810 |
|
Summary
|
Aminoacyl-tRNA synthetases are a class of enzymes that charge tRNAs with their cognate amino acids. The protein encoded by this gene is a cytoplasmic enzyme which belongs to the class II family of aminoacyl-tRNA synthetases. The enzyme is responsible for the synthesis of histidyl-transfer RNA, which is essential for the incorporation of histidine into proteins. The gene is located in a head-to-head orientation with HARSL on chromosome five, where the homologous genes share a bidirectional promoter. The gene product is a frequent target of autoantibodies in the human autoimmune disease polymyositis/dermatomyositis. Several transcript variants encoding different isoforms have been found for this gene. [provided by RefSeq, Apr 2012] |
Target gene [HARS1] related to VISs 
Integration Table: if previous studies reported that target gene was altered by virus integration events, the overlap between VISs in this literature and Cistrome factors was listed in this section
| DVID |
Chromosome |
HM |
TFBS |
CA |
Sum of Overlapped Records |
Detail |
| 6015280 |
chr5 |
3 |
11 |
0 |
14 |
View |
Target gene [HARS1] related to Omics data
| Data ID |
Experiment type |
Sample number |
Platform |
|
GSE52244
|
Expression array |
15 |
[HuEx-1_0-st] Affymetrix Human Exon 1.0 ST Array [probe set (exon) version] |
|
GSE224047
|
RNA-seq |
10 |
Illumina NextSeq 500 (Homo sapiens) |
|
C GSE94732
|
Chip-seq |
24 |
Illumina NextSeq 500 (Homo sapiens);illumina Genome Analyzer IIx (Homo sapiens) |
When the gene can detect a peak in the dataset, a peak plot will be displayed.
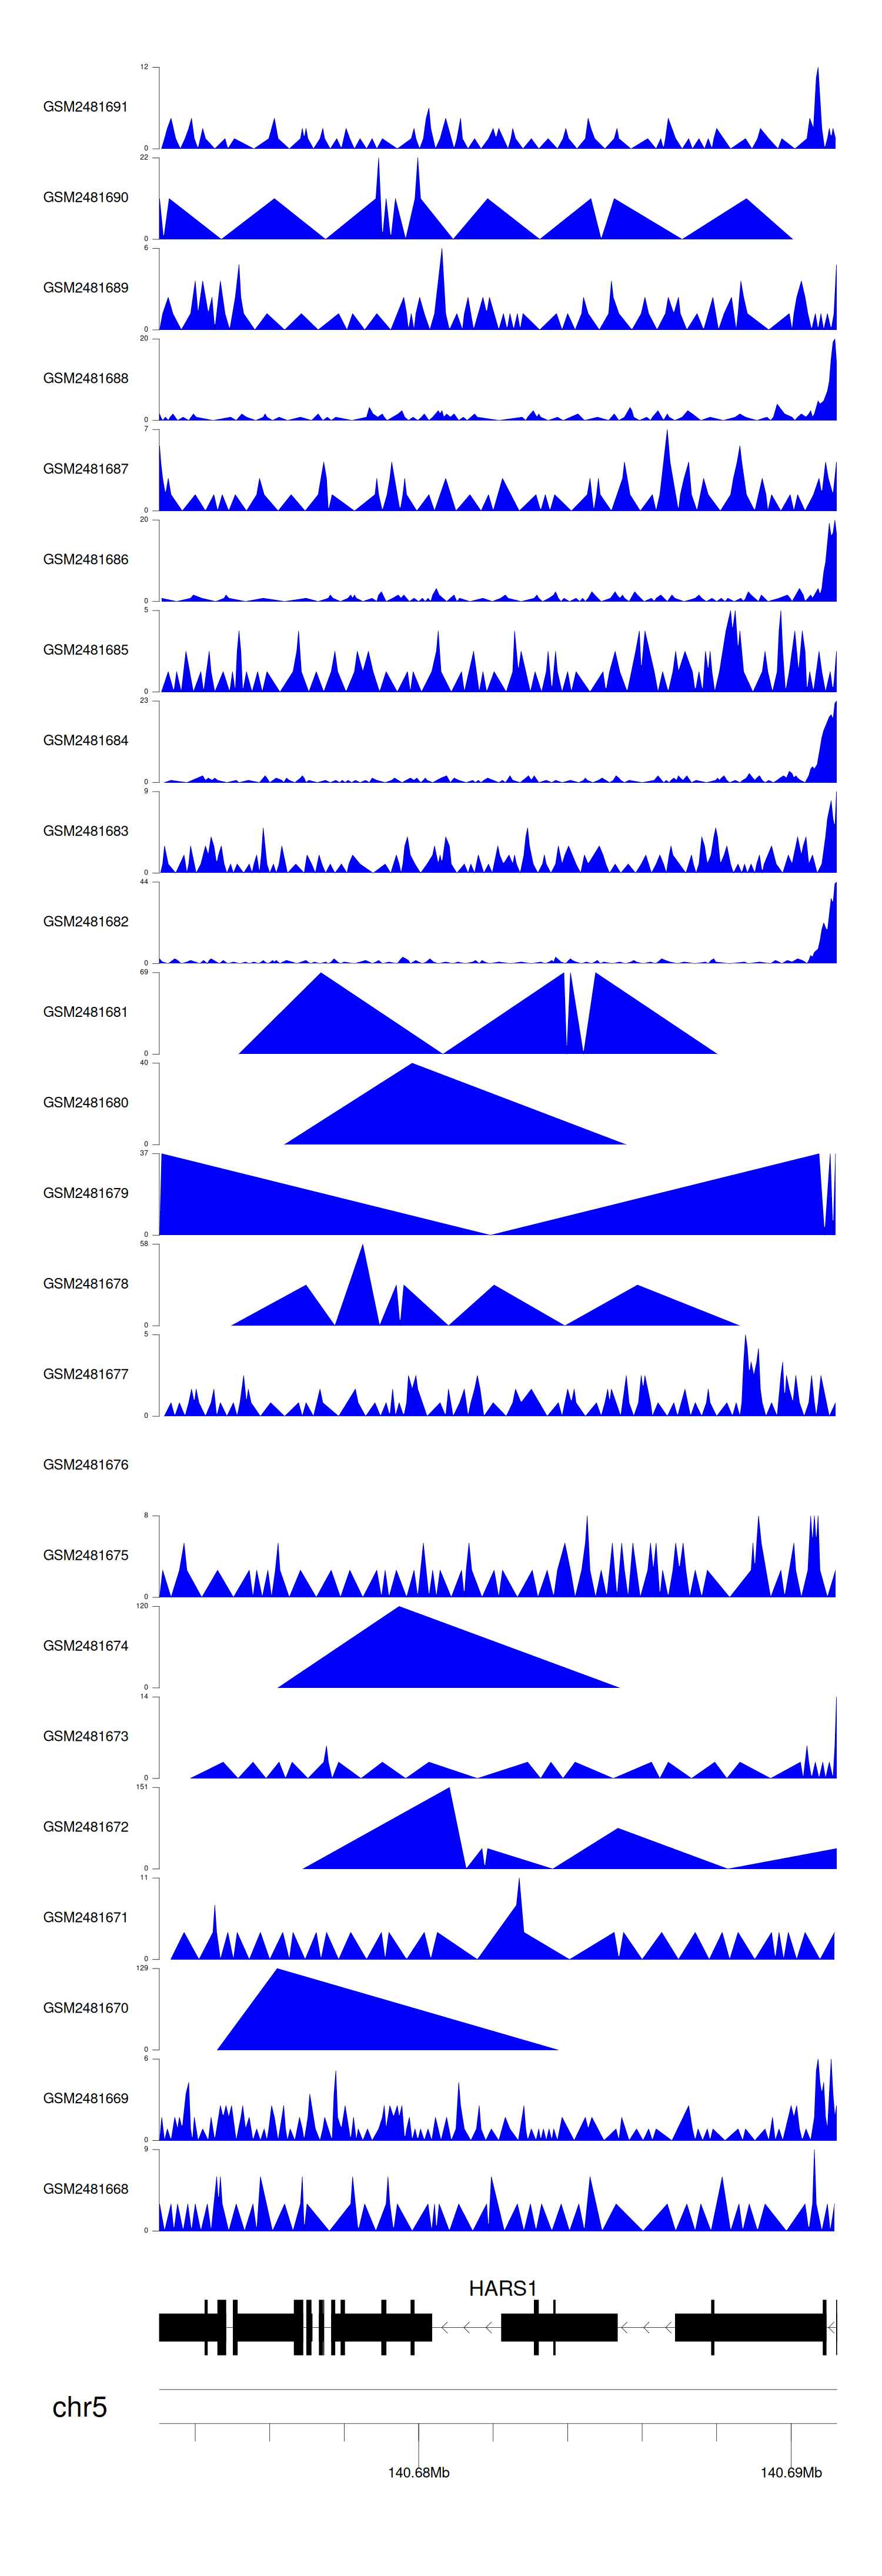
> Dataset: GSE94732 - HARS1 peak across samples
|
Peak Plot
|
|
|
