Gene Information
|
Gene Name
|
HECW2 |
|
Gene ID
|
57520
|
|
Gene Full Name
|
HECT, C2 and WW domain containing E3 ubiquitin protein ligase 2 |
|
Gene Alias
|
NDHSAL|NEDL2 |
|
Transcripts
|
ENSG00000138411
|
|
Virus
|
HBV |
|
Gene Type
|
protein-coding |
|
HPA Location Info
|

|
|
Membrane Info
|
Disease related genes, Enzymes, Human disease related genes, Metabolic proteins, Plasma proteins, Potential drug targets, Predicted intracellular proteins |
|
Uniport_ID
|
Q9P2P5
|
|
HGNC ID
|
HGNC:29853
|
|
OMIM ID
|
617245 |
|
Summary
|
This gene encodes a member of a family of E3 ubiquitin ligases which plays an important role in the proliferation, migration and differentiation of neural crest cells as a regulator of glial cell line-derived neurotrophic factor (GDNF)/Ret signaling. This gene also plays an important role in angiogenesis through stabilization of endothelial cell-to-cell junctions as a regulator of angiomotin-like 1 stability. The encoded protein contains an N-terminal calcium/lipid-binding (C2) domain involved in membrane targeting, two-four WW domains responsible for cellular localization and substrate recognition, and a C-terminal homologous with E6-associated protein C-terminus (HECT) catalytic domain. Naturally occurring mutations in this gene are associated with neurodevelopmental delay, hypotonia, and epilepsy. The decreased expression of this gene in the aganglionic colon is associated with Hirschsprung's disease. Alternative splicing results in multiple transcript variants. [provided by RefSeq, Feb 2017] |
Target gene [HECW2] related to VISs 
Integration Table: if previous studies reported that target gene was altered by virus integration events, the overlap between VISs in this literature and Cistrome factors was listed in this section
| DVID |
Chromosome |
HM |
TFBS |
CA |
Sum of Overlapped Records |
Detail |
| 1009675 |
chr2 |
11 |
4 |
0 |
15 |
View |
Target gene [HECW2] related to Omics data
| Data ID |
Experiment type |
Sample number |
Platform |
|
GSE236281
|
RNA-seq |
12 |
Illumina MiSeq (Homo sapiens) |
|
C GSE35465
|
Chip-seq;RNA-seq |
6 |
Illumina HiSeq 2000 (Homo sapiens) |
|
GSE199850
|
scRNA-seq |
1 |
HiSeq X Ten (Homo sapiens) |
|
C GSE68402
|
Chip-seq |
26 |
Illumina MiSeq (Homo sapiens);Illumina HiSeq 2500 (Homo sapiens) |
|
TCGA_LIHC_HBV
|
DNA methylation sequencing;RNA-seq |
97 |
TCGA |
|
C GSE270130
|
Chip-seq |
27 |
Illumina NovaSeq 6000 (Homo sapiens) |
|
GSE224901
|
RNA-seq |
21 |
Illumina NovaSeq 6000 (Homo sapiens) |
|
GSE100400
|
Chip-seq;RNA-seq;4C_cccDNA |
31 |
Illumina NextSeq 500 (Homo sapiens);Illumina NextSeq 500 (Mus musculus) |
|
GSE173897
|
RNA-seq |
95 |
Illumina HiSeq 4000 (Homo sapiens) |
|
GSE262515
|
RNA-seq |
21 |
Illumina HiSeq 2500 (Homo sapiens);Illumina HiSeq 2500 (Mus musculus) |
|
GSE110345
|
RNA-seq |
4 |
Illumina HiSeq 2500 (Homo sapiens) |
|
C GSE131257
|
ATAC-seq;RNA-seq |
19 |
Illumina HiSeq 2500 (Homo sapiens) |
|
GSE94660
|
RNA-seq |
42 |
Illumina HiSeq 2500 (Homo sapiens) |
When the gene can detect a peak in the dataset, a peak plot will be displayed.
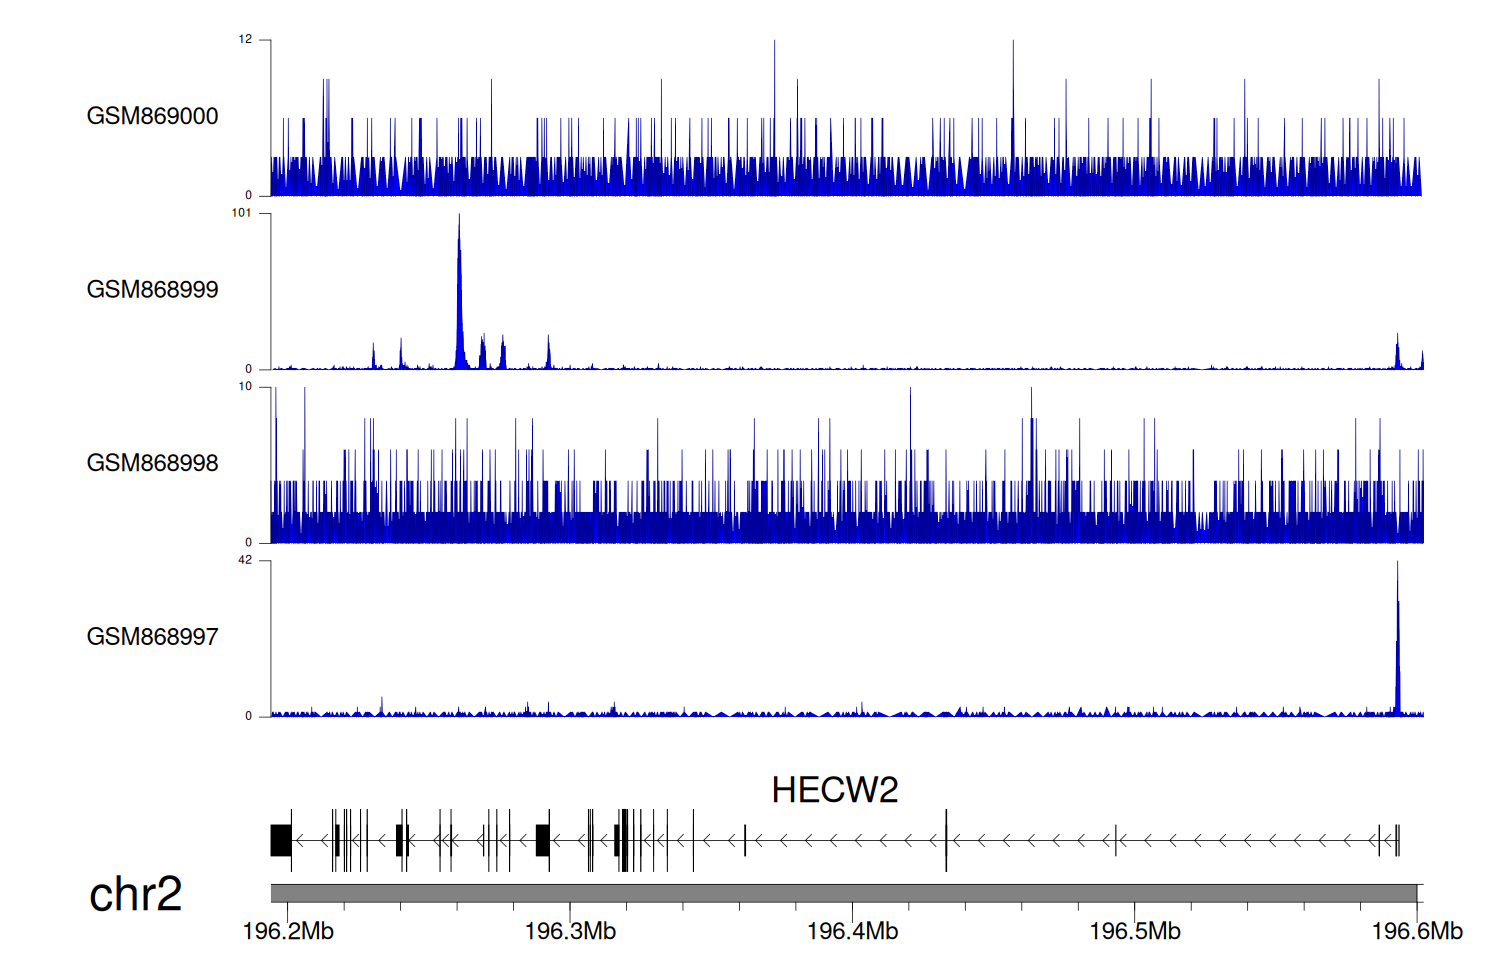
> Dataset: GSE35465 - HECW2 peak across samples
|
Peak Plot
|
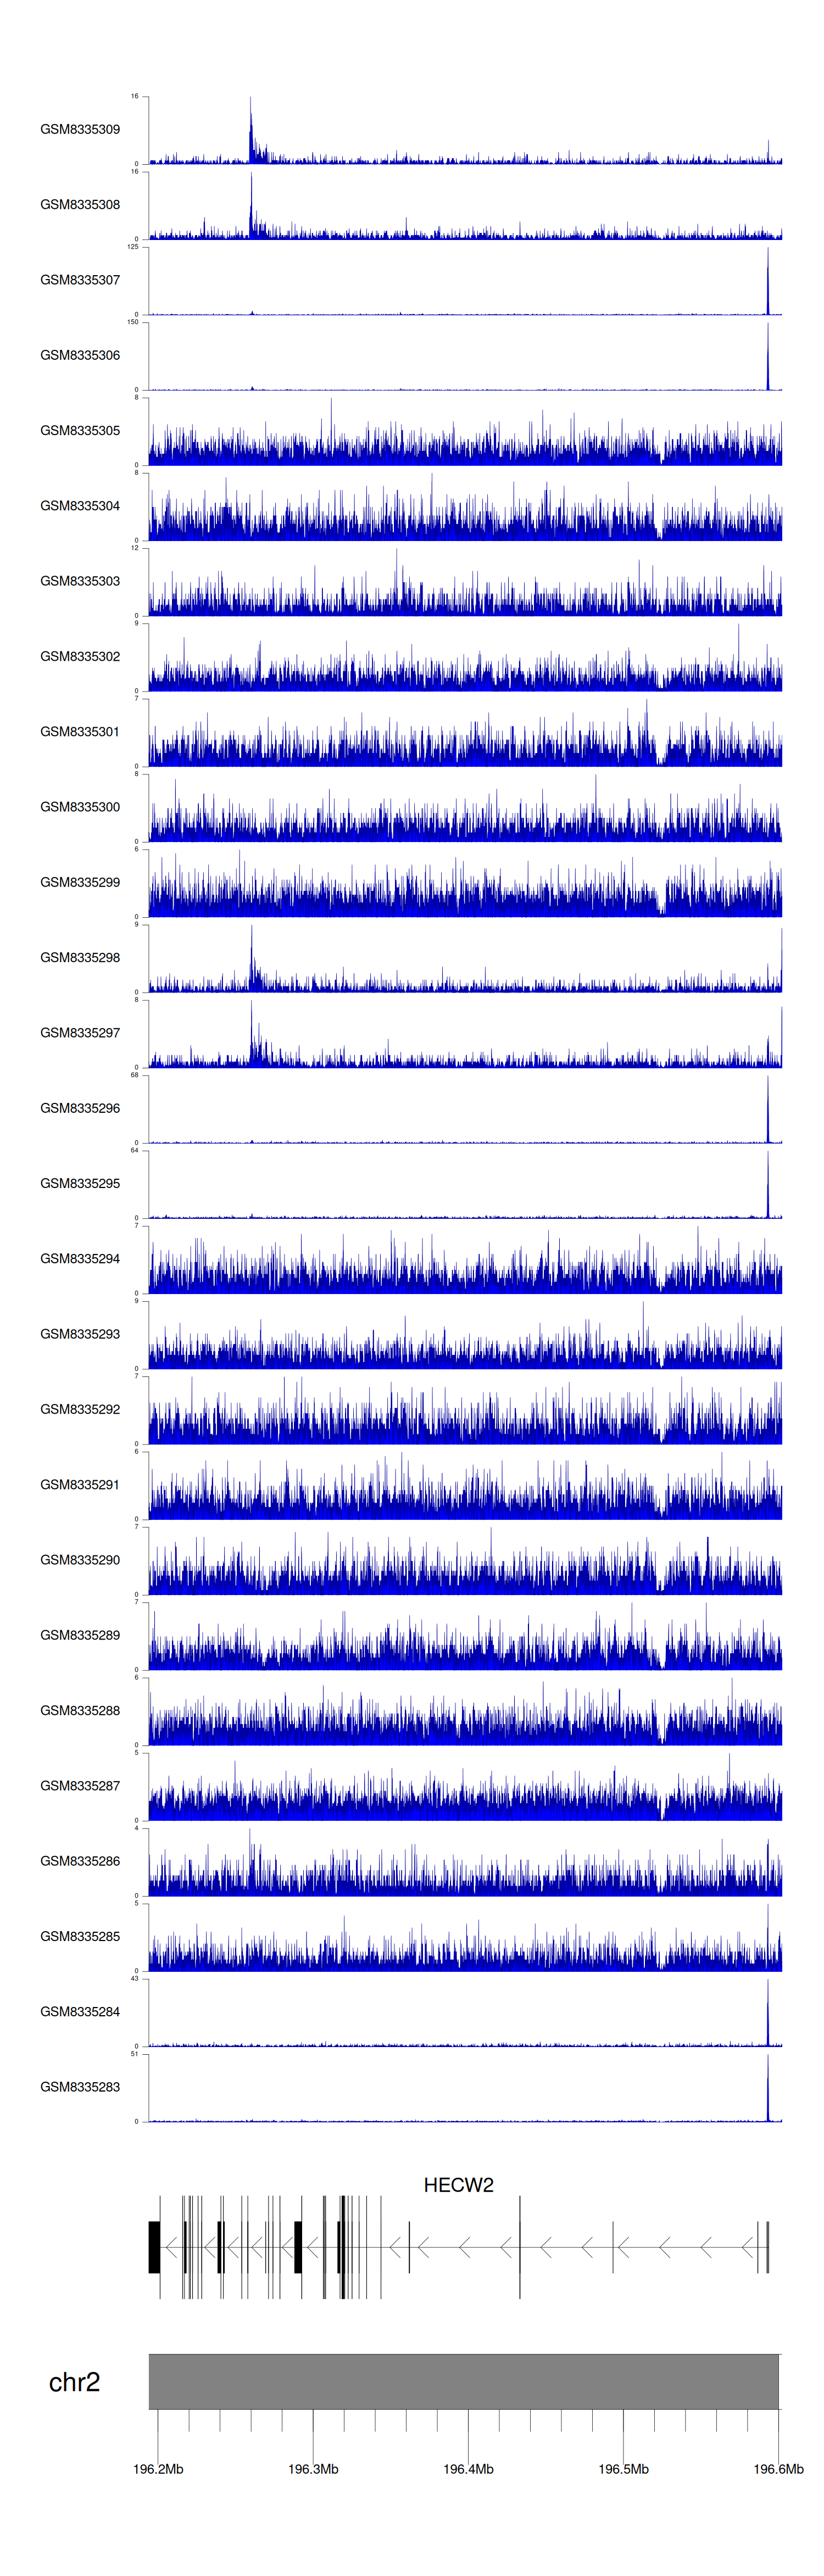
> Dataset: GSE68402 - HECW2 peak across samples
|
Peak Plot
|
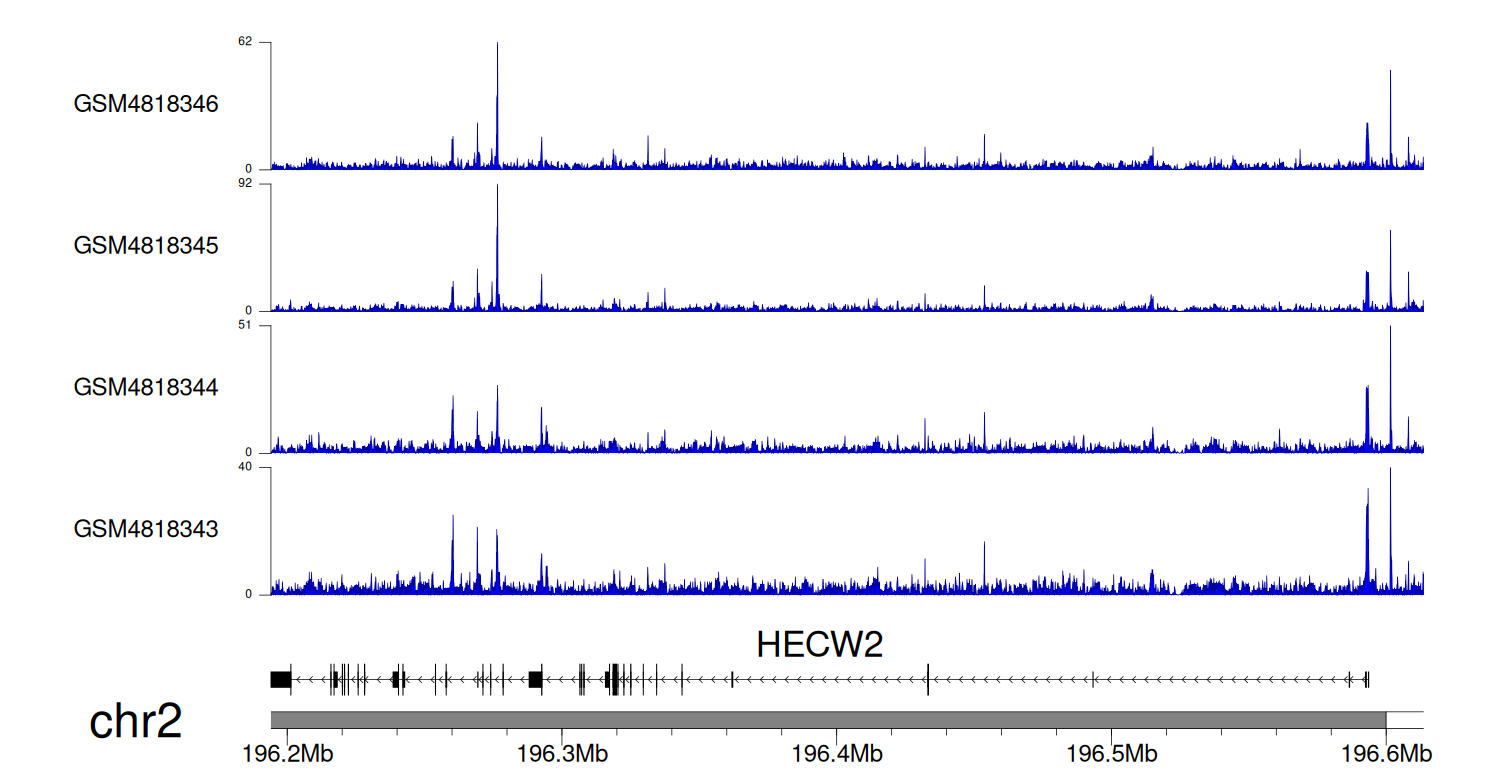
> Dataset: GSE270130 - HECW2 peak across samples
|
Peak Plot
|
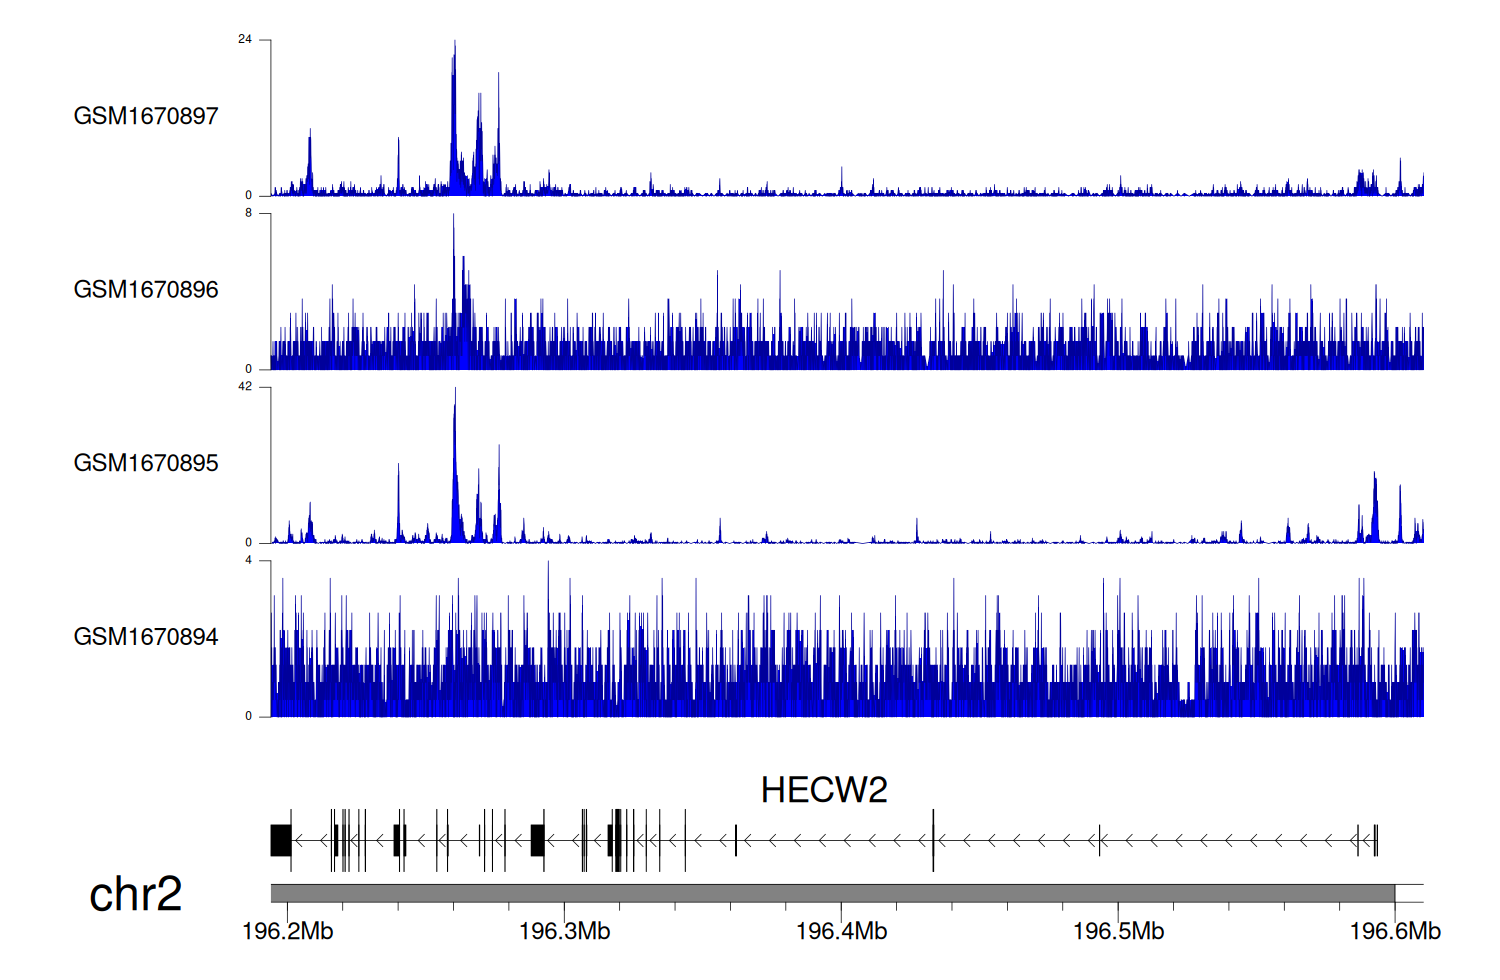
> Dataset: GSE131257 - HECW2 peak across samples
|
Peak Plot
|
|
|
