Gene Information
|
Gene Name
|
IFNA1 |
|
Gene ID
|
3439
|
|
Gene Full Name
|
interferon alpha 1 |
|
Gene Alias
|
IFL|IFN|IFN-ALPHA|IFN-alphaD|IFNA13|IFNA@|leIF D |
|
Transcripts
|
ENSG00000197919
|
|
Virus
|
EBOV |
|
Gene Type
|
protein-coding |
|
HPA Location Info
|
Secreted to blood; 
|
|
Membrane Info
|
Cancer-related genes, Plasma proteins, Predicted secreted proteins |
|
Uniport_ID
|
P01562
|
|
HGNC ID
|
HGNC:5417
|
|
OMIM ID
|
147660 |
|
Summary
|
This gene is a member of the alpha interferon gene cluster on chromosome 9. The encoded cytokine is a member of the type I interferon family that is produced in response to viral infection as a key part of the innate immune response with potent antiviral, antiproliferative and immunomodulatory properties. This cytokine, like other type I interferons, binds a plasma membrane receptor made of IFNAR1 and IFNAR2 that is ubiquitously expressed, and thus is able to act on virtually all body cells. This cytokine is upregulated in preeclamptic placentas and is thought to be a mediator of preeclampsia. [provided by RefSeq, Aug 2020] |
Target gene [IFNA1] related to virus gene/protein/region 
Mutation Table: if previous studies reported that target gene was related to virus gene/region/protein, the information in this literature was listed in this section
Target gene [IFNA1] related to Omics data
| Data ID |
Experiment type |
Sample number |
Platform |
|
E GSE96590
|
RNA-seq |
20 |
Illumina HiSeq 1000 (Homo sapiens) |
|
GSE80131
|
RNA-seq |
6 |
Illumina HiSeq 2500 (Homo sapiens) |
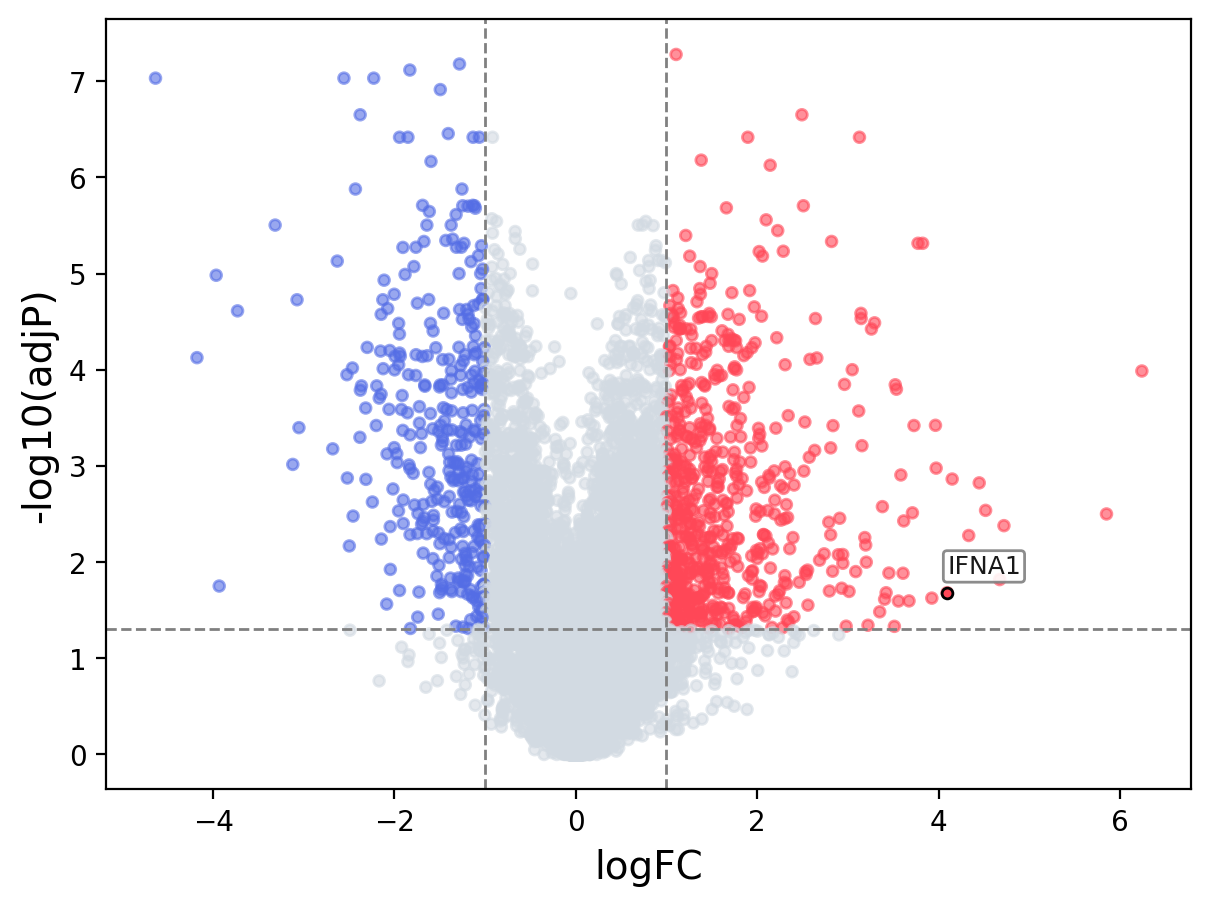
When the query gene is differentially changed in the dataset, a volcano/bar plot will be displayed.
> Dataset: GSE96590 - IFNA1 expression across samples
|
Volcano Plot
|
Bar Plot
|
|
|
