Gene Information
|
Gene Name
|
IFT140 |
|
Gene ID
|
9742
|
|
Gene Full Name
|
intraflagellar transport 140 |
|
Gene Alias
|
CED5|MZSDS|PKD9|RP80|SRTD9|WDTC2|c305C8.4|c380F5.1|gs114 |
|
Transcripts
|
ENSG00000187535
|
|
Virus
|
HBV |
|
Gene Type
|
protein-coding |
|
HPA Location Info
|
Basal body;Nucleoplasm, Mitochondria; 
|
|
Membrane Info
|
Disease related genes, Human disease related genes, Predicted intracellular proteins |
|
Uniport_ID
|
Q96RY7
|
|
HGNC ID
|
HGNC:29077
|
|
OMIM ID
|
614620 |
|
Summary
|
This gene encodes one of the subunits of the intraflagellar transport (IFT) complex A. Intraflagellar transport is involved in the genesis, resorption and signaling of primary cilia. The primary cilium is a microtubule-based sensory organelle at the surface of most quiescent mammalian cells, that receives signals from its environment, such as the flow of fluid, light or odors, and transduces those signals to the nucleus. Loss of the corresponding protein in mouse results in renal cystic disease. [provided by RefSeq, Jun 2012] |
Target gene [IFT140] related to VISs 
Integration Table: if previous studies reported that target gene was altered by virus integration events, the overlap between VISs in this literature and Cistrome factors was listed in this section
| DVID |
Chromosome |
HM |
TFBS |
CA |
Sum of Overlapped Records |
Detail |
| 1009735 |
chr16 |
7 |
6 |
1 |
14 |
View |
| 1022849 |
chr16 |
7 |
6 |
1 |
14 |
View |
| 1041145 |
chr16 |
3 |
2 |
0 |
5 |
View |
Target gene [IFT140] related to Omics data
| Data ID |
Experiment type |
Sample number |
Platform |
|
GSE236281
|
RNA-seq |
12 |
Illumina MiSeq (Homo sapiens) |
|
C GSE35465
|
Chip-seq;RNA-seq |
6 |
Illumina HiSeq 2000 (Homo sapiens) |
|
C GSE68402
|
Chip-seq |
26 |
Illumina MiSeq (Homo sapiens);Illumina HiSeq 2500 (Homo sapiens) |
|
TCGA_LIHC_HBV
|
DNA methylation sequencing;RNA-seq |
97 |
TCGA |
|
C GSE270130
|
Chip-seq |
27 |
Illumina NovaSeq 6000 (Homo sapiens) |
|
GSE224901
|
RNA-seq |
21 |
Illumina NovaSeq 6000 (Homo sapiens) |
|
GSE100400
|
Chip-seq;RNA-seq;4C_cccDNA |
31 |
Illumina NextSeq 500 (Homo sapiens);Illumina NextSeq 500 (Mus musculus) |
|
GSE173897
|
RNA-seq |
95 |
Illumina HiSeq 4000 (Homo sapiens) |
|
GSE262515
|
RNA-seq |
21 |
Illumina HiSeq 2500 (Homo sapiens);Illumina HiSeq 2500 (Mus musculus) |
|
GSE110345
|
RNA-seq |
4 |
Illumina HiSeq 2500 (Homo sapiens) |
|
C GSE131257
|
ATAC-seq;RNA-seq |
19 |
Illumina HiSeq 2500 (Homo sapiens) |
|
GSE94660
|
RNA-seq |
42 |
Illumina HiSeq 2500 (Homo sapiens) |
When the gene can detect a peak in the dataset, a peak plot will be displayed.
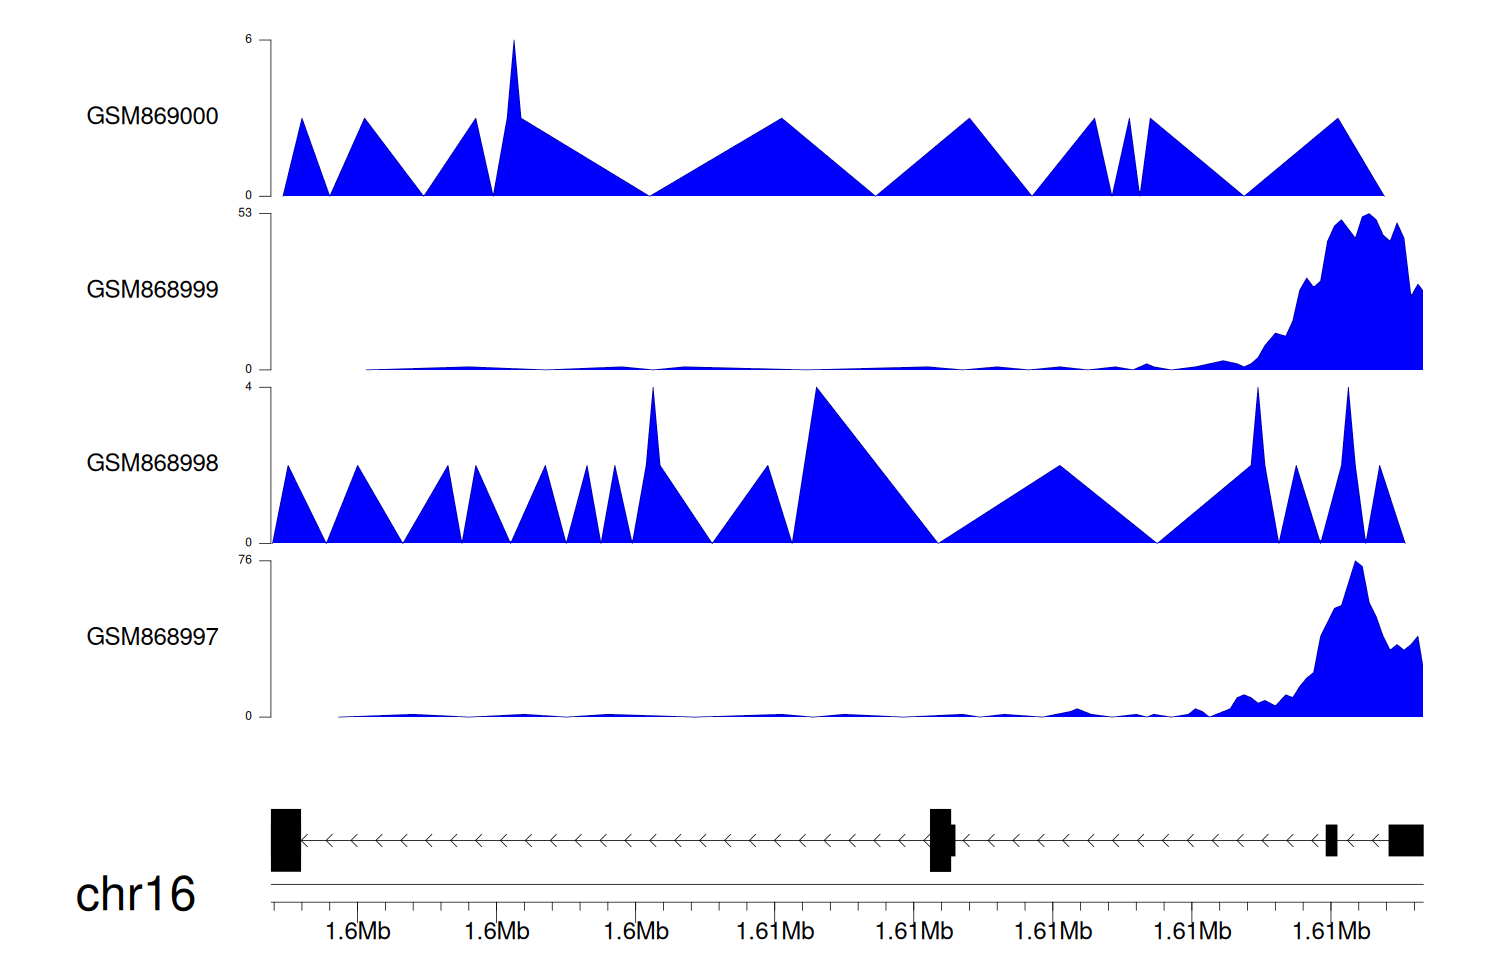
> Dataset: GSE35465 - IFT140 peak across samples
|
Peak Plot
|
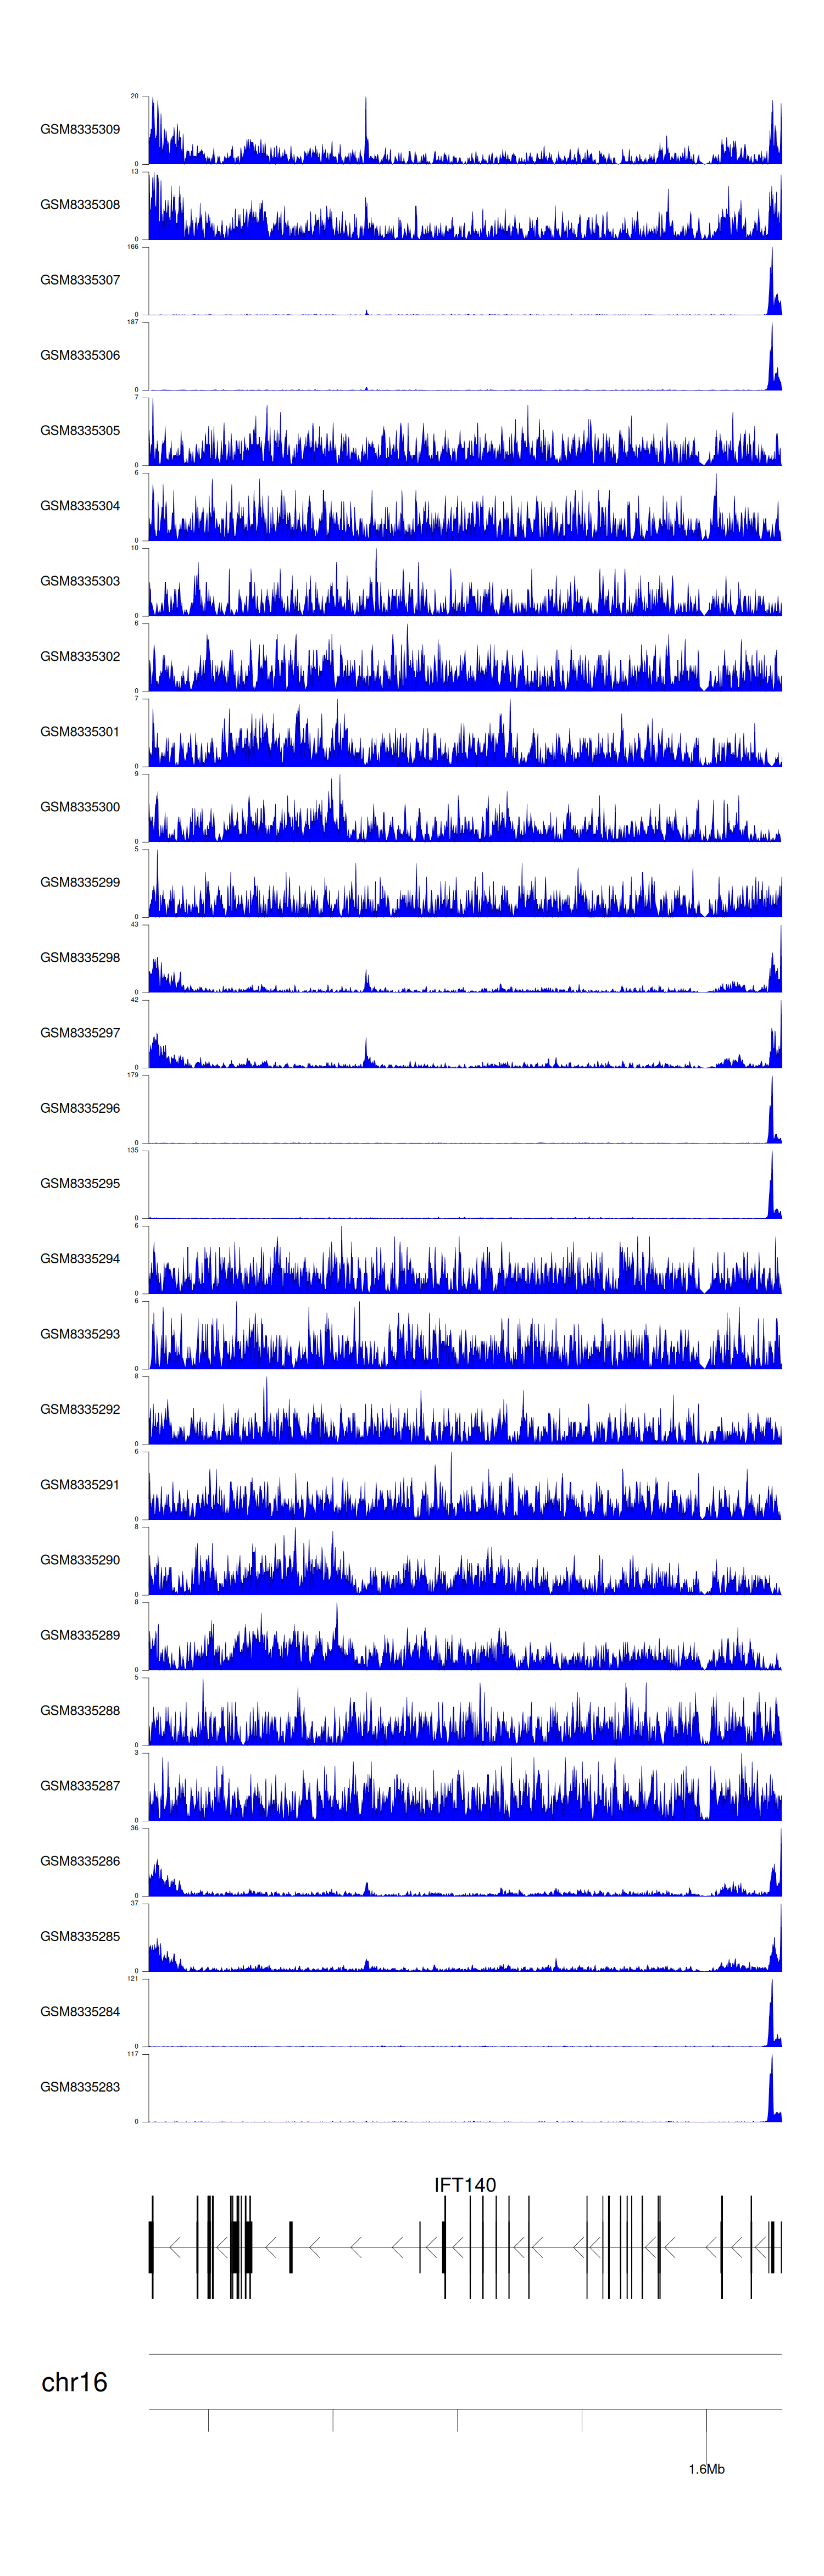
> Dataset: GSE68402 - IFT140 peak across samples
|
Peak Plot
|
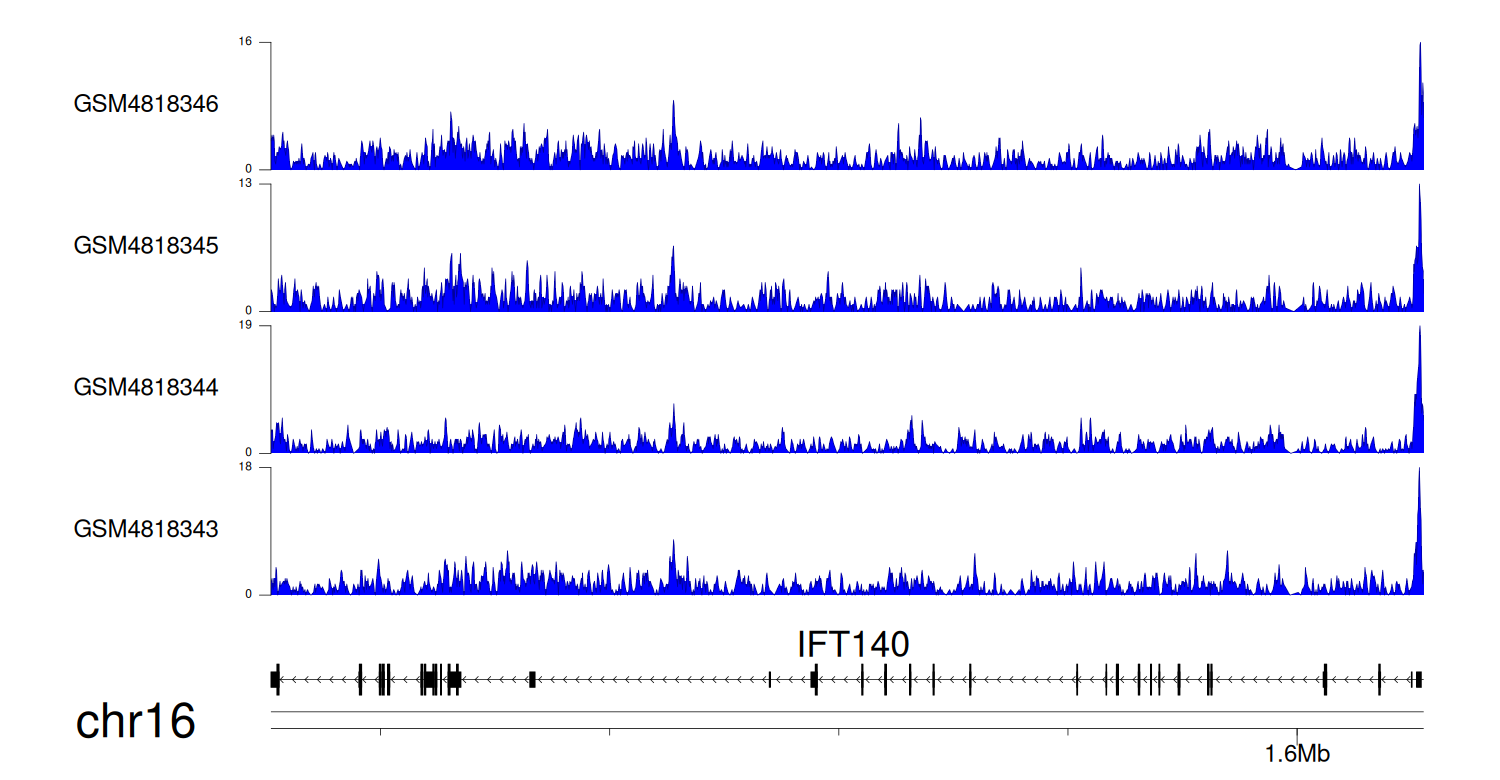
> Dataset: GSE270130 - IFT140 peak across samples
|
Peak Plot
|
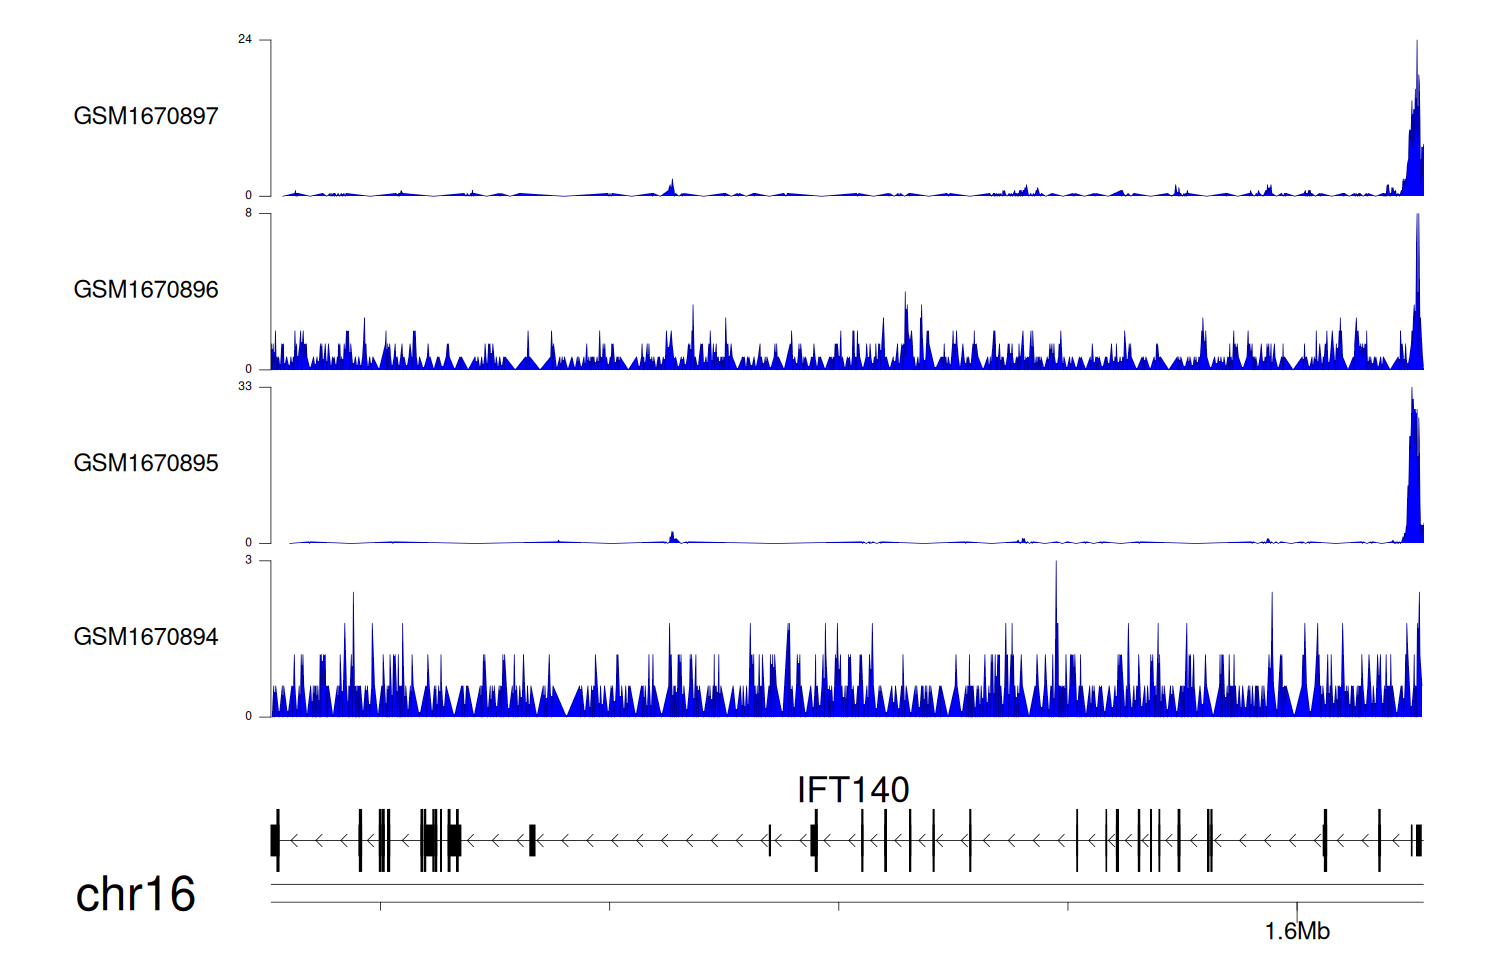
> Dataset: GSE131257 - IFT140 peak across samples
|
Peak Plot
|
|
|
