Gene Information
|
Gene Name
|
IL1A |
|
Gene ID
|
3552
|
|
Gene Full Name
|
interleukin 1 alpha |
|
Gene Alias
|
IL-1 alpha|IL-1A|IL1|IL1-ALPHA|IL1F1 |
|
Transcripts
|
ENSG00000115008
|
|
Virus
|
HBV |
|
Gene Type
|
protein-coding |
|
HPA Location Info
|
Cytosol;Secreted to blood; 
|
|
Membrane Info
|
Cancer-related genes, Human disease related genes, Plasma proteins, Predicted intracellular proteins, Predicted secreted proteins, Transporters |
|
Uniport_ID
|
P01583
|
|
HGNC ID
|
HGNC:5991
|
|
OMIM ID
|
147760 |
|
Summary
|
The protein encoded by this gene is a member of the interleukin 1 cytokine family. This cytokine is a pleiotropic cytokine involved in various immune responses, inflammatory processes, and hematopoiesis. This cytokine is produced by monocytes and macrophages as a proprotein, which is proteolytically processed and released in response to cell injury, and thus induces apoptosis. This gene and eight other interleukin 1 family genes form a cytokine gene cluster on chromosome 2. It has been suggested that the polymorphism of these genes is associated with rheumatoid arthritis and Alzheimer's disease. [provided by RefSeq, Jul 2008] |
Target gene [IL1A] related to virus gene/protein/region 
Mutation Table: if previous studies reported that target gene was related to virus gene/region/protein, the information in this literature was listed in this section
Target gene [IL1A] related to Omics data
| Data ID |
Experiment type |
Sample number |
Platform |
|
GSE236281
|
RNA-seq |
12 |
Illumina MiSeq (Homo sapiens) |
|
C GSE35465
|
Chip-seq;RNA-seq |
6 |
Illumina HiSeq 2000 (Homo sapiens) |
|
C GSE68402
|
Chip-seq |
26 |
Illumina MiSeq (Homo sapiens);Illumina HiSeq 2500 (Homo sapiens) |
|
TCGA_LIHC_HBV
|
DNA methylation sequencing;RNA-seq |
97 |
TCGA |
|
C GSE270130
|
Chip-seq |
27 |
Illumina NovaSeq 6000 (Homo sapiens) |
|
GSE224901
|
RNA-seq |
21 |
Illumina NovaSeq 6000 (Homo sapiens) |
|
GSE100400
|
Chip-seq;RNA-seq;4C_cccDNA |
31 |
Illumina NextSeq 500 (Homo sapiens);Illumina NextSeq 500 (Mus musculus) |
|
GSE173897
|
RNA-seq |
95 |
Illumina HiSeq 4000 (Homo sapiens) |
|
GSE262515
|
RNA-seq |
21 |
Illumina HiSeq 2500 (Homo sapiens);Illumina HiSeq 2500 (Mus musculus) |
|
GSE110345
|
RNA-seq |
4 |
Illumina HiSeq 2500 (Homo sapiens) |
|
C GSE131257
|
ATAC-seq;RNA-seq |
19 |
Illumina HiSeq 2500 (Homo sapiens) |
|
GSE94660
|
RNA-seq |
42 |
Illumina HiSeq 2500 (Homo sapiens) |
When the gene can detect a peak in the dataset, a peak plot will be displayed.
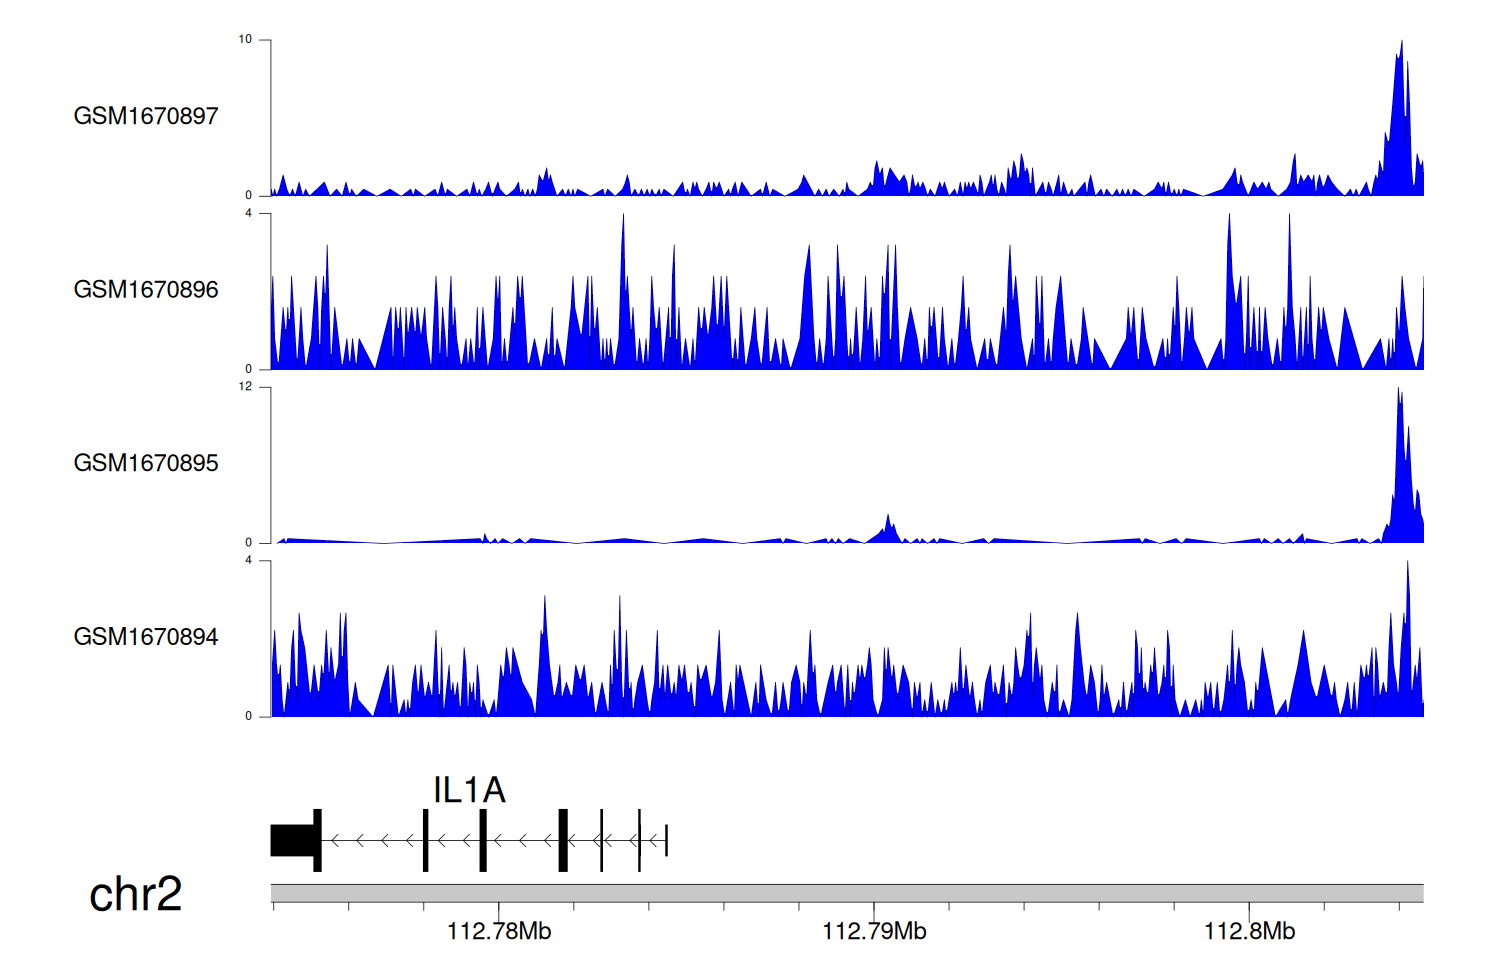
> Dataset: GSE35465 - IL1A peak across samples
|
Peak Plot

|
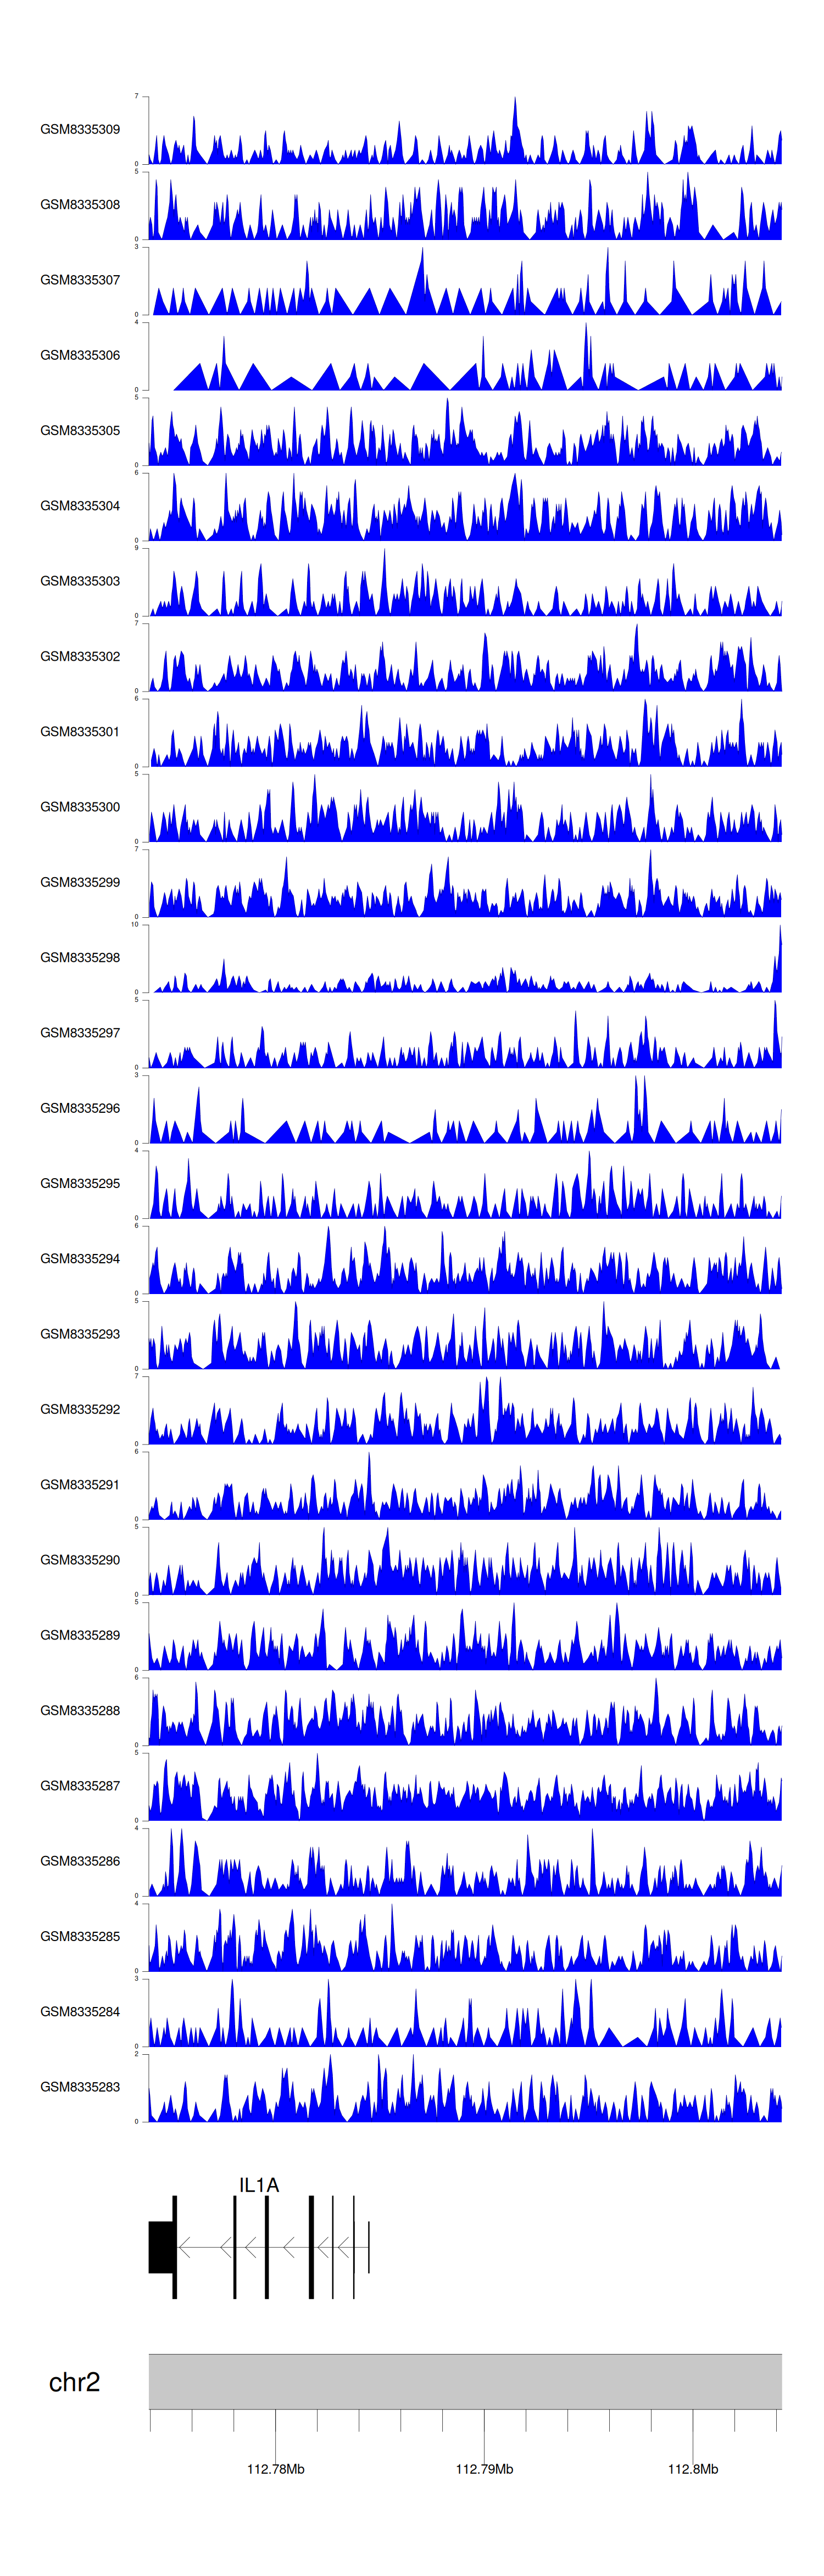
> Dataset: GSE68402 - IL1A peak across samples
|
Peak Plot
|
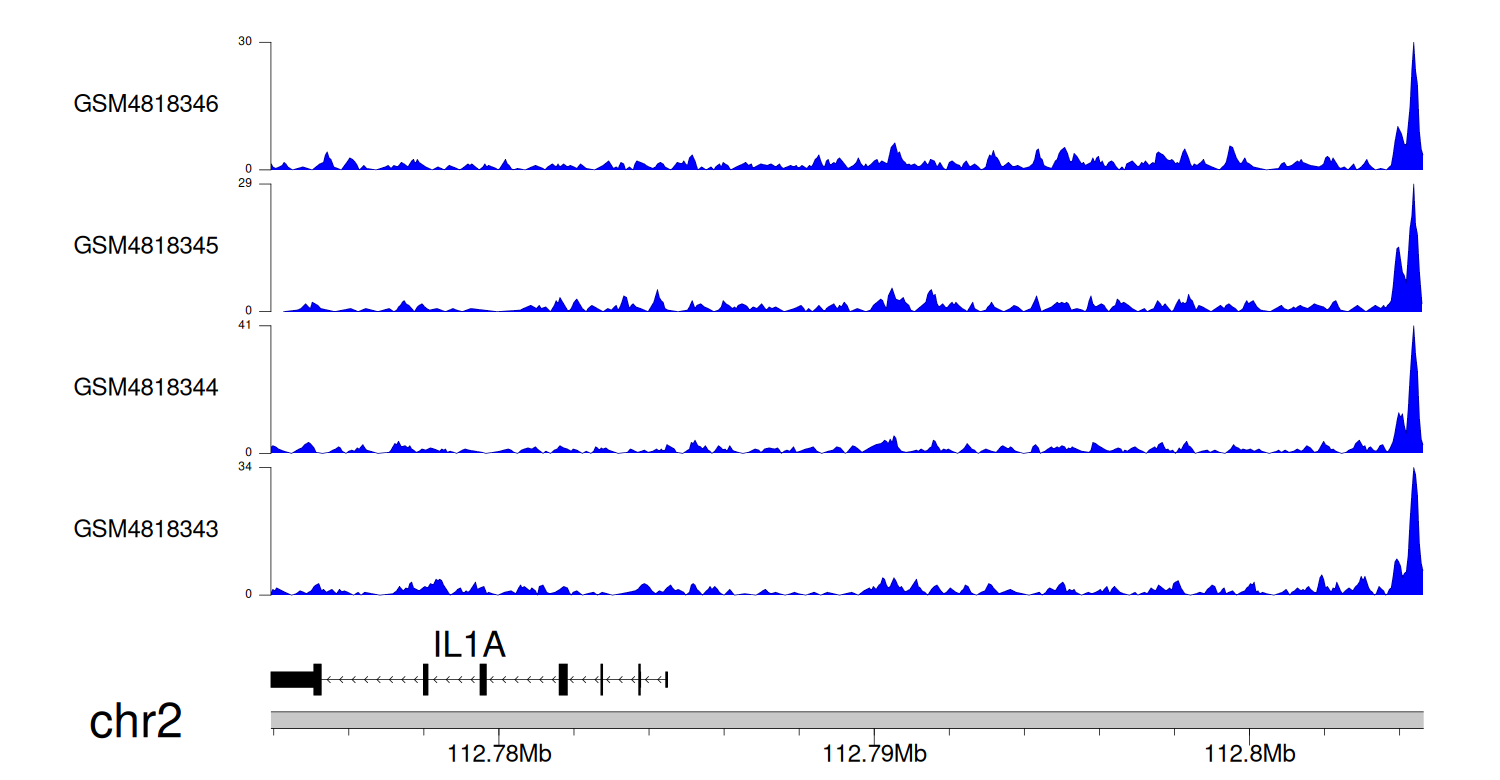
> Dataset: GSE270130 - IL1A peak across samples
|
Peak Plot
|
> Dataset: GSE131257 - IL1A peak across samples
|
Peak Plot
|
|
|
