Gene Information
|
Gene Name
|
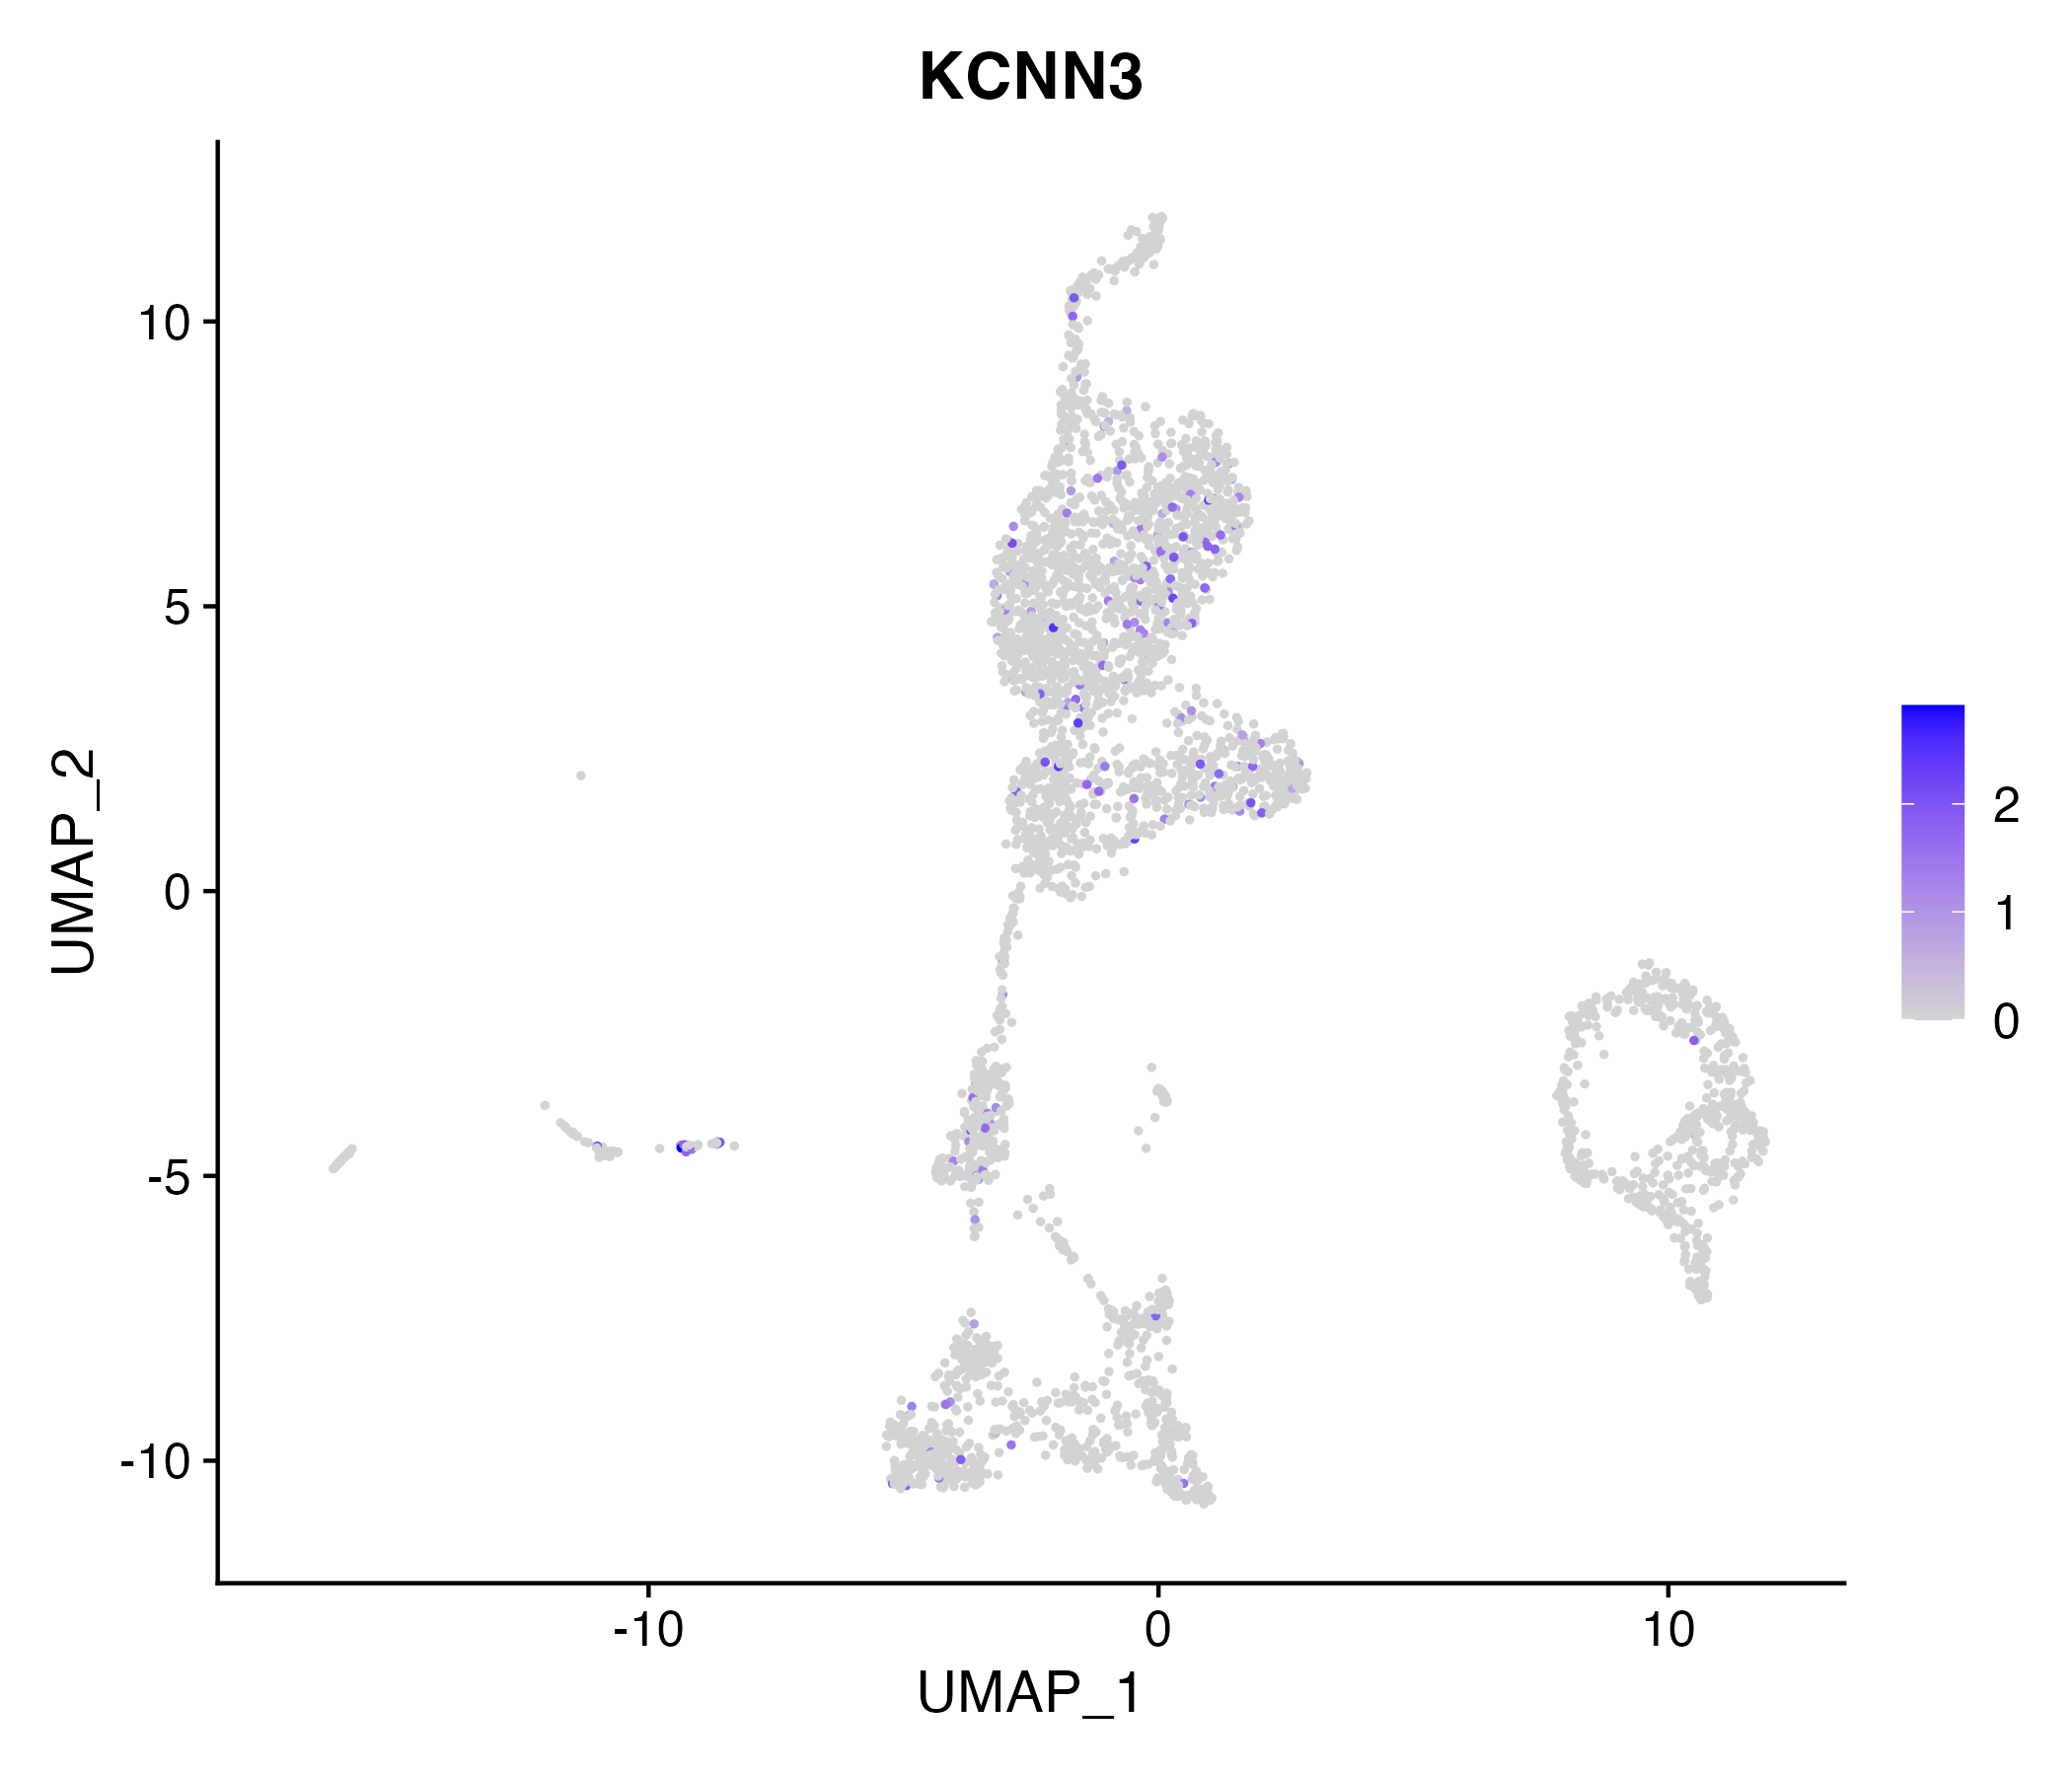
KCNN3 |
|
Gene ID
|
3782
|
|
Gene Full Name
|
potassium calcium-activated channel subfamily N member 3 |
|
Gene Alias
|
KCa2.3|SK3|SKCA3|ZLS3|hSK3 |
|
Transcripts
|
ENSG00000143603
|
|
Virus
|
HBV |
|
Gene Type
|
protein-coding |
|
HPA Location Info
|
Plasma membrane, Cytosol; 
|
|
Membrane Info
|
Disease related genes, FDA approved drug targets, Human disease related genes, Predicted membrane proteins, Transporters, Voltage-gated ion channels |
|
Uniport_ID
|
Q9UGI6
|
|
HGNC ID
|
HGNC:6292
|
|
OMIM ID
|
602983 |
|
Summary
|
Action potentials in vertebrate neurons are followed by an afterhyperpolarization (AHP) that may persist for several seconds and may have profound consequences for the firing pattern of the neuron. Each component of the AHP is kinetically distinct and is mediated by different calcium-activated potassium channels. This gene belongs to the KCNN family of potassium channels. It encodes an integral membrane protein that forms a voltage-independent calcium-activated channel, which is thought to regulate neuronal excitability by contributing to the slow component of synaptic AHP. This gene contains two CAG repeat regions in the coding sequence. It was thought that expansion of one or both of these repeats could lead to an increased susceptibility to schizophrenia or bipolar disorder, but studies indicate that this is probably not the case. Alternatively spliced transcript variants encoding different isoforms have been found for this gene. [provided by RefSeq, Feb 2011] |
Target gene [KCNN3] related to VISs 
Integration Table: if previous studies reported that target gene was altered by virus integration events, the overlap between VISs in this literature and Cistrome factors was listed in this section
| DVID |
Chromosome |
HM |
TFBS |
CA |
Sum of Overlapped Records |
Detail |
| 1010913 |
chr1 |
10 |
0 |
0 |
10 |
View |
| 1013457 |
chr1 |
0 |
5 |
0 |
5 |
View |
| 1020530 |
chr1 |
15 |
0 |
7 |
22 |
View |
| 1022840 |
chr1 |
10 |
0 |
0 |
10 |
View |
Target gene [KCNN3] related to Omics data
| Data ID |
Experiment type |
Sample number |
Platform |
|
GSE236281
|
RNA-seq |
12 |
Illumina MiSeq (Homo sapiens) |
|
C GSE35465
|
Chip-seq;RNA-seq |
6 |
Illumina HiSeq 2000 (Homo sapiens) |
|
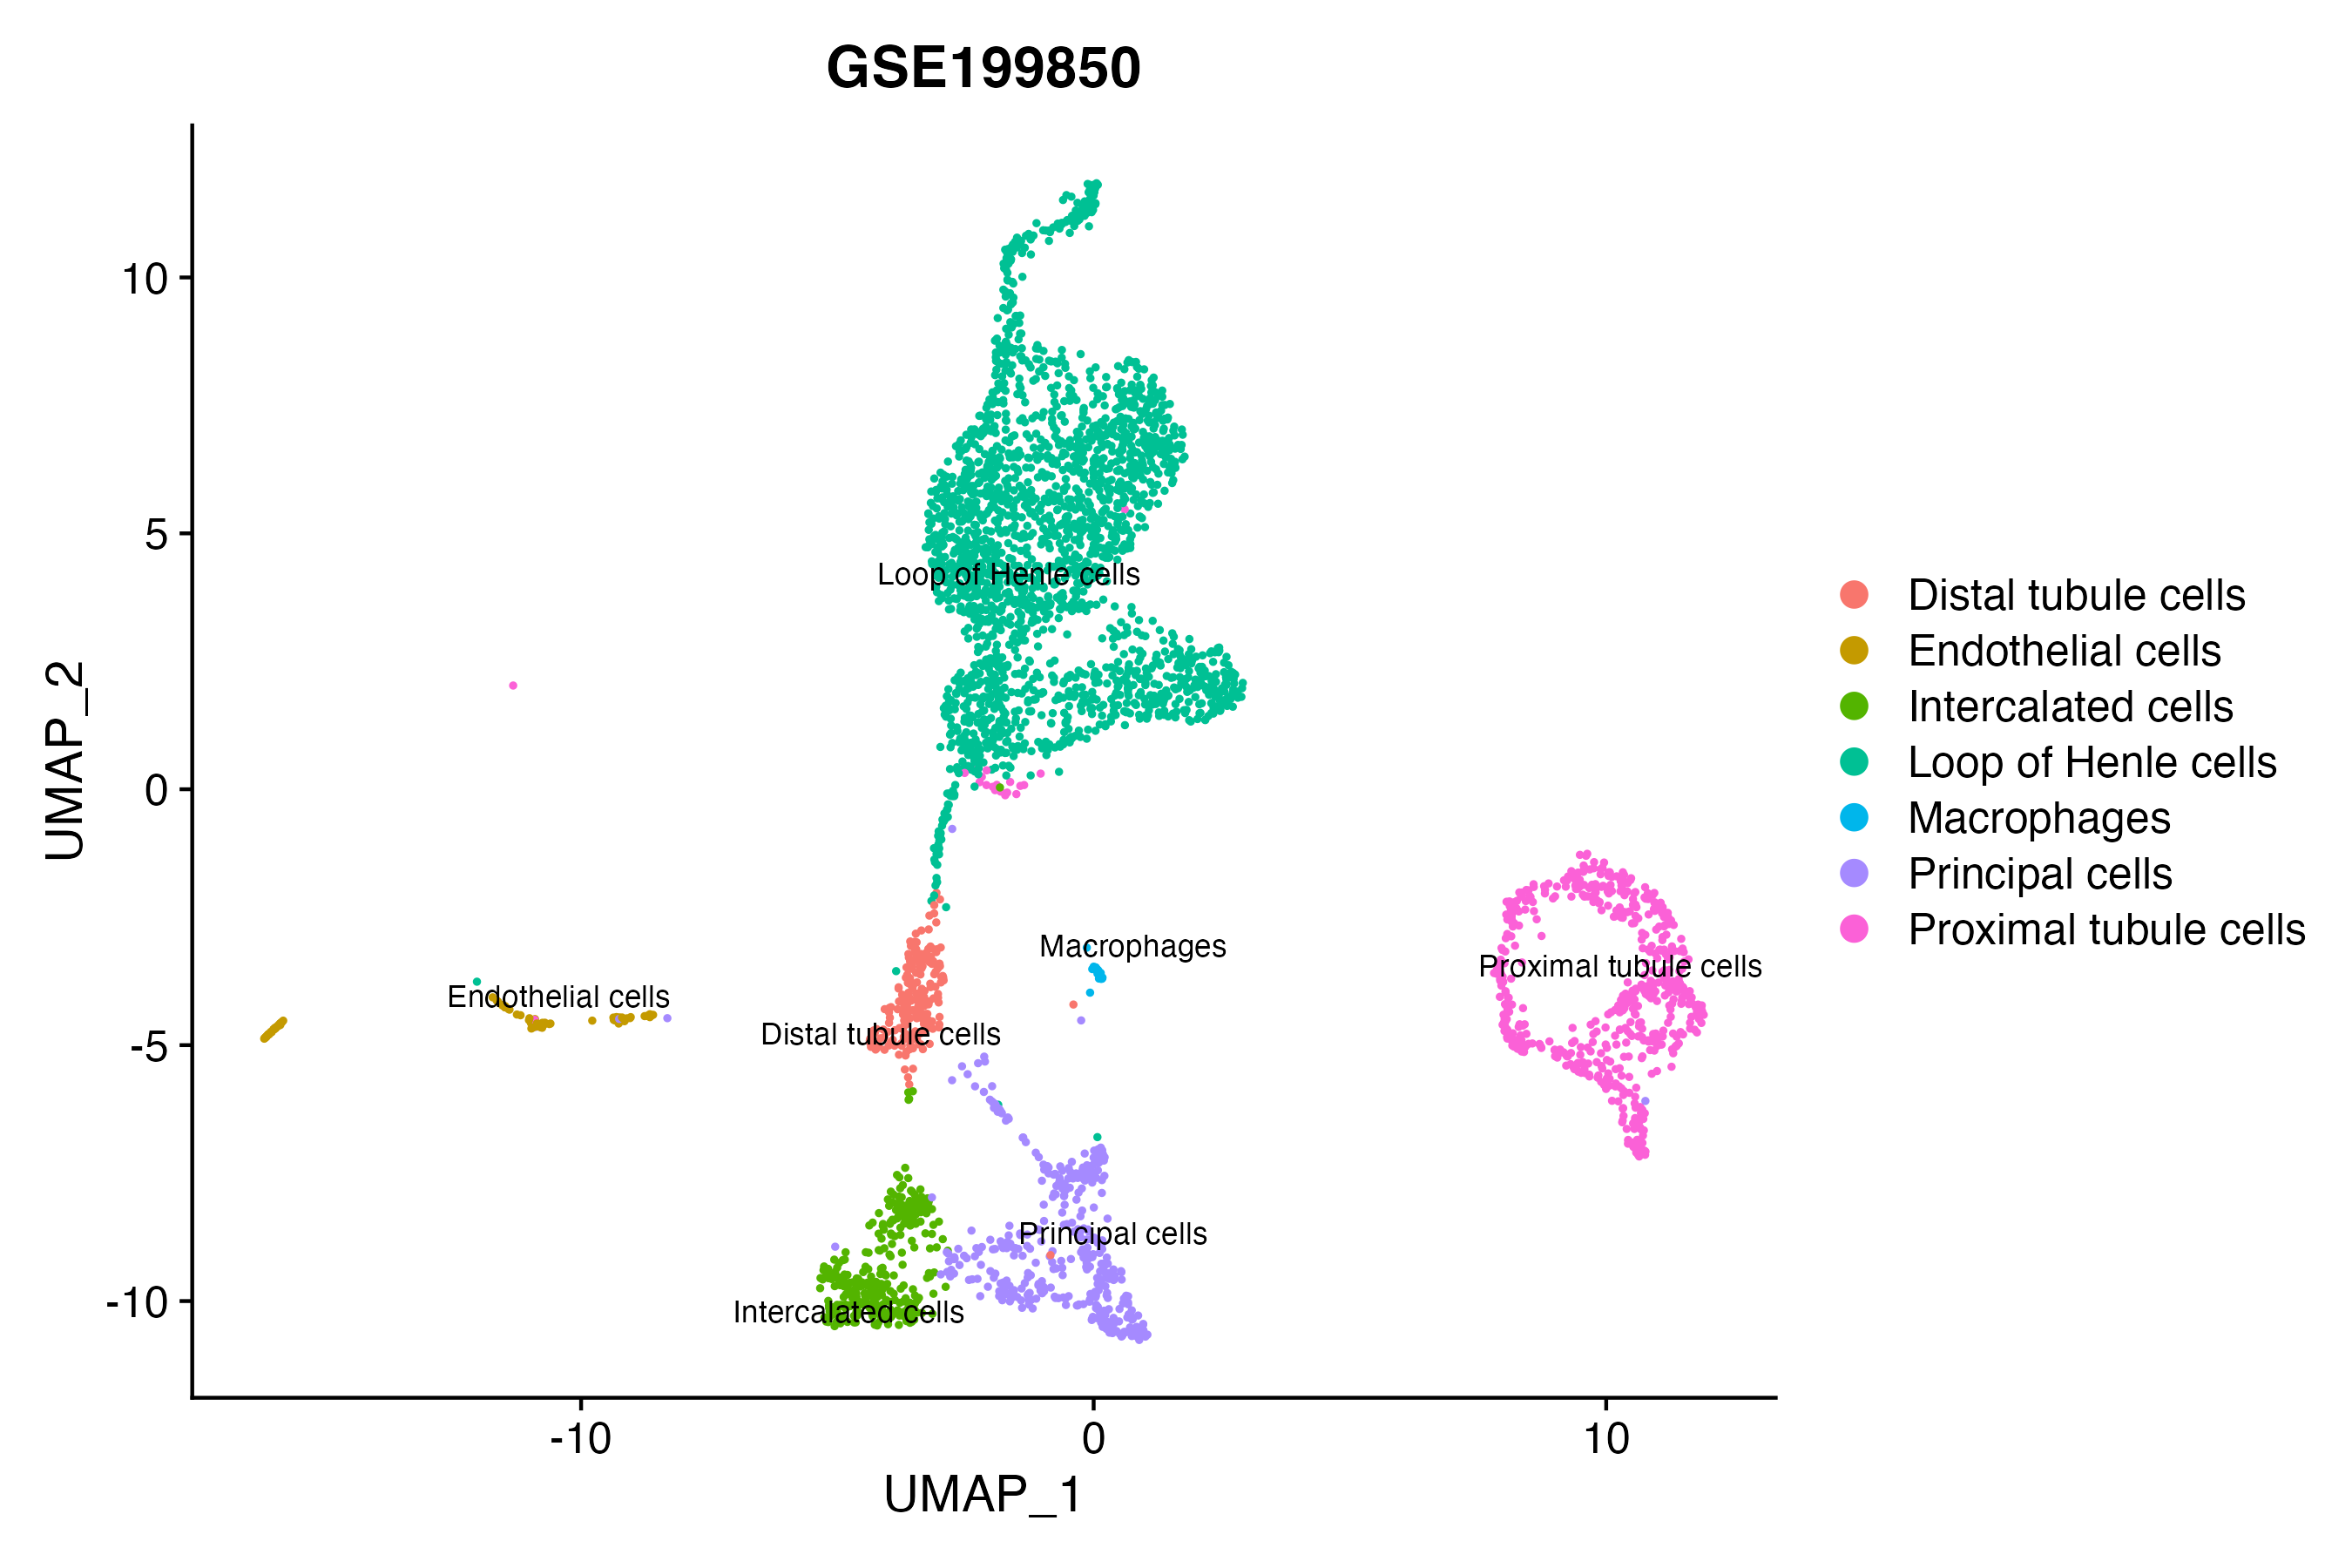
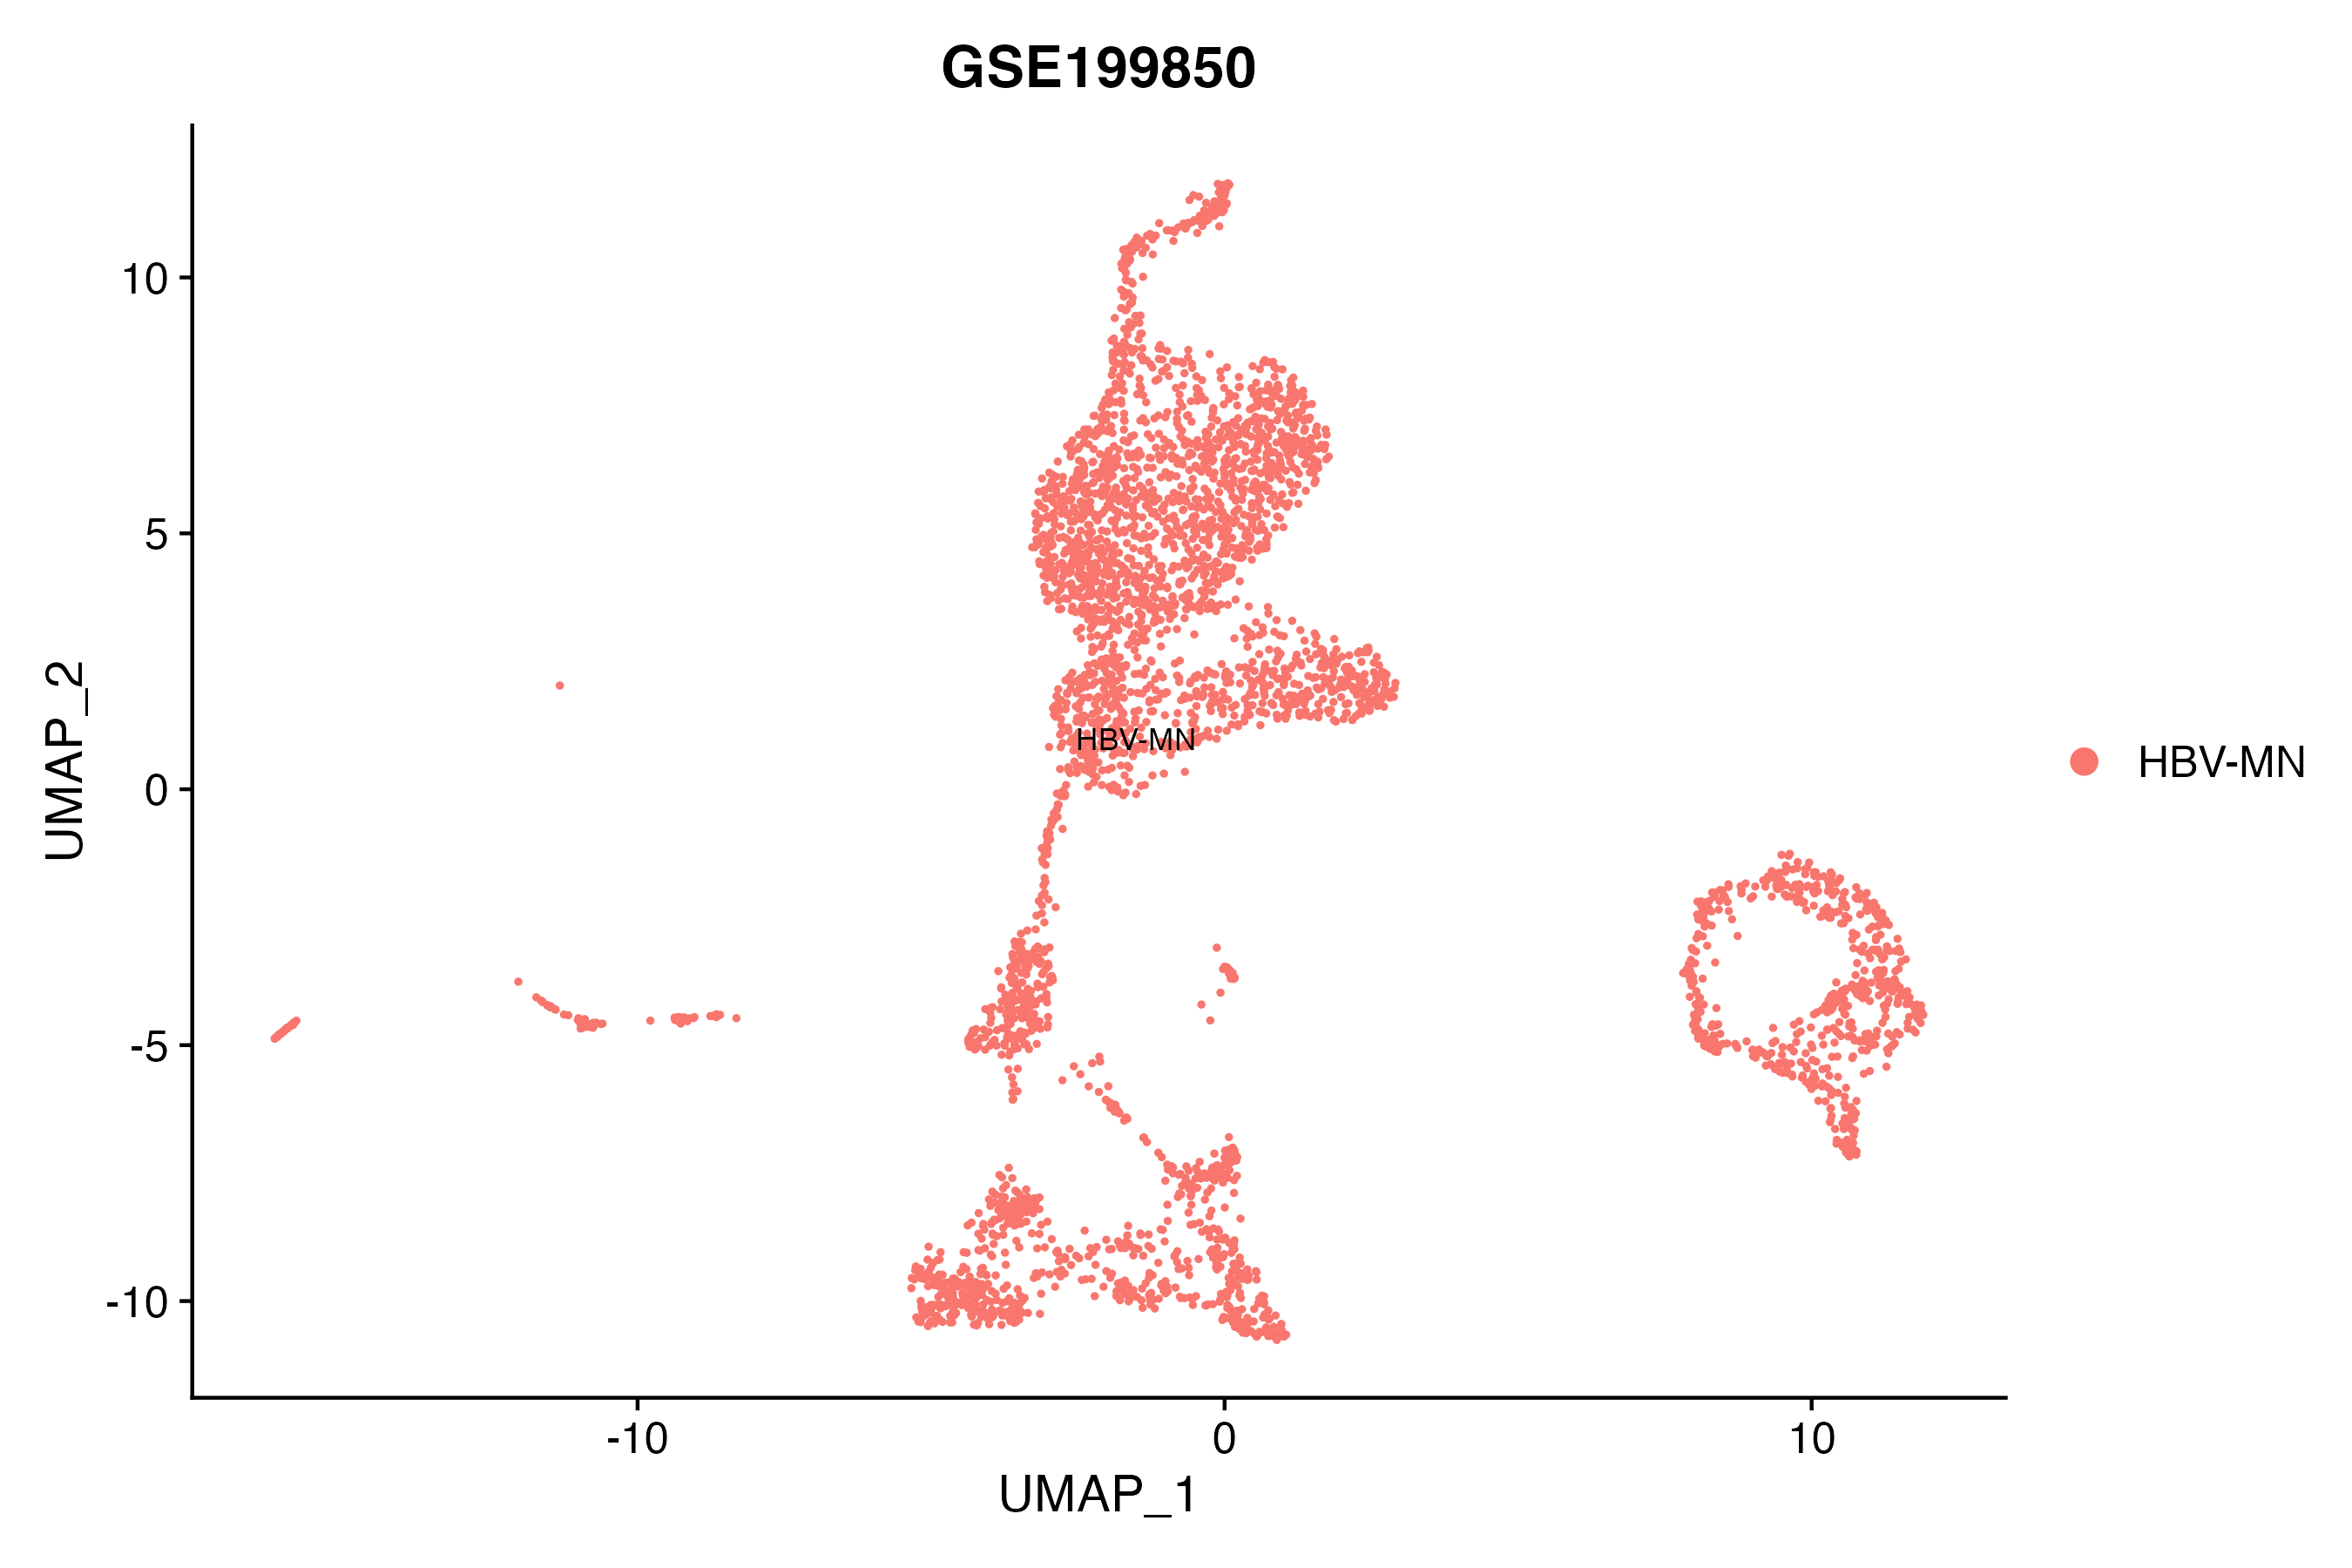
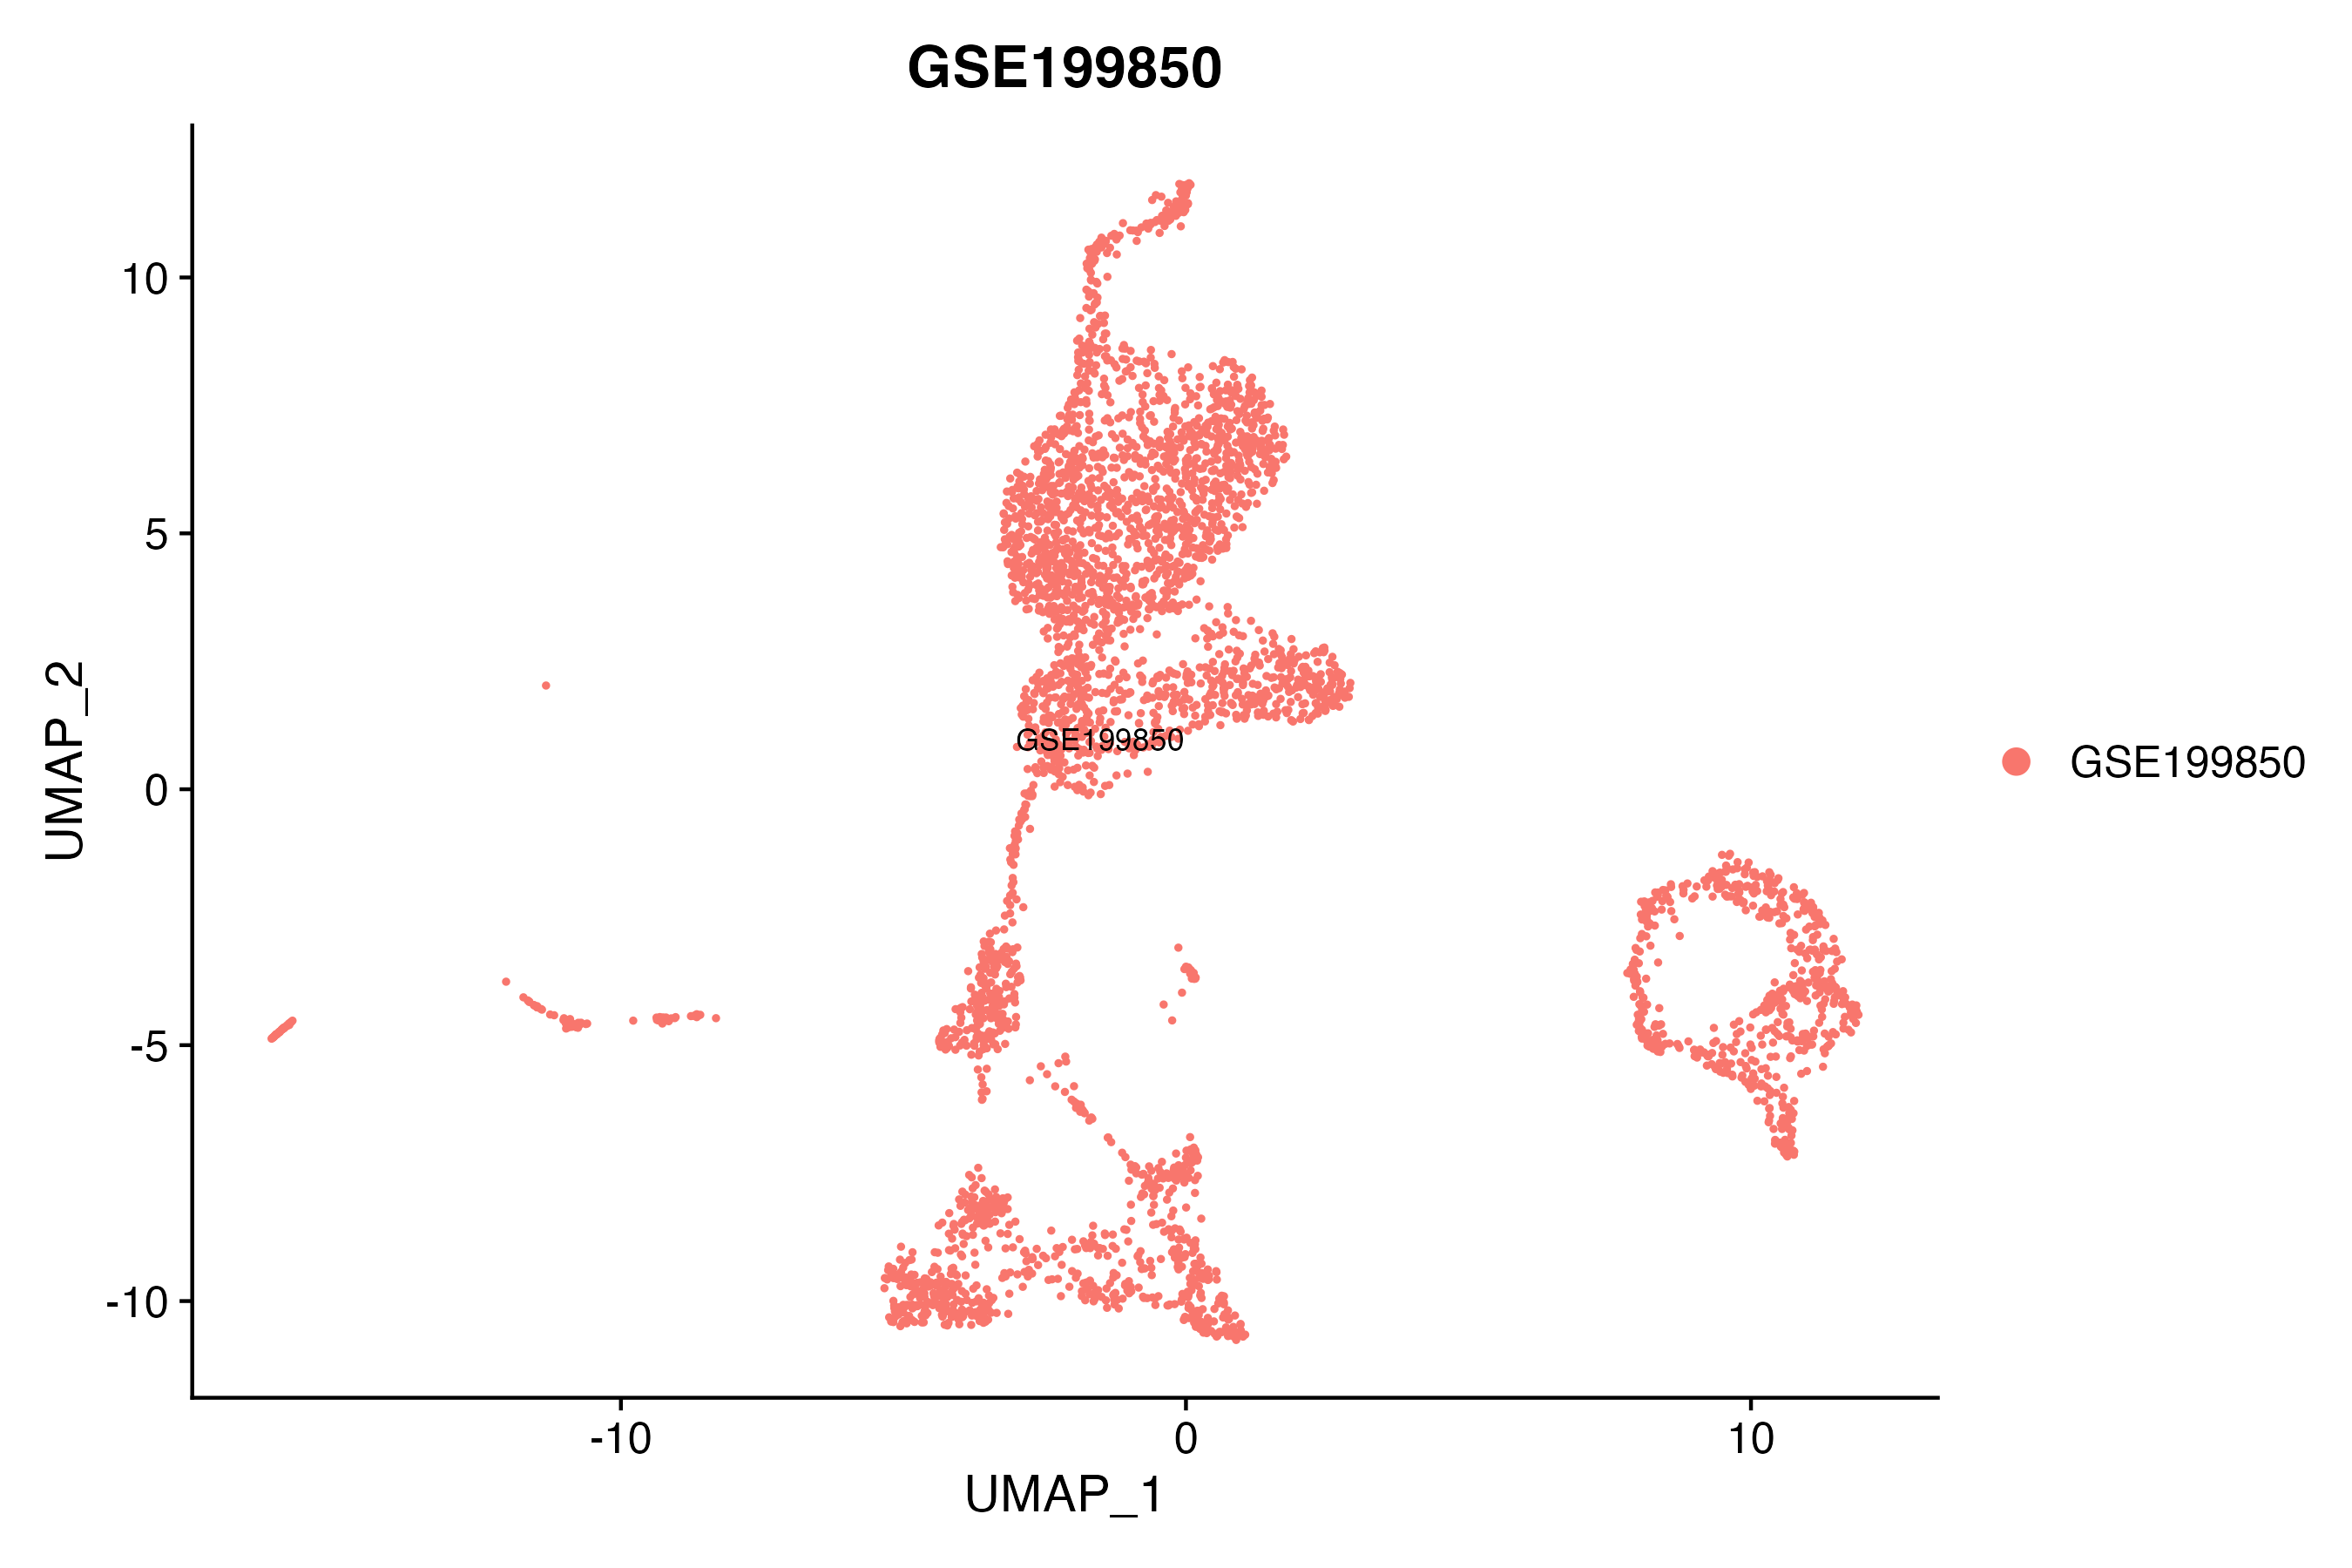
S GSE199850
|
scRNA-seq |
1 |
HiSeq X Ten (Homo sapiens) |
|
C GSE68402
|
Chip-seq |
26 |
Illumina MiSeq (Homo sapiens);Illumina HiSeq 2500 (Homo sapiens) |
|
TCGA_LIHC_HBV
|
DNA methylation sequencing;RNA-seq |
97 |
TCGA |
|
C GSE270130
|
Chip-seq |
27 |
Illumina NovaSeq 6000 (Homo sapiens) |
|
GSE224901
|
RNA-seq |
21 |
Illumina NovaSeq 6000 (Homo sapiens) |
|
GSE100400
|
Chip-seq;RNA-seq;4C_cccDNA |
31 |
Illumina NextSeq 500 (Homo sapiens);Illumina NextSeq 500 (Mus musculus) |
|
GSE173897
|
RNA-seq |
95 |
Illumina HiSeq 4000 (Homo sapiens) |
|
GSE262515
|
RNA-seq |
21 |
Illumina HiSeq 2500 (Homo sapiens);Illumina HiSeq 2500 (Mus musculus) |
|
GSE110345
|
RNA-seq |
4 |
Illumina HiSeq 2500 (Homo sapiens) |
|
C GSE131257
|
ATAC-seq;RNA-seq |
19 |
Illumina HiSeq 2500 (Homo sapiens) |
|
GSE94660
|
RNA-seq |
42 |
Illumina HiSeq 2500 (Homo sapiens) |
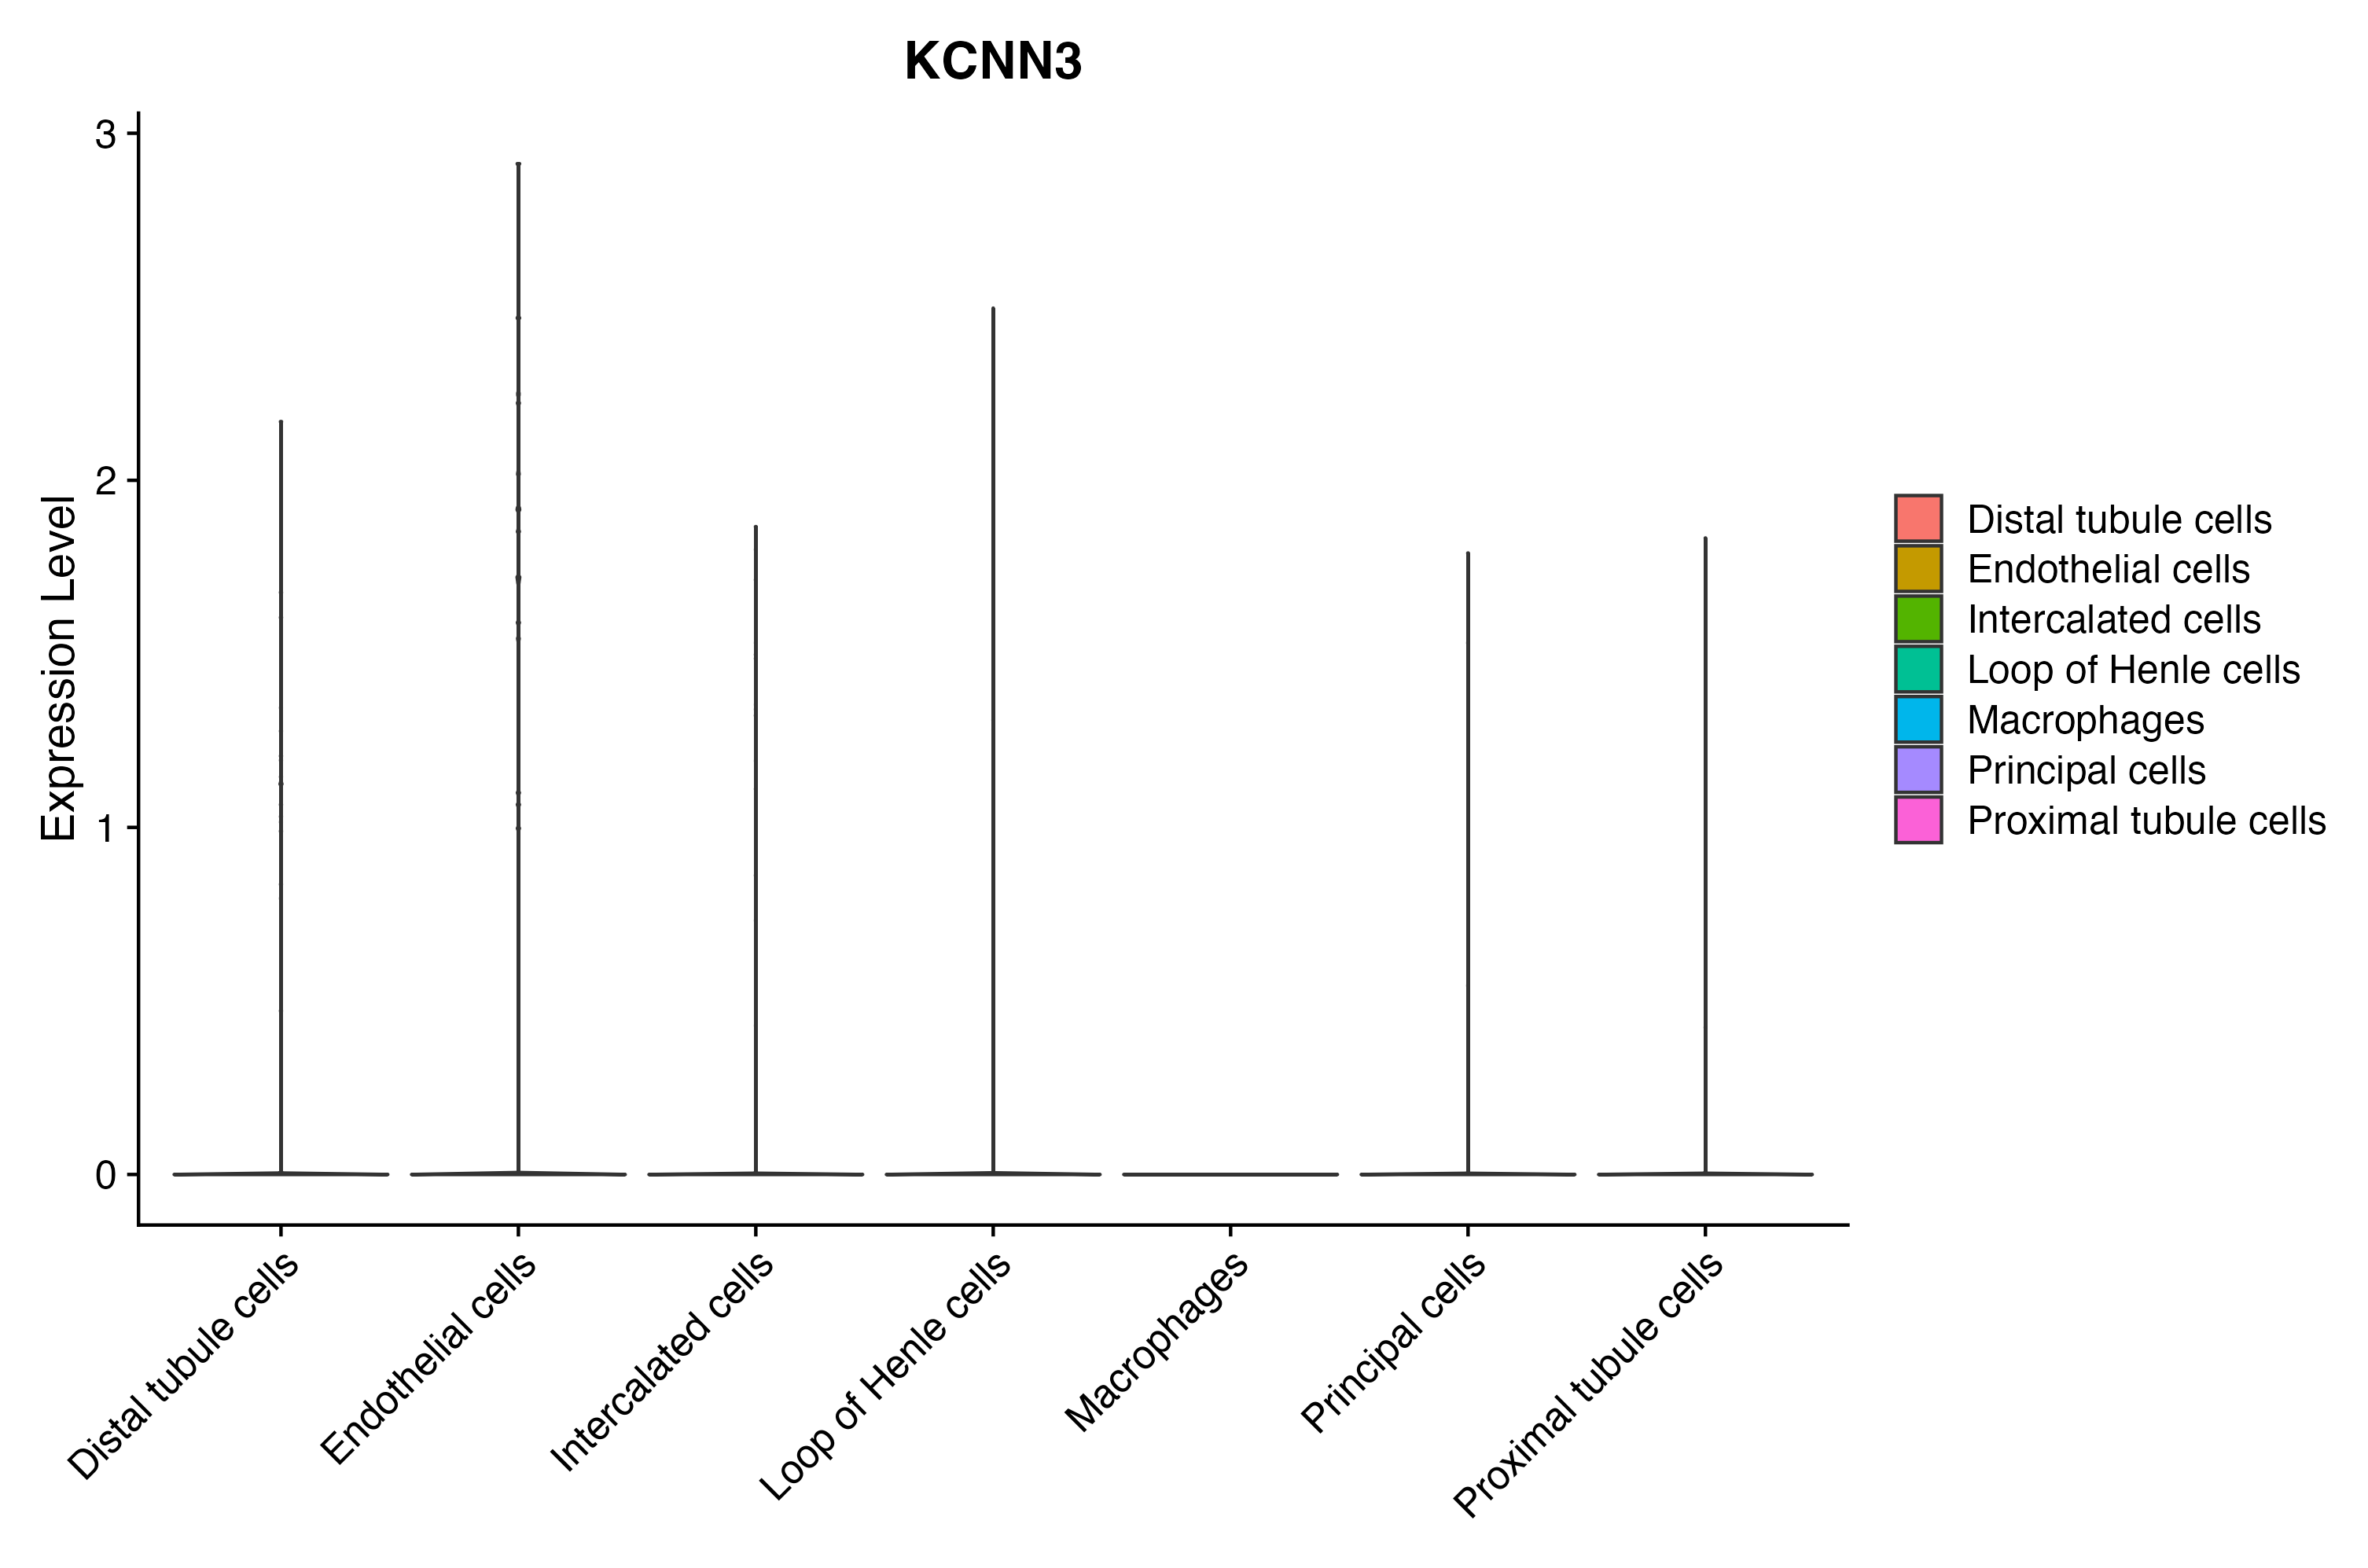
When the query gene is differentially changed in the dataset, a feature/violin plot will be displayed.
> Dataset: GSE199850 - Gene expression in cell subsets
|
|
|
|
|
|
|
|
